Protecting Victoria’s Biodiversity
Snapshot
Will the management of Victoria’s biodiversity loss halt the decline of threatened species?
Why this audit is important
Victoria's biodiversity provides the foundations of healthy ecosystems, such as clean air and water, productive soils, natural pest control, pollination and flood mitigation. Threatened species and their habitats are critical to our biodiversity.
Victoria's biodiversity continues to decline. The State of the Environment 2018 report states that a third of all of Victoria's terrestrial plants, birds, reptiles, amphibians, mammals, invertebrates and ecological communities are threatened with extinction.
Who we examined
We examined the Department of Environment, Land, Water and Planning (DELWP).
What we examined
How well DELWP is acquitting its responsibilities under the Flora and Fauna Guarantee Act 1988 and in Protecting Victoria’s Environment—Biodiversity 2037 to better protect threatened species.
What we concluded
DELWP cannot demonstrate if, or how well, it is halting further decline in Victoria's threatened species populations.
DELWP aims to choose cost effective protection actions that benefit the greatest number of threatened species. To this end, it uses modelling tools to support its decisions. These tools are better practice by design.
However, much of the data used in the models is old and likely outdated, and has some critical gaps. This raises questions about the reliability of the modelled outputs and the decisions they support.
DELWP’s cost-benefit approach can also miss endangered threatened species at extreme risk of extinction. DELWP has no transparent, risk-based process to prioritise these species for management.
Further, DELWP continues to make limited use of available legislative tools to protect threatened species.
Funding available to DELWP to protect species falls significantly short of what it predicts is needed. However, DELWP has not provided detailed, evidence-based advice to the government about the cost and benefits of protecting and monitoring threatened species to support further investment.
It also lacks performance indicators and reporting to demonstrate the impact of its management interventions on halting the decline of threatened species.
What we recommended
We made nine recommendations to DELWP about improving:
- its monitoring, and reporting the impacts of its prioritised management actions
- the currency and comprehensiveness of the data and knowledge underpinning its decision-support tools
- its use of the available legislative tools
- its advice to government about funding needs and species prioritisation.
DELWP accepted all nine recommendations.
Video presentation
Key facts
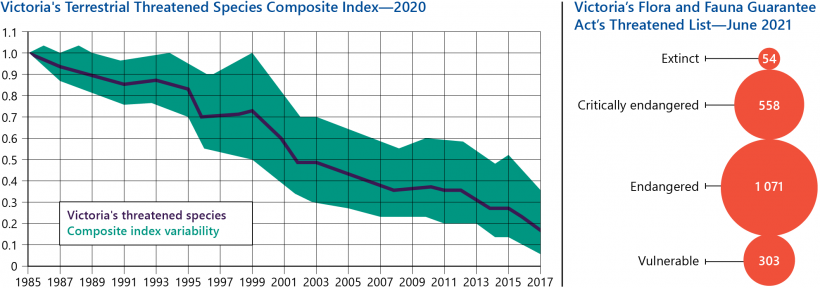
Note: * The base year is 1985, which has an index score of one. A score of 0.9 means a 10 per cent decrease compared to the 1985 average.
Source: Australian Government-funded Threatened Species Recovery Hub, 2020.
What we found and recommend
We consulted with the Department of Environment, Land, Water and Planning (DELWP), Parks Victoria and Trust for Nature and considered their views when reaching our conclusions. The agencies' full responses are in Appendix A.
DELWP's performance and accountability framework for halting threatened species decline
Alignment between DELWP’s approach and the legislative objective
DELWP has a pragmatic approach to protecting biodiversity and threatened species. Protecting Victoria’s Environment—Biodiversity 2037's (Biodiversity 2037) goal of ‘Victoria’s natural environment is healthy’ and targeting ‘a net improvement in the outlook across all species by 2037’ clearly expresses this.
Biodiversity 2037 focuses on implementing broad actions across a landscape to protect the greatest number of species. DELWP explains that these actions have the potential to benefit up to 80 per cent of threatened species, but will not benefit all endangered and critically endangered species. Options to protect these individual species are balanced against what can be achieved for the greatest number of species, where interventions for individual species are expensive or have a relatively poor chance of success. DELWP advised us that since Biodiversity 2037 was released in 2017, its focus has been on developing a set of better-practice tools to support cost effective decision making to protect the greatest number of species possible.
This approach, however, is not fully aligned with the objectives of the Flora and Fauna Guarantee Act 1988 (FFG Act). The Act's objectives include ‘to guarantee that all of Victoria’s flora and fauna’ ‘can persist and improve in the wild’, and ‘prevent’ ‘flora and fauna from becoming threatened and to recover threatened’ species so that ‘their conservation status improves’.
The government's 2016 review of the FFG Act recommended changes to its objectives on the basis they were not achievable or measurable. In 2016, DELWP recommended the 'guarantee' be removed and replaced with wording to secure the protection and recovery of the greatest number of flora and fauna species possible. However, DELWP's recommendations were not adopted in the FFG Act amendments passed in 2019.
Biodiversity 2037’s expected outcomes do not require the:
- protection and persistence of all threatened species in the wild. Instead, they focus on protecting the greatest number possible
- prevention of all flora and fauna from becoming threatened.
For example, Biodiversity 2037 includes the target:
‘… that all critically endangered and endangered species will have at least one option available for being conserved ex situ or re-established in the wild (where feasible under climate change) should they need it’.
There is no requirement or target for how many of these options are enacted or what their results may be in terms of species persisting and/or improving in the wild, as per the FFG objective.
DELWP advised us that it cannot guarantee the protection of all threatened species given:
- current funding levels
- scientific constraints around how species respond to threats and actions to control these in the wild, particularly in a time of climate change
- the long-term lag effects on Victoria’s biodiversity of over 200 years of colonisation.
This is a reasonable argument, but DELWP has not clearly communicated to the government or the public this gap between the FFG Act objectives and the approach taken through Biodiversity 2037. The Act creates an expectation among stakeholders that all species will be protected and there will be no further decline in threatened species status. The misalignment of expectations could lead to community concern and a lack of confidence in the government to protect threatened species.
DELWP's biodiversity and threatened species reporting
DELWP's reporting on biodiversity protection, including threatened species, lacks accountability and comprehensiveness. It tells Parliament and the public little about the cost, quality or effectiveness of the work DELWP delivers to support its overall objective, as stated in Budget Paper No. 3: Service Delivery 2020–21 (BP3) of ‘a healthy and resilient biodiverse environment’. It also tells us little about whether Victoria is on track to meet Biodiversity 2037’s statewide target of a net improvement in the outlook across all species by 2037.
Reporting to Parliament and the public
DELWP uses the BP3 and its annual performance statements to report to Parliament on the services it delivers. Parliament and the public cannot effectively use this reporting to scrutinise and assess DELWP’s performance in cost-effectively spending public funds to protect Victoria’s biodiversity and its threatened species.
DELWP’s reporting is not comprehensive due to the gaps and flaws in its BP3 and performance reporting frameworks. Its reported performance indicators and measures do not:
- fully comply with the Department of Treasury and Finance's (DTF) 2020 Resource Management Framework (RMF) for departmental performance reporting
- measure DELWP's service efficiency or effectiveness
- present DELWP's performance information in a way that enables efficient and effective analysis.
DELWP’s BP3 performance reporting framework states that the objective of its services is to deliver ‘a healthy and resilient biodiverse environment’. It has only one relevant departmental objective indicator to measure and report progress in its performance in meeting this objective—‘participation in community-based environmental programs’. This indicator alone is not sufficient to provide a comprehensive assessment and report on the status of the state’s biodiversity.
DELWP’s BP3 output performance measures that are relevant to a healthy and resilient biodiverse environment measure the number of threat control activities and hectares of land treated to controls threats. For example, they relate to weeds, invasive predators and the amount of public land revegetated or private land protected. While these are appropriate measures of the quantity of activity outputs, they are not supported by measures of the quality and cost-effectiveness of activities to deliver the performance objective. DELWP’s focus on measuring changes in species' habitats through hectares treated also means that it does not report on other key legislated activities to protect biodiversity, such as completing action plans for threatened species.
Reporting progress against Biodiversity 2037 targets
DELWP’s annual Biodiversity 2037 reporting does not provide the required assurance to Parliament and the public about the state's progress in achieving the strategy’s statewide target and expected outcomes for threatened species.
Annual reporting of outputs and management outcomes
DELWP's 2019 Biodiversity 2037 Monitoring, Evaluation, Reporting and Improvements Framework (MERF) requires DELWP to annually report progress against Biodiversity 2037's statewide target and expected outcomes. DELWP uses 15 key performance indicators (KPIs) identified in the MERF to measure its performance in protecting threatened species' habitats and persistence.
CSH is the measure DELWP uses to predict the benefits of on-ground actions to protect threatened species' persistence.
Ten of the 12 annual KPIs focus on the number of threat control activities, number of hectares treated for threats or revegetated, and the amount of private land protected. These KPIs have similar flaws to DELWP's BP3 output performance measures as they do not address the quality of the activities and their effectiveness in delivering Biodiversity 2037's expected outcomes.
The MERF lists two further KPIs that could be used to measure short-term management outcomes of Biodiversity 2037 activities to improve species' habitats and persistence, but there is no requirement in the MERF to report against these. These are:
- (on average) per cent Change in Suitable Habitat (CSH) from sustained improved management for threatened species
- percentage of all species with positive per cent CSH from sustained improved management.
The Commissioner provides independent scientific reporting to inform policymakers, scientists, and the public on Victoria's natural environment. The Commissioner does this by preparing a five yearly report about the health of our environment.
The Commissioner for Environmental Sustainability (the Commissioner) has also commented on the lack of outcome reporting for biodiversity and threatened species in successive State of the Environment reports. In 2018 the Commissioner reported one of the key biodiversity management challenges is ‘annual reporting on biodiversity investment programs to increase transparency of spending and improve consistency and accuracy of results and outcomes from management actions …’
Five-year reporting
The FFG Act requires the Commissioner to report no later than five years after the making of the first biodiversity strategy, and every five years after, on progress against its expected outcomes. Due to coronavirus-related delays, the first five-year Biodiversity report is now due in 2023.
The Commissioner relies on DELWP to provide threatened species data and analysis to report comprehensively every five years as to whether threatened species outlooks are improving. However, DELWP’s two KPIs to measure species status and trends do not provide a comprehensive and reliable assessment of species status and trends:
|
DELWP’s Biodiversity 2037 KPI to measure species … |
is flawed because … |
This means … |
|
status—number of vulnerable species or near threatened species that have become endangered using DELWP’s individual species risk extinction status assessments |
the indicator only requires an assessment of status changes in two out of the five classes of threatened species. |
the indicator, for example, excludes species that change from near vulnerable to vulnerable, or endangered to critically endangered, and therefore provides a very limited view of species status |
|
status assessments for some species are not comprehensive due to a lack of knowledge and data. |
reported results for species status may be inaccurate. |
|
|
trends—Threatened Species Index* |
indices are available only for an extremely limited number of species currently—for example, less than 8 per cent of nationally listed threatened plants. |
most Victorian threatened species do not have an index and are therefore not covered by reporting against this indicator. |
*The Threatened Species Index was established in 2018 by the National Environmental Science Program’s Threatened Species Recovery Hub, the University of Queensland and BirdLife Australia. It brings together monitoring data to develop indices that allow the government, non-government organisations and the community to better understand and report on trends for threatened species.
Subsequently, DELWP does not have the data to provide to the Commissioner to report progress against Biodiversity 2037’s statewide target of improving the net outlook for all threatened species by 2037.
There are also broader issues that will likely limit the Commissioner’s ability to report on DELWP’s progress against Biodiversity 2037's statewide target and expected outcomes for threatened species and also limit DELWP’s ability to monitor its own performance.
|
To report and monitor effectively, DELWP and the Commissioner need … |
However … |
|
comprehensive biodiversity and threatened species data. |
DELWP is yet to establish a targeted program, including long-term monitoring, for threatened species. In addition, there is no central point or agency that coordinates and collates biodiversity and threatened species reporting and data. Only 12 per cent of agencies responsible for biodiversity assets reported information to DELWP in 2018. |
|
data on outcomes. |
the impact of many DELWP-funded threatened species programs cannot be determined as DELWP and funded agencies do not routinely specify and report against on-ground outcomes. |
Long-term threatened species monitoring program
DELWP’s ability to assess the effectiveness of its Biodiversity 2037-prioritised programs and activities on threatened species status and trends is limited. This is because there are few appropriately designed and targeted monitoring programs to collect this data. DELWP has also not developed guidelines, in contrast to New South Wales (NSW), which provide standard guidance to estimate and evaluate species' responses to management interventions.
Without these, DELWP cannot:
- assess whether its activities to protect and improve threatened species' persistence are effective and sufficient
- provide adequate assurance to Parliament and the public about the cost effectiveness of its programs to protect threatened species
- assess species trends and status to report against Biodiversity 2037’s statewide target.
Options for monitoring and reporting impacts of threatened species programs
DELWP has been aware of the limitations in its capacity to report biodiversity conservation outcomes since the first Victorian State of the Environment report in 2008. All biodiversity conservation programs, including those for threatened species, must evaluate whether the species, habitat or threat is responding to management as expected. A spectrum of monitoring and reporting options allow an agency to answer this question, including:
- the amount of threat management and expected benefit, including its alignment to, and coverage of, priorities
- the demonstrated reduction of threat intensity and any change in threatened species numbers
- monitoring and reporting underlying trends and understanding the particular contribution of interventions.
DELWP's monitoring and reporting programs focus on the amount of threat management, with very limited monitoring and reporting around threat intensity and on-ground changes to threatened species populations.
DELWP is also yet to develop or use reliable indicators to monitor and report underlying trends and understand the contribution of its prioritised interventions.
Scientific literature states it is neither practical nor possible to monitor all threatened species' responses to management interventions.
DELWP began a project in 2019 to develop a set of common biodiversity indicators, including ones for threatened species to support monitoring and reporting of the impacts of its prioritised management interventions. DELWP has yet to complete the project, which was due mid-2021, due to resourcing issues.
Recommendations about the effectiveness of DELWP's measuring and reporting on its actions to halt species decline
| We recommend that the: | Response | |
|---|---|---|
| Department of Environment, Land, Water and Planning | 1. reviews its Budget Paper 3 objective indicators and output performance measures, in consultation with the Department of Treasury and Finance, to ensure it meaningfully reports against its objective of a healthy and resilient biodiverse environment, as per requirements in the Resource Management Framework (see Section 2.2) | Accepted |
| 2. reviews the relevant key performance indicators to assess species trends and status listed in its Biodiversity 2037 Monitoring, Evaluation, Reporting and Improvements Framework to more meaningfully report on changes to species status and trends over time (see Section 2.2) | Accepted | |
| 3. develops, implements and reports against a targeted monitoring program/s to assess and evaluate species’ responses to management interventions (see Section 2.2) | Accepted | |
| 4. includes the revised monitoring program and/or indicators as per recommendations 2 and 3 in the Biodiversity 2037 Monitoring, Evaluation, Reporting and Improvements Framework or as a set of separate but aligned documents (see Section 2.2). | Accepted |
DELWP's approach to halt threatened species decline
DELWP continually works to improve its approach to cost-effectively protect the greatest number of threatened species possible and halt overall species decline. However, its limited use of the legislative tools available to it and gaps in critical data and knowledge underpinning its decision-support tools continue to impede DELWP’s ability to meet this Biodiversity 2037 statewide target and its expected outcomes.
FFG Act’s legislative tools to protect threatened species
Our 2009 audit Administration of the Flora and Fauna Guarantee Act 1988 identified that the FFG Act was poorly implemented, with many of its legal tools to protect flora and fauna never used. DELWP has made little progress in addressing this issue and continues to underuse these tools, which are intended to guide and support species protection.
A listed species is included on the Threatened List, which is established and maintained under the FFG Act.
DELWP continues to underuse action statements. Under the FFG Act, DELWP must develop action statements to protect all listed threatened species. In our 2009 audit we reported that only 42 per cent of listed species, communities or potentially threatening processes had an approved action statement. This backlog of action statements has only worsened due to the increased number of listed species following FFG Act amendments in 2019.
As of June 2021, the number of listed species has almost tripled since the FFG Act amendments. At present, DELWP has developed action statements covering 20 per cent of listed species. Many of these action statements are greater than 10 years old and may no longer reflect a species' status or current and emerging threats to species' persistence.
DELWP advised us that action statements take significant time and resources to develop, and it is working on a project to streamline their preparation to address the current backlog. DELWP did not receive government funding to implement this project, as requested in its 2020–21 budget bid.
DELWP's data and decision-support tools
Since 2017, DELWP has focused on improving the cost-effectiveness of its decision making to protect threatened species. DELWP intends to achieve this through the set of decision-making tools it has developed under Biodiversity 2037. Together, these tools model the predicted distribution of threatened species, spatially predict the benefits of threat reduction for many species, identify costs and allow the comparison and ranking of actions within and between locations to determine the most cost-effective management intervention.
These specific tools and their purposes are outlined in Figure A.
FIGURE A: DELWP's decision-support tools and purposes
| Tool | Purpose |
|---|---|
| Strategic management prospects (SMP) | DELWP’s primary decision-support tool to support the prioritisation of cost-effective management actions that provide the greatest benefit to the greatest number of threatened species. |
| Habitat distribution models (HDMs) | HDMs are models that predict the likely presence of a species across the state. Predictions are based on Victorian Biodiversity Atlas (VBA) data and expert and local knowledge. |
| Specific needs analysis (SNA) | SNA is a tool for prioritising bespoke actions for species that fall out of DELWP’s SMP analyses. These are generally endangered and critically endangered species. |
Note: DELWP's VBA is the primary data repository for threatened species information across Victoria.
Source: VAGO.
DELWP engaged scientific experts to review the development and use of these tools. The review declared the tools’ purposes and designs to be better practice. However, critical gaps in the data and knowledge inputs to these tools undermines the comprehensiveness of tool inputs and therefore the reliability and accuracy of their outputs. For example:
- DELWP does not review and update the models and data underpinning its tools according to its schedule specified in the Biodiversity 2037 business case. DELWP depended on obtaining funds requested in its 2017 Biodiversity 2037 business case to meet the schedule's milestones. It did not receive these funds.
- DELWP's SMP tool is limited to common land-based threats, such as weed and pest invasion. The tool is yet to include threats to freshwater and marine species.
- Where DELWP does not have data from on-ground studies, it relies on expert knowledge about species and their responses to threats. However, there are critical gaps in this knowledge and expert judgements can vary significantly, meaning at times, DELWP uses best estimates to fill these gaps.
- HDMs determining listed species’ presence and location have not been developed for all species. DELWP has developed HDMs for 1 420 out of 1 991 listed species.
- VBA data underpinning the tools is not current for many key threatened species.
Addressing critical knowledge gaps
DELWP recognises the gaps in its VBA species data and threatened species knowledge. It worked with a range of stakeholders to develop its 2020 Biodiversity Knowledge Framework. This framework sets a consistent and transparent process for identifying critical data and knowledge gaps in the data underpinning DELWP’s decision support tools. DELWP has also developed a Knowledge Portal, which is an interactive tool to highlight and support stakeholders to prioritise and fill the critical gaps identified through its Biodiversity Knowledge Framework process.
We cannot assess the effectiveness of these efforts as DELWP has only recently finalised these two resources. While the Biodiversity Knowledge Framework identifies and prioritises gaps, the key hurdle we identified to fill these effectively is consistent and adequate allocation of resources to undertake the work.
DELWP is developing an investment strategy to support the identification and allocation of resources to undertake this work. This remains in draft, despite commencing in January 2019 and DELWP has not set a date for its finalisation. In the meantime, DELWP is working with stakeholders to identify and investigate models and funding options to improve biodiversity and threatened species knowledge and data. This includes formalising an agreement with the University of Melbourne to develop a centre that will coordinate the identification, collection, collation and analysis of biodiversity research and data and develop evidence-based policies and programs to improve biodiversity and threatened species protection.
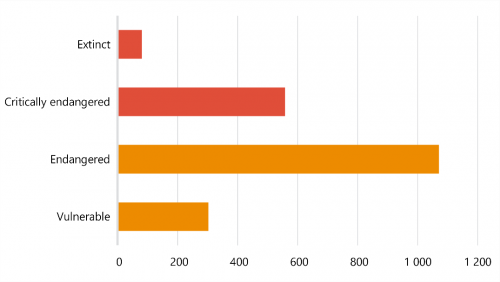
Prioritising critically endangered species at extreme risk of extinction for protection
DELWP does not have a transparent systematic tool or process to prioritise the protection of critically endangered species not protected through the treatment and control of common landscape scale threats.
DELWP’s landscape approach prioritises actions that provide the greatest benefit to the greatest number of species. It prioritises actions that target broad-scale common threats, such as weeds and pest predators. These actions tend to mostly target the habitats and, therefore persistence, of vulnerable species with flow-on benefits for the protection of some near vulnerable and endangered species (see Figure 1H).
DELWP advised us that a small number of critically endangered species will also co benefit from landscape actions to control common threats to vulnerable species, but DELWP has not quantified which or the number species predicted to benefit. DELWP's SMP and HDMs together can potentially predict which species are or are not catered for by prioritised actions to control landscape threats, but DELWP does not consistently or comprehensively document this as part of its planning to prioritise and fund on-ground actions. However, without targeted on-ground monitoring programs to validate key predictions, they can only be viewed as modelled assumptions.
The FFG Act Threatened List includes 556 critically endangered species, many of which may not be adequately protected by DELWP's approach to prioritise common landscape threats. Many likely require individualised, targeted or bespoke actions. However, current funding levels do not allow for all these species to be protected by individual bespoke programs to halt their decline or prevent their extinction.
DELWP's processes for choosing which individual critically threatened species to protect with the available funding lack:
- transparency—decisions are not clearly justified and communicated to all stakeholders and the community
- objectivity—decisions and priorities are not based on consistently applying an evidence-based approach, but rather a disparate set of decision-making factors
- scientific rigour—the collection, analysis and use of data for its current species choices is not rigorous, and decisions to prioritise and continue funding are not based on the best available evidence
- cost-effectiveness—investment decisions are not based on maximising expected return in terms of outcomes relative to cost.
DELWP allocates approximately 86.5 per cent of Biodiversity 2037 on-ground program funding to controlling landscape threats, which predominantly protects vulnerable threatened species.
Approximately 13.5 per cent of DELWP's Biodiversity 2037 on-ground funding specifically targets individual critically endangered species. These critically endangered species make up 28 per cent of all threatened species listed.
DELWP funds two key programs, the Icon Species program and Faunal Emblems Program, to protect nine critically endangered and one vulnerable threatened species. The State of the Environment 2018 report and other published reports shows that the majority of these species have not improved in status or outlook over the last 10 years. Examples include the Leadbeater's possum, Baw Baw frog and the Spotted Tree frog.
Approaches by other jurisdictions, such as the NSW and Australian governments, transparently prioritise the protection of key critically endangered species, including iconic and site-based species, using a consistent set of transparent, scientifically rigorous decision making criteria. This approach is supported by a strategy to protect species subject to common landscape threats.
Prioritising actions for critically endangered species
Once DELWP, or another protection body, identifies an individual species for individual intervention, DELWP or the body can use DELWP's SNA decision-support tool to predict and prioritise the most cost-effective action or actions to protect that species. DELWP has not yet fully integrated the use of this tool into its overall approach under Biodiversity 2037 to protect threatened species.
DELWP has only completed SNAs for 9 per cent (49 of 556) of critically endangered species. It does these on an ad hoc basis, including when it receives additional funding in its annual budget allocation or a request from another protection body. For example, DELWP completed most of its 49 SNAs in 2020 for threatened species whose populations were critically impacted by the 2019–20 bushfires through the Victorian Government's 2020 $43 million Bushfire Biodiversity Response and Recovery program.
DELWP’s lack of a systematic transparent process or tool to prioritise critically endangered species for individual bespoke management, coupled with its limited integration of its SNA tool into its decision-making processes, are critical flaws in its approach to protect the greatest number of threatened species from decline and extinction.
Recommendations about DELWP's tools to protect threatened species
| We recommend that the: | Response | |
|---|---|---|
| Department of Environment, Land, Water and Planning | 5. prioritises species for development of action statements, develops these and oversees their timely implementation, evaluation, monitoring and reporting (see Section 3.1) | Accepted |
| 6. develops and applies a set of risk-based criteria to prioritise critically endangered species at extreme risk of extinction for funding and action (see Section 3.3) | Accepted | |
| 7. formalises a process and engages accordingly with key stakeholders to prioritise and fund critical knowledge and data gaps identified in the Biodiversity Knowledge Framework and Knowledge Portal (see Section 3.2). | Accepted |
Threatened species funding
Costing threatened species protection
National and state reviews of threatened species investment have identified limited funding and the poor cost-effectiveness of interventions as major impediments to halting the decline in threatened species populations.
While DELWP has developed better-practice tools to help it identify and prioritise more cost-effective landscape scale actions to protect the greatest number of species, total funding levels and fund prioritisation continues to be a significant issue.
An icon species is a popular and widely recognised species chosen to raise support for biodiversity conservation in a given place or social context.
As part of its Biodiversity 2037 business case, DELWP advised the government in 2017 that it required at least $196.4 million (Figure B, option 2) in government funding over four years to deliver Biodiversity 2037 priorities and to protect DELWP's 10 threatened icon species. It also advised the government that it needed $58 million in ongoing annual funding after 2021 to meet Biodiversity 2037's statewide target to improve the net outlook for all species by 2037.
Figure B shows the predicted impacts of DELWP's funding options presented to the government in DELWP’s 2017 Biodiversity 2037 business case.
FIGURE B: DELWP's predicted impacts of funding options in its Biodiversity 2037 business case
Source: VAGO, based on DELWP's 2017 Biodiversity 2037 business case.
In 2017, DELWP received $86.3 million (option 1), less than half what it requested, in government funding over four years to implement Biodiversity 2037. The government also projected DELWP would receive $20 million per annum after 2021 for Biodiversity 2037’s ongoing implementation—approximately a third of what it requested.
DELWP supported its business case with generalised evidence and information, with broad costing options and their impacts for the protection of its icon species. However, DELWP's advice lacked reference to evidence-based costings for all listed threatened (not just icon) species. DELWP also did not provide the government with costings for targeted monitoring programs required to assess the impacts of its prioritised management actions on species status and trends over medium to longer terms.
Since 2017, DELWP has not provided further advice to the government through its Budget bids about the impacts of the funding received against the predicted impacts of the funded option in its business case. It has also not provided updated impacts of funding levels and costings given the increased number of species that are now listed as threatened under the FFG Act.
Biodiversity 2037 notes that one of the essential elements of the plan is to establish sustained funding for biodiversity and leverage non-government investment to achieve this. DELWP’s four-year implementation plan sets out its commitment to investigate and adopt alternative funding models to secure sustained funding. DELWP began this work in 2019 in collaboration with key stakeholders and is finalising its draft investment strategy. DELWP has not set a deadline for completing this work.
DELWP’s delays in completing and implementing its investment strategy, and thereby attracting non-government investment funds, further hinders the implementation of Biodiversity 2037 and the work needed to protect Victoria's threatened species.
Recommendations about costing to halt the decline of threatened species
| We recommend that the: | Response | |
|---|---|---|
| Department of Environment, Land, Water and Planning | 8. provides updated, comprehensive, scientific and evidence-based advice to the government on the ongoing resources required to improve the net outlook for all threatened species listed under the Flora and Fauna Guarantee Act 1988 (see Section 3.4) | Accepted |
| 9. provides advice to the government about the investment required to protect and recover prioritised critically endangered species at extreme risk of extinction, identified through recommendation 6 (see Section 3.4). | Accepted |
1. Audit Context
Victoria's biodiversity, including native flora and fauna and their habitats, has been declining since European settlement. Victoria has lost around 80 species, and currently 1 991 are at risk of extinction. Current and emerging threats, such as land clearing, the introduction of new pest plants and animals, and the impact of climate change continue to put our native plants and animals at increasing risk of decline and extinction.
DELWP is responsible for overseeing the implementation of Victorian legislation to minimise biodiversity loss and improve threatened species protection and outlooks.
This chapter provides essential background information about:
1.1 The importance of biodiversity
Biodiversity is the variety of all living things on Earth—all the creatures, plants, fungi and microorganisms, as well as their genetic information. These all work together in ecosystems like an intricate web, maintaining balance and supporting life and wellbeing, including for humans.
The importance of biodiversity to humans
The air we breathe, the water we drink, the food we eat, and medicine we need all depend on plants, animals and organisms and their interactions with each other and their habitats. Without this biological diversity, ecosystems and the delicate interactions between their biological elements may be disturbed or break.
As shown in Figure 1A, biodiversity is important to many other parts of human life.
FIGURE 1A: Five related benefits of biodiversity to humans
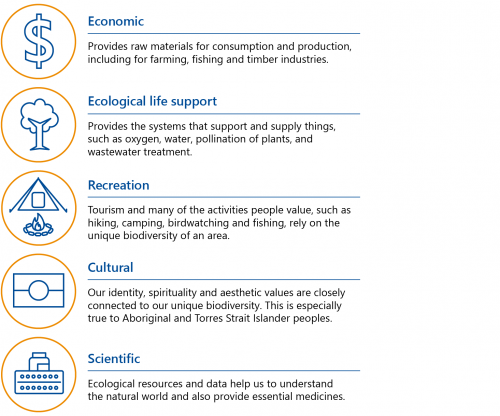
Source: VAGO, based on information from the former Australian Government Department of the Environment and Energy's Australia state of the environment 2016.
Victoria's native plants and animals
More than 80 per cent of Australia's mammals and 90 per cent of our trees, ferns and shrubs occur nowhere else on earth. A number of these species are unique to Victoria, including the Leadbeater’s possum (as shown in Figure 1B), the Helmeted Honeyeater and the Baw Baw frog.
Aside from their intrinsic value, Victoria's flora and fauna bring important economic benefits. Local and international tourism contributes $26 billion a year to Victoria’s economy. Of this, $1.4 billion is spent visiting Victoria’s parks and reserves to experience our unique plants and animals.
FIGURE 1B: Case study: Victoria's Leadbeater's possum
Leadbeater's possum, Victoria's faunal emblem, is critically endangered.
The Leadbeater's possum (Gymnobelideus leadbeateri) is found only in Victoria. It lives primarily in the ash forests and subalpine woodlands of the central highlands, with a small lowland population to the east of Melbourne. Zoos Victoria estimates there are fewer than 40 of the lowland population left in the wild.
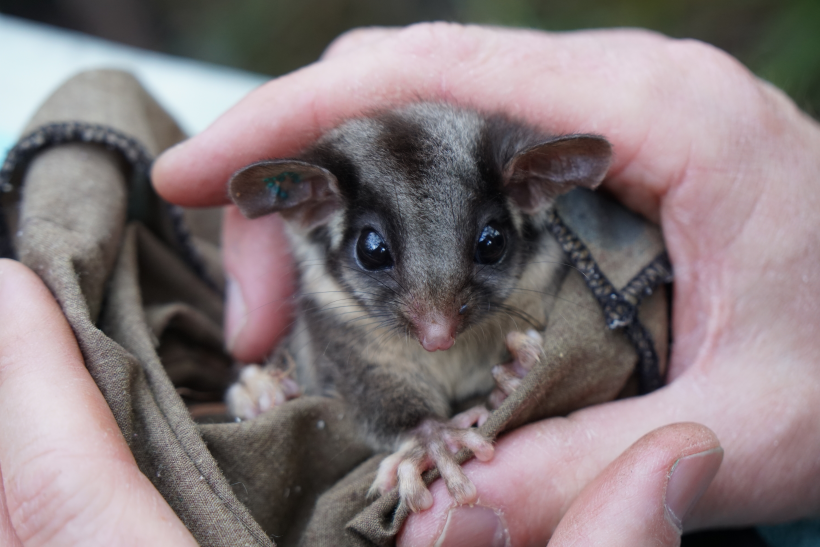
Source: VAGO, based on public information from Zoos Victoria and DELWP, including the image of a Leadbeater's possum.
1.2 Threats to species
A threatened species is any native animal or plant species that is at risk of extinction due to direct or indirect threats to their habitat. Threats include:
- land clearing for development and agriculture
- resource extraction, including logging
- bushfires or poorly planned and managed controlled burns
- the introduction of pest plants and animals
- changes to environmental flow in waterways
- pollution
- disease and pathogens
- climate change
Categorising threatened species
The International Union for Conservation of Nature (IUCN), the foremost authority on threatened species, uses a tiered categorisation system, from highest to lowest risk of extinction.
As shown in Figure 1C, IUCN defines each category using its Red List Guidelines.
FIGURE 1C: IUCN Red List Guidelines for categorising threatened species
| Category | Definition |
|---|---|
| Extinct | There is no reasonable doubt that last individual has died. |
| Extinct in the wild | The species is known only to survive in cultivation, in captivity or as a naturalised population (or populations) outside the past range, or it is not known to survive in its known or expected habitat. |
| Critically endangered | The best available evidence indicates that it meets any of the criteria for critically endangered, and therefore it is considered to be facing an extremely high risk of extinction in the wild. |
| Endangered | The best available evidence indicates that it meets any of the criteria for endangered, and it is therefore considered to be facing a very high risk of extinction in the wild. |
| Vulnerable | The best available evidence indicates that the species meets any of the criteria for vulnerable, and it is therefore considered to be facing a high risk of extinction in the wild. |
| Near threatened | The species has been evaluated against the criteria but does not qualify for critically endangered, endangered or vulnerable now, but is close to qualifying for or is likely to qualify for a threatened category in the near future. |
| Least concern | The species has been evaluated against the criteria but does not qualify for critically endangered, endangered, vulnerable or near threatened. Widespread and abundant species are included in this category. |
| Data deficient | There is inadequate information to make a direct, or indirect, assessment of the species risk of extinction based on its distribution and/or population. Listing in this category indicates that more information is required and acknowledges the possibility that future research will show that threatened classification is appropriate. |
| Not evaluated | A species has not yet been evaluated against the criteria. |
Source: VAGO, based on IUCN's 2012 Red List Categories and Criteria: Version 3.1. Second edition.
Global monitoring of threatened species
The 2019 Intergovernmental Science-Policy Platform on Biodiversity and Ecosystem Services Global Assessment Report on Biodiversity and Ecosystem Services revealed that around one million animal and plant species are threatened with extinction, many within decades.
Figure 1D shows that between 2007 and 2019, the number of species at risk of extinction globally nearly doubled.
The Intergovernmental Science-Policy Platform on Biodiversity and Ecosystem Services is an independent body established in 2012 by 94 governments. Its role is to strengthen the science-policy interface for biodiversity and ecosystem services for the conservation and sustainable use of biodiversity, long-term human wellbeing and sustainable development.
FIGURE 1D: Number of species at risk of extinction globally
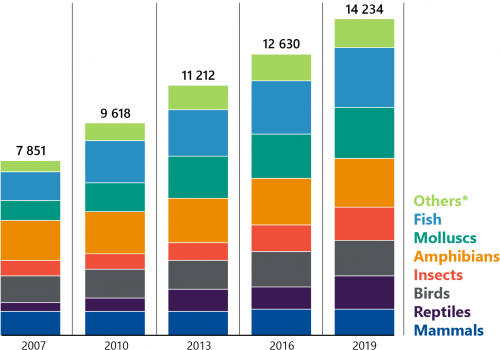
Note: *Other invertebrate (spineless) animals, such as crustaceans, corals and arachnids (spiders, scorpions).
Source: IUCN Red List.
Threatened species in Australia
Australia’s native plants and animals have the highest rate of species extinction of any developed nation in the last 200 years. At least 130 known species, including 60 plant and 50 mammal species, have become extinct.
Australia's list of species threatened with extinction continues to grow. The federal Environment Protection and Biodiversity Conservation Act 1999 lists more than 1 700 plant and animal species and ecological communities known to be at risk of extinction nationally.
Australia's Threatened Species Index 2020 shows that between 1997 and 2017, the risk status increased for 72 per cent of already threatened plant species. This is faster than for mammals, which increased by about a third, and birds, which increased by about half.
A 2019 Commonwealth Scientific and Industrial Research Organisation study quantifying extinction risk estimated that climate change would increase the rate of species losses about five-fold in the next 20 years 'without purposeful intervention'.
Threatened species in Victoria
Victoria has experienced the same extensive species loss over the last 200 years as Australia. Since European settlement, 81 Victorian plant and animal species have become extinct.
The number of species that are threatened continues to increase. At the same time, many of the species already classified as threatened continue to decline in status.
Today, between one quarter and a third of all of Victoria’s terrestrial plants, birds, reptiles, amphibians and mammals, along with numerous invertebrates and ecological communities, are considered to be at threat of extinction. As shown in Figure 1E, this translates to almost 2 000 terrestrial flora and fauna species.
FIGURE 1E: Victoria's threatened species numbers as of June 2021
Note: Number of species extinct is since European settlement. There are 54 extinct species listed on the Threatened List.
Source: VAGO, based on DELWP's most recent Threatened List 2021.
The Commissioner's most recent State of the Environment report in 2018 lists threatened species according to:
- status—an overall analysis of the status assessments for indicators
- trend—expresses whether the status of the indicator is deteriorating, improving or remaining stable
- data quality—analyses whether indicators are supported by ‘good’ data, which means that the status and trend assessments for these indicators are presented with confidence, or whether indicators are assessed as having ‘poor’ data, which may indicate no data at all.
As shown in Figure 1F, the report showed that for most threatened species, these indicators were poor and trending downwards.
FIGURE 1F: Status, trend and data quality of threatened species indicators
| Indicator | Status | Trend | Data quality |
|---|---|---|---|
| Populations and distributions of threatened species | Poor | 🠫 | Poor |
| Vascular plants (have tissues for distributing water and minerals) | Poor | 🠫 | Fair |
| Vertebrates | Poor | 🠫 | Fair |
| Invertebrates | Poor | 🠫 | Fair |
Source: VAGO, based on information from the State of the Environment 2018 report.
1.3 Conservation approaches to protecting biodiversity and threatened species
Over the last decade, there has been a shift in management approaches to halting biodiversity and threatened species declines.
Historically, a focus on individual species and threats specific to that species has not stopped global declines in biodiversity or prevented continued species extinctions. This has prompted a move away from single-species planning and management. Instead, the approach is increasingly to manage broad and pervasive threats to species habitats across larger connected geographical areas (landscapes) that provide benefits to multiple species, in balance with cost-effective bespoke actions to protect prioritised single species.
Victoria’s approach to halting the decline of threatened species
Victoria's legislative and policy framework provide the key tools to protect biodiversity and threatened species.
Legislative framework: The FFG Act
Parliament passed the FFG Act in 1988 to establish a legal and administrative structure to deal with threats to flora and fauna indigenous to Victoria.
The FFG Act's objective is to conserve all of Victoria's native plants and animals. It includes the ‘guarantee’ that all Victoria's flora and fauna can persist and improve in the wild and retain their capacity to adapt to environmental change.
The FFG Act has had a number of amendments. Most recently, the Flora and Fauna Guarantee Amendment Act 2019 took effect on 1 June 2020.
Under these amendments, DELWP is required to:
- use the common assessment method, which is the agreed national method for assessing and listing threatened species, to align Victoria with other jurisdictions
- establish and maintain the Threatened List of flora and fauna species, setting out the extinction risk of each listed species and category of threat that applies to each (this list includes species extinction risk, either in Australia or in Victoria)
- review the Threatened List every five years.
Legislative tools
Requirement for a biodiversity strategy
Under the FFG Act, the secretary of DELWP must publish a biodiversity strategy. The strategy must include:
- proposals to achieve the objectives of the FFG Act
- targets to measure achievement of the objectives
- a framework to monitor and evaluate the implementation of the strategy.
In 2017, DELWP released Biodiversity 2037 to meet this requirement.
Threatened List and the common assessment method
The mandated Threatened List uses the common assessment method to determine the category of threat that applies to a listed species.
This method is based on IUCN's threatened categories and criteria, as shown in Figure 1G.
FIGURE 1G: IUCN threatened categories and criteria
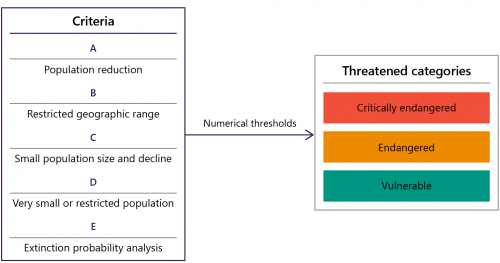
Source: VAGO, based on information from IUCN.
DELWP lists all species that qualify as critically endangered, endangered or vulnerable on the Threatened List.
Other legislative tools and processes
The FFG Act has a range of tools to protect threatened species, including:
- action statements
- flora and fauna management plans
- habitat conservation orders
- public authority management agreements.
With the exception of action statements, the use of these tools is at the discretion of the Minister for Energy, Environment and Climate Change (the Minister).
Action statements
Under the FFG Act, DELWP must prepare an action statement for each threatened species following its listing.
Action statements aim to help secure populations and enable the long-term persistence of a species. An action statement:
- contains information on the species, such as the reasons for its decline and threats that affect it
- reports on past management actions
- establishes a set of new management actions that need to occur to manage and protect the species.
Flora and fauna management plans
Taxon (plural taxa) is a unit of any rank (for example, kingdom, phylum, class, order, family, genus, species) designating an organism or a group of organisms.
Under the FFG Act, the Minister makes guidelines to specify when a management plan must be prepared for a species in addition to an action statement. A management plan is more detailed than an action statement and may include:
- conservation or restoration of any listed community or taxa
- the mitigation of impacts to a listed taxon or community, and how the impacts will be avoided
- management of a potentially threatening process or processes (such as weeds or pests)
- management of a specific area or resource
- conservation, management or restoration of a critical habitat.
Critical habitats are areas determined under the FFG Act that make a significant contribution to the conservation of listed threatened species.
Habitat conservation orders
As part of the 2019 reforms to the FFG Act, habitat conservation orders replaced interim conservation orders.
Habitat conservation orders are made by the Minister to conserve, protect or manage critical habitats. They can prohibit damage to critical habitats or require remediation of previous damage.
Public authority management agreements
The FFG Act contains an obligation or duty of public authorities and ministers to consider potential biodiversity impacts when exercising their functions. DELWP can request that a public authority enter into a management agreement with it to provide certainty that the authority is considering and managing biodiversity impacts in performing any of its functions.
Victoria's Biodiversity 2037 strategy
The government's approach to protecting Victoria's biodiversity and halting threatened species decline over the next 20 years is outlined in its Biodiversity 2037 strategy. This strategy reflects the global change in biodiversity management to prioritise cost-effective actions that address common threats to the greatest number of species. It establishes a statewide target with expected outcomes for Victoria's threatened species.
Focus on benefiting the greatest number of species
Biodiversity 2037 focuses on the planning and management of:
- actions to treat broad-scale common threats across a landscape that provide the greatest benefit to the greatest number of species and a preventative approach to reduce the risk of species becoming more threatened
- bespoke actions to meet the unique needs of individual species.
Broad-scale threat management actions can prevent many vulnerable species from becoming endangered and may provide co-benefits to endangered and near threatened species. As a result, these actions can be highly cost-effective. However, this approach will not benefit all endangered and critically endangered species. These species often require specialised interventions.
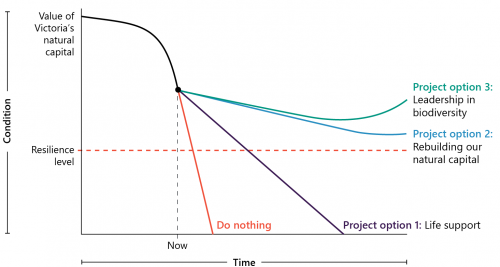
Figure 1H shows this approach, which has meant a rebalancing of effort and investment to benefit the greatest number of species.
FIGURE 1H: Biodiversity 2037 approach to halting threatened species decline
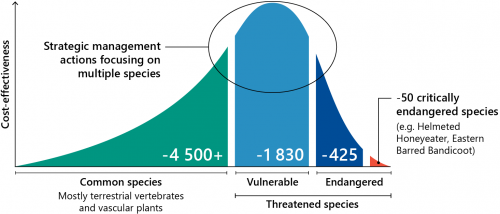
Source: VAGO, based on Biodiversity 2037.
This approach is based on scientific evidence that threats that occur across a landscape, such as invasive pests and animals, pose a common risk to many flora and fauna species. Treating extensive, rather than localised smaller areas is also chosen on the basis that treatments are more likely to maintain intact ecological processes and support more species and larger populations.
As Figure 1I shows, the best management approach for a species depends on its status and the nature of threats.
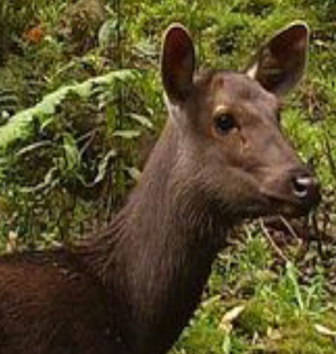
FIGURE 1I: Case study: Wild deer and Baw Baw frog
In Victoria, 1 080 flora and fauna species would benefit from better management of deer.
Deer pose a significant risk to biodiversity, as they reduce and destroy native vegetation and compete with native wildlife for food sources. This is a good example of landscape-based threat management helping many species.
However, critically endangered species are typically at greater risk from narrow and unique localised threats. For example, the wild population of the now critically endangered Baw Baw frog has decreased by 98 per cent since the late 1980s due to chytridiomycosis, a disease caused by a fungus.
 |
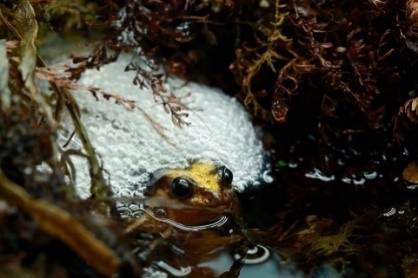 |
Source: VAGO from public DELWP information, including images of a wild deer and Baw Baw frog.
Key initiatives
To achieve Biodiversity 2037's objectives, DELWP prioritised the following key initiatives in the first four years of its implementation:
- delivery and use of decision-support tools to support cost-effective decision making
- increased collection of targeted data to underpin and continually improve evidence-based decision-making
- implementing effective measures to assess the outputs and outcomes of these decisions and actions against Biodiversity 2037 targets.
DELWP is responsible for implementing these actions.
Other government and non-government organisations, including Parks Victoria and Trust for Nature, contribute to delivering Biodiversity 2037 programs and initiatives.
1.4 DELWP's roles and responsibilities
DELWP is the key agency responsible for managing and protecting threatened species in Victoria. It also influences strategic alignment with, and uptake of, Biodiversity 2037's approach, goals and targets by other agencies.
DELWP's role is to:
- administer the FFG Act and support the management of public land that contains significant areas of high biodiversity value, including threatened species
- ensure the list of threatened species, communities and threatening processes is comprehensive and up to date
- undertake planning to ensure appropriate processes are in place to protect threatened species and identify priority actions for threatened species to meet statewide targets
- establish statewide biodiversity targets and KPIs for protecting threatened species
- monitor, evaluate and report progress against the targets and KPIs for threatened species
- coordinate government investment to ensure the delivery of Biodiversity 2037 outcomes and targets
- deliver on-ground management and research projects, including with various partners such as Parks Victoria and Trust for Nature.
DELWP's Victorian Biodiversity Atlas
DELWP's VBA is the primary data repository for threatened species information across Victoria.
The VBA includes a dynamic list of all species found in Victoria and provides information, including their conservation status. It includes more than seven million records of species' distribution and abundance, which DELWP has collated from many different data providers, including:
- government agencies and partner organisations
- non-government organisations, such as BirdLife Australia
- ecological consultancies
- universities
- varied community wildlife survey groups.
DELWP uses VBA data as an input to the majority of its tools that support the protection of threatened species.
DELWP's decision support and modelling tools
To support Biodiversity 2037, DELWP has developed a suite of computer-based decision-support and modelling tools. These are designed to provide information on where actions will have the greatest benefit, or the greatest prospects for change, for particular species.
The tools include processes to determine and compare the benefits of actions across a species, numbers of species, area, or range of areas. These are outlined in Figure 1J and work together to help DELWP determine the most cost-effective actions.
FIGURE 1J: DELWP's key decision-support and modelling tools
| Tool | Description |
|---|---|
|
SMP |
SMP is DELWP’s primary decision-support tool to drive cost-effective management actions to protect Victoria’s threatened species. SMP assists land managers to identify and prioritise the most effective and efficient management actions across the landscape. DELWP uses the SMP tool to map, integrate and compare:
|
|
HDM |
HDM outputs are a key input into SMP decision-support processes. HDMs collect and compare information on where a species has been recorded and relate that data to environmental variables, such as soil, prevailing climate and topography. This data is then used to rank the suitability of areas for threatened species across the state. HDMs use existing observation data from the VBA. |
|
SNA |
SNA is a decision-support tool that prioritises bespoke actions for endangered and critically endangered species that are not catered for by the SMP. DELWP can compare SNA outputs alongside SMP outputs to determine the most cost-effective actions by applying the same analysis as conducted through the SMP. |
|
CSH |
CSH is a predictive measure that standardises how DELWP measures the benefits of on-ground actions to protect threatened species. This enables comparisons across a wide range of species, threats and actions. It is a measure of the increase in likelihood a species will still exist at a location in 50 years when there is sustained management of relevant threats, compared to no management. It is expressed as a percentage increase. Figure 1K illustrates this. |
Source: VAGO.
Figure 1K illustrates how CSH is calculated to measure the probability that a species will still exist in 50 years if threats are managed or not managed over this time.
FIGURE 1K: How CSH is calculated to measure the benefit of on-ground actions to species persistence
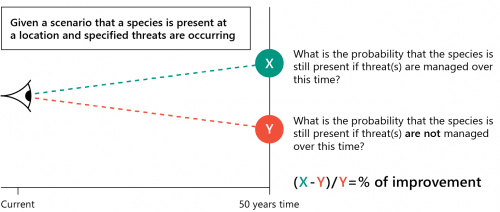
Source: DELWP.
DELWP’s collection of tools to assess and rank the cost-effectiveness of actions will allow it to identify trade-offs and assumptions when deciding or prioritising direct actions for a single species against landscape actions to protect multiple species.
Figure 1L shows how the tools work together to help DELWP determine the most cost-effective action.
DELWP's approach means an action will rank highly if it has relatively large benefits for multiple species, or species that are likely to become threatened in the absence of action.
FIGURE 1L: DELWP's approach to protecting threatened species using models and decision-support tools
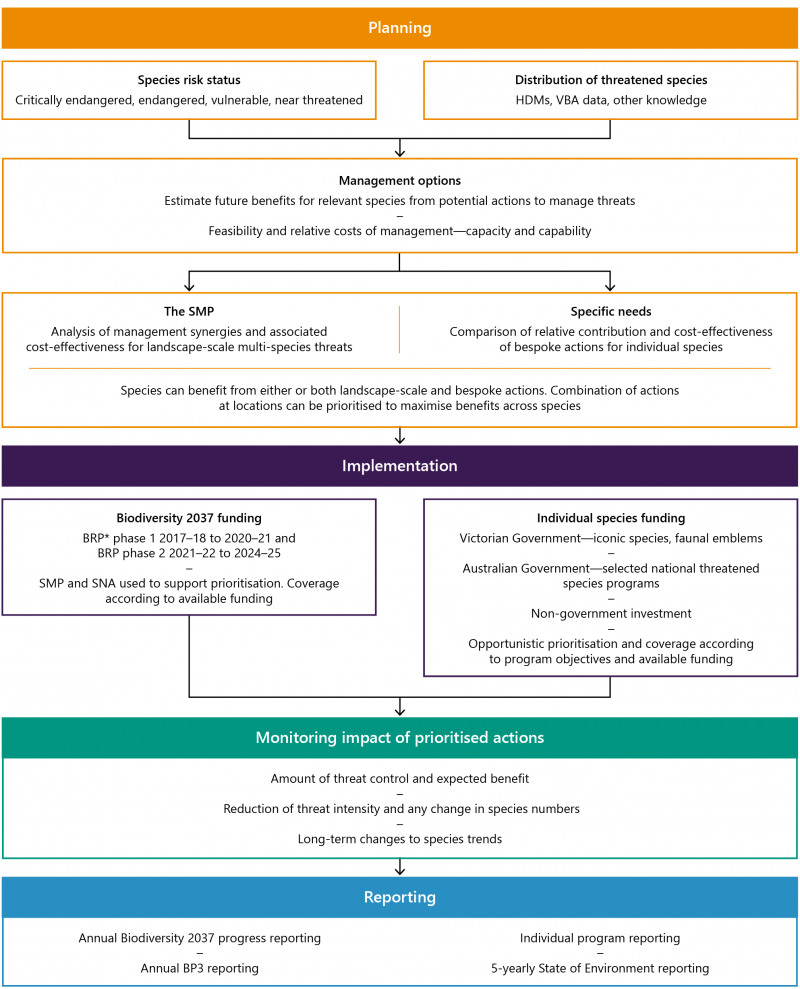
Note: *Biodiversity response planning (BRP) is DELWP’s area-based planning approach to biodiversity conservation.
Source: VAGO, based on DELWP information.
2. Halting threatened species decline
Conclusion
DELWP cannot demonstrate that it is halting the decline of threatened species.
DELWP cannot determine if its prioritised Biodiversity 2037 management interventions have adequately controlled key threats and are halting further threatened species population declines. This is because of flaws in its KPIs and its lack of a targeted monitoring program to assess the on-ground impact of its prioritised management interventions on threatened species populations.
This chapter discusses:
2.1 DELWP’s performance and accountability for halting threatened species decline
Alignment between the FFG Act and Biodiversity 2037
Section 17 of the FFG Act requires the development of a strategy that considers and achieves the Act's objectives and outlines proposals to deliver them. DELWP developed Biodiversity 2037 to fulfill this requirement.
The statewide target and expected outcomes of Biodiversity 2037 for threatened species do not fully align to the FFG Act’s objective to 'guarantee' that:
- all Victoria’s flora and fauna ‘can persist and improve in the wild’
- there will be no increase in the number of threatened species.
In 2016, DELWP commissioned an independent review of the FFG Act to modernise and reform it. The review found that the Act’s objectives were simple and outcome focused, but the objective to ‘guarantee’ all flora and fauna species will persist and improve in the wild was not measurable or achievable. It recommended this be replaced with new objectives to:
- ensure the greatest number of species and communities do not become endangered
- halt the overall decline of threatened species and secure the greatest possible numbers in the wild.
Biodiversity 2037’s statewide target and expected outcomes were developed to align to the 2016 proposed changes to the FFG Act's 'guarantee' objective.
However, key non-government organisations and community submissions did not support the proposed changes. As a result, the government retained the ‘guarantee’ objective in the FFG Act amendments passed in 2019 (see Figure 2A).
FIGURE 2A: Timeline for the FFG Act reform and the release of Biodiversity 2037
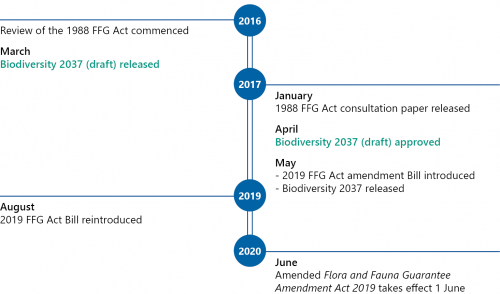
Source: VAGO.
While Biodiversity 2037's statewide target and its expected outcomes contribute to the FFG Act’s ‘guarantee’ objective, their achievement will not mean that all species ‘can persist and improve in the wild’ and no further species will become threatened, as required by the FFG Act, which Figure 2B shows (see also Figure D1, Appendix D).
FIGURE 2B: Gaps between the FFG Act objectives and Biodiversity 2037 outcomes
| FFG Act objectives | Biodiversity 2037 statewide target and expected outcomes for threatened species | Gap |
|---|---|---|
|
To guarantee that all taxa of Victoria's flora and fauna can persist and improve in the wild and retain their capacity to adapt to environmental change. To prevent taxa and communities of flora and fauna from becoming threatened and to recover threatened taxa and communities so their conservation status improves. |
A net improvement in the outlook across all species by 2037 with the expected outcome that no vulnerable or near-threatened species will have become endangered |
A net improvement in the outlook of all species is not a guarantee that all species will be protected. Net takes into account what remains from all after certain deductions are made. DELWP advised us that these deductions include climate change and the lag in impacts from past land use changes. Biodiversity 2037's expected outcomes do not account for the improvement of all threatened species. It does not consider the decline in species risk status from:
|
|
A net improvement in the outlook across all species by 2037 with the expected outcome that all critically endangered and endangered species will have at least one option available for being conserved ex situ or re-established in the wild (where feasible under climate change) should they need it |
Outcomes do not require the implementation of the option. |
|
|
A net improvement in the outlook across all species by 2037 with the expected outcome of a net gain of the overall extent and condition of habitats across terrestrial, waterway and marine environments. |
The act of improving a species habitat is not always a direct cause and effect leading to the improved persistence and outlook of threatened species. |
Source: VAGO.
DELWP advised us that 'Biodiversity 2037 is the Victorian Government policy’ towards which it is working as identified in Figure 2B. DELWP also advised us that ‘guaranteeing all species’ persistence in the wild is an unobtainable goal due to:
- the long-term effects on Victoria’s biodiversity from the impacts of over 200 years of European colonisation
- the inherent uncertainties in complex ecosystems, particularly under climate change
- funding constraints.
This is reasonable but DELWP has not clearly communicated this issue, or the gap between the FFG Act and its strategy, to the government or the public.
2.2 Monitoring and reporting performance to halt threatened species decline
DELWP's threatened species monitoring and reporting is not comprehensive and lacks accountability. There are flaws and gaps in its performance measurement and reporting framework, and a lack of supporting data.
DELWP is required to monitor and report progress against Biodiversity 2037's statewide target of a net improvement in the outlook of all species and its expected outcomes. It does this by assessing performance against its annual and five-yearly KPIs listed in its MERF (see Figure D2, Appendix D).
Monitoring progress against Biodiversity 2037
Effective KPIs are an essential element of an accountable performance monitoring and reporting framework. DELWP use these to measure how effectively its funded and prioritised activity outputs and outcomes are achieving Biodiversity 2037's statewide target and expected outcomes for threatened species.
DELWP does not have an effective set of KPIs to comprehensively and reliably measure the outputs, and the short and longer-term outcomes, as a result of its prioritised and funded activities under Biodiversity 2037. This means that DELWP cannot effectively monitor if Biodiversity 2037 actions are controlling threats, halting threatened species population declines and improving their net outlook.
DELWP's MERF lists over 87 KPIs for biodiversity, of which 15 are directly relevant to threatened species. Figures 2C and 2D list these KPIs. Of these:
- 10 measure activities (outputs), such as number of hectares treated for weeds
- two measure short-term management outcomes from activities
- three measure long-term outcomes from activities.
Biodiversity 2037 KPIs used to measure outputs
DELWP uses 10 KPIs to measure the effectiveness of its prioritised and funded activities (outputs) under Biodiversity 2037. These measures focus on the number or quantity of activities it delivers to control threats to species as shown in Figure 2C. DELWP is required to monitor these KPIs annually as set out in the MERF.
Overall, these KPIs do not measure:
- the quality or cost-effectiveness of these actions
- all its activities to protect threatened species, such as the number of action plans developed for threatened species
- the number or percentage of species that these activities target.
Figure 2C shows the gaps and flaws in DELWP’s Biodiversity 2037 KPIs to measure its outputs.
FIGURE 2C: Specific issues with DELWP's Biodiversity 2037 KPIs to measure outputs
| Purpose | KPIs* | Key issues |
|---|---|---|
|
To measure the success of programs and actions to protect threatened species and improve their outlook |
Individual species protection
|
|
|
Key threats to species are controlled
|
KPIs only measure the area where the activity is applied, not the quality of the control applied according to DELWP's standard operating procedures. |
|
|
Threat management is strategic, consistent and sustained The number of hectares of:
|
|
|
|
Ecosystem functions are progressively restored
|
KPIs measure quantity, not the cost effectiveness or quality of the control. |
Note: *The dot points in this column are the KPIs for Biodiversity 2037.
Source: VAGO, using information from DELWP's 2019 Biodiversity 2037 MERF.
There are no KPIs that assess whether the controls to protect and improve threatened species habitats are applied and maintained to meet DELWP’s delivery and output standards.
For example, DELWP's 2019 Biodiversity 2037 progress report states that it achieved 327 382 hectares of sustained herbivore control and 69 726 hectares of sustained weed control. However, there is no assessment of the quality of these controls or whether they are applied consistently over time.
Biodiversity 2037 KPIs used to measure threatened species outcomes
DELWP employs two KPIs to measure short-term management outcomes to threatened species habitats using its predicted measure—CSH. DELWP is yet to report against these two KPIs.
DELWP also has three KPIs to monitor changes to threatened species' statuses and trends, or long-term outcomes, as a result of Biodiversity 2037 actions. DELWP's MERF sets a requirement for these to be monitored every five years.
These three indicators:
- do not assess all threatened species
- rely on data and information that has significant gaps.
Figure 2D provides examples of issues with these outcome indicators.
FIGURE 2D: Issues with Biodiversity 2037's overall vision and outcome KPIs to protect and manage Victoria’s biodiversity
| Purpose | KPIs | Key issues | Impact |
|---|---|---|---|
|
To improve species habitats, which is used to predict improved species persistence |
Species habits are improved:
|
The KPIs are not reported and are not aligned with changes in on ground species populations. |
The KPIs do not measure:
|
|
To measure individual threatened species status and trends |
Number of vulnerable species or near-threatened species that have become endangered using individual species risk extinction status assessments undertaken every five years. |
The KPI:
|
The KPI does not measure the status change in:
This means that the potential status change of over 50 per cent of endangered and critically endangered species are not reported. |
|
Threatened Species Index |
Indices are only available for a limited number of species. For example, less than 8 per cent of nationally listed threatened plants have an index. There is an equivalent lack of data for other species groups. |
The KPI does not enable the measurement and monitoring of trends for most of Victoria's threatened species. |
|
|
Percentage of critically endangered and endangered species that have an option for being conserved or re-established. |
|
|
Source: VAGO, using information from DELWP's 2019 Biodiversity 2037 MERF.
The Scientific Assessment Committee (SAC) is an independent committee of scientists that advises the Minister on the listing of taxa or communities of flora and fauna and the listing of potentially threatening processes. SAC can also advise the Minister on any other flora and fauna conservation matters.
DELWP's independent Scientific Advisory Committee acknowledged that assessments to determine a species' status can vary in accuracy and reliability due to data gaps and limited expert knowledge for some species. For example, because relevant stakeholders and agencies, including DELWP, monitor fewer than one fifth of vulnerable or near threatened species, assessment relies on expert knowledge of the species, which at times does not exist or is not current.
The Threatened Species Index can provide reliable and rigorous measures of threatened species trends. However, it includes few Victorian plant and animal species due to a lack of data collected by the state, which is a common problem for most states.
Across Australia there are indices for:
- 112 threatened plants of the total 1 400 species listed as threatened nationally
- 57 threatened and near-threatened mammals of the hundreds of species listed nationally
- 43 threatened birds, which represent about 28 per cent of all nationally listed threatened birds.
The index will be a more reliable indicator when higher-quality data becomes available to assess trends for Victoria’s critically endangered and endangered threatened species. This will only occur if the number of functional groups of threatened species subject to long-term monitoring increases.
Currently, fewer than 100 Victorian threatened species have monitoring or survey programs, and these vary in quality, reliability and comparability. This means that the government, non government organisations and the public cannot rely on the index to assess trends for most of Victoria's threatened species.
DELWP's 2021–22 Budget bid did not request funds to increase the number of threatened species monitoring programs over the next four years.
Performance reporting
DELWP’s reporting to the government and the public provides limited:
- ability for its readers to assess whether DELWP is delivering its services to the quality needed to protect threatened species
- ability to scrutinise whether these services are cost-effective
- assurance that DELWP is on track to meet the statewide target and its expected outcomes of Biodiversity 2037 for threatened species.
DELWP's lack of accountability for effectively reporting performance is a similar theme across a number of its portfolio areas, as reported in our recent 2020 Reducing Bushfire Risks and 2021 Measuring and Reporting on Service Delivery audits.
DELWP's obligations to report the state's performance in protecting threatened species are identified in Figure 2E.
FIGURE 2E: DELWP's reporting requirements for threatened species
| Reporting requirement | Purpose |
|---|---|
|
Legislative reporting, including the BP3 and annual performance reports. |
DELWP is accountable to Parliament and the public for what it achieves using public funds. It must accurately report its performance against BP3 performance objective/s, indicators and output measures in annual performance reports to identify what is working and what areas need improvement. |
|
Biodiversity 2037 performance reporting. |
DELWP is required to report annually on its progress in achieving Biodiversity 2037's statewide target and expected outcomes using KPIs identified in the MERF. The Commissioner is required under the FFG Act to report every five years on progress against Biodiversity 2037's goals, targets and outcomes. This will be through State of Environment reports. |
|
Program reporting, including on individual programs and activities to protect threatened species. |
DELWP internally reports on the success of government-funded programs and activities to protect and improve threatened species and their outlooks. Outputs and outcomes of these programs are used to inform its Biodiversity 2037 annual reporting and the Commissioner’s State of the Environment reporting. |
Source: VAGO.
Legislative reporting
DELWP’s BP3 and annual performance reporting does not provide Parliament and the public information on whether it effectively spends public funds to protect Victoria’s biodiversity and its threatened species.
This is because DELWP’s relevant BP3 objective, indicators and measures do not meet the guidelines set out in DTF's updated 2020 RMF, which states that an agency's:
- performance objective/s should be clear, measurable and reportable
- performance indicators should cover all elements of its performance objective/s
- clear and relevant performance measures should cover the quantity, quality, cost and timeliness of its services.
DELWP’s relevant BP3 and annual performance reports do not:
- fully comply with DTF’s RMF
- measure its service efficiency or effectiveness
- present its performance information in a way that enables efficient and effective analysis.
Figure 2F outlines the specific issues with DELWP’s biodiversity performance and reporting framework.
FIGURE 2F: Flaws in DELWP’s BP3 and performance statement reporting framework for biodiversity, including threatened species
| Issue | Explanation |
|---|---|
|
The departmental performance objective relating to Biodiversity (healthy, resilient and biodiverse environment) is difficult to effectively and comprehensively measure and report against. |
DELWP’s objective includes the delivery of effective, evidence-based policies, programs and regulatory responses for:
A number of these elements are difficult to measure, set targets for and report against due to a lack of knowledge and data, particularly in a time of climate change. For example, it is not clear how targets and measures can be determined for ecosystem resilience. |
|
The relevant departmental objective indicators are too narrow to indicate if the objective is being achieved. |
DELWP only has one objective indicator relating to biodiversity—‘participation in community based environmental programs’. This does not address the four key elements of biodiversity outlined in DELWP’s performance objective. |
|
Performance measures do not have the right mix of quality, quantity, timeliness and cost, as required by the RMF, to provide a comprehensive measurement framework. |
All of DELWP’s BP3 performance output measures for biodiversity relate to the quantity (number and size) of activities delivered. They do not address DELWP’s service quality, efficiency or cost-effectiveness. |
Source: VAGO.
Figure 2G uses the RMF to assess DELWP’s performance measures against its overall objective. It identifies the gaps in DELWP’s performance measures to assess service quality, timeliness and cost-effectiveness.
FIGURE 2G: Assessment of how DELWP's output performance measures relate to service quality, timeliness and cost
| Performance objective—Healthy, resilient and biodiverse environment | ||||
| Output performance measure | Quantity | Quality | Timeliness | Cost |
| New permanently protected native vegetation on private land | ✓ | ✗ | ✗ | ✗ |
| Hectares of weed control in priority locations | ✓ | ✗ | ✗ | ✗ |
| Hectares of pest predator control in priority locations | ✓ | ✗ | ✗ | ✗ |
| Hectares of pest herbivore control in priority locations | ✓ | ✗ | ✗ | ✗ |
| Hectares of revegetation in priority locations for habitat connectivity | ✓ | ✗ | ✗ | ✗ |
| Total output cost | ✗ | ✗ | ✗ | ✓ |
Source: VAGO, from information in the BP3 and DELWP's Annual Report 2019–20.
Biodiversity 2037 reporting
DELWP’s annual Biodiversity 2037 progress reporting does not provide the required timely assurance to the government and the public as to whether it is on track to deliver the strategy’s 30-year statewide target of a net improvement in the outlook of all threatened species.
This is because DELWP:
- has not met its annual Biodiversity 2037 reporting obligations in a timely manner
- does not comprehensively report progress using all MERF annual KPIs.
DELWP’s MERF requires it to annually report progress on its website against the strategy's statewide target, expected outcomes and KPIs. DELWP has not met these requirements in a timely or comprehensive manner, as shown in Figure 2H.
FIGURE 2H: DELWP's progress against Biodiversity 2037's reporting requirements
| Requirement | Progress |
|---|---|
|
2018 report against annual KPIs* |
Partially met. DELWP produced a progress report against the priority actions listed in the 2018 Biodiversity 2037 implementation plan. While it reported against all five of the Biodiversity 2037 output KPIs, it did not report whether it met its two annual KPI targets related to management outcomes:
|
|
2019 report against annual KPIs |
Partially met. DELWP reported against four of its 12 annual KPIs relevant to threatened species listed in appendix 3 of the MERF. It did not report against its two KPIs relating to CSH, as identified above. |
|
2020 report against annual KPIs |
Not met. DELWP has not published its 2020 report. DELWP advised us that this will be released shortly. |
Note: *KPIs for Biodiversity 2037 were only finalised in 2019 as part of the MERF. In the interim, DELWP developed the Biodiversity 2037 implementation plan in 2018, which required annual reporting against the CSH targets.
Source: VAGO, based on information provided by DELWP.
Five-year reporting of progress
Under the FFG Act, the Commissioner is responsible for reporting progress against Biodiversity 2037 every five years. This includes reporting threatened species’ trends and statuses. The first report is due in 2023.
The Commissioner relies on DELWP’s data and analysis and therefore may not be able to report on the progress of Biodiversity 2037.
|
To report effectively, the Commissioner requires … |
However … |
|
comprehensive biodiversity and threatened species data. |
collection and collation of data for threatened species reporting continues to be ad hoc and fragmented across the sector as:
|
|
data on outcomes. |
|
|
data on the status and trends of threatened species. |
there are issues with the three Biodiversity KPIs used to report species status and trends, as shown in Figure 2D. |
Data underpinning performance monitoring and reporting
Our 2009 audit Administration of the Flora and Fauna Guarantee Act 1988 identified data quality and collation issues. These remain unresolved and continue to impact the comprehensiveness and effectiveness of DELWP's monitoring and reporting to the government and the public on the success of activities to halt declines in threatened species populations.
Since 2008, the Commissioner’s State of the Environment reports have identified the state’s inability to collate information and comprehensively report on the state of Victoria’s biodiversity and threatened species. The 2018 report indicated that only 12 per cent of government organisations who manage biodiversity assets contributed data to DELWP’s reporting between 2013 and 2018.
Since 2019, DELWP has implemented a range of measures to improve its oversight, governance and reporting of its on-ground Biodiversity 2037 programs that fund over 87 projects and target multiple threatened species. It has worked to develop:
- funding agreements and standard reporting protocols outlining the KPIs to be reported against and the standards to achieve quality activity and reporting outputs. However, most are still in draft and not yet implemented.
- web-based reporting databases to collect information, including:
- a project management system used to record plant and animal management projects and activities
- a mapping application that records common biodiversity management actions.
In 2019, DELWP also began a process with a range of sector bodies, academic institutions and experts to improve collaborative data collection, collation, analysis and biodiversity reporting. It identified barriers to achieving this, such as:
- inadequate, uncertain and short-term funding for the sector
- increased reliance on non-government organisations and private landholders to collect data, which can impact data quality and reliability
- competition for similar funding among environment sector groups
- difficulty in monitoring across the whole state due to the costs, lack of resources and poor coordination across all environment sector groups
- fragmented reporting of data collected, uncollated data, and data of varying quality.
Targeted monitoring and data to assess species' response to management interventions
DELWP has been aware of limitations in its capacity to monitor and report biodiversity conservation outcomes since the first Victorian State of the Environment report in 2008.
DELWP is yet to design, cost and implement a targeted monitoring program to:
- collect data to underpin the development of, and measurement against, its KPIs
- measure and assess threatened species outcomes as a result of the cumulative impacts of its prioritised and funded Biodiversity 2037 management interventions
- identify threatened species trends and changes in status.
This is a critical gap in DELWP's performance and accountability framework. The Commissioner’s State of the Environment reports have consistently highlighted this issue. In 2018, the Commissioner made recommendations to focus on improving the evidence base to deliver key biodiversity policy and legislative actions and targets.
All biodiversity conservation monitoring and reporting programs, including those for threatened species, must evaluate whether the species, habitat or threat responds to management as expected.
Ecologists argue that demonstrating and reporting the effectiveness of management interventions may be best achieved by collecting a combination of targeted and long term data.
A spectrum of monitoring and reporting options and combinations allow an agency to answer and report whether the species, habitat or threat responds to management as expected. These include:
- the amount of threat management and expected benefit, including its alignment to, and coverage of, priorities
- the demonstrated reduction of threat intensity and any change in threatened species numbers
- monitoring and reporting underlying trends and understanding the particular contribution of interventions.
DELWP does not have a targeted monitoring program and indicators to determine whether its prioritised management interventions are resulting in the predicted response in threatened species populations. DELWP, under Biodiversity 2037, monitors and reports the amount of threat management, but it does not monitor against predicted benefits. DELWP is yet to develop a set of reliable indicators to monitor and report species trends and the cumulative impacts of its interventions on halting species declines.
The NSW Government, in conjunction with the University of Queensland and the Australian Government, funded the Threatened Species Recovery Hub and published Guidelines for estimating and evaluating species' response to management in 2020 to estimate and evaluate species’ response to management interventions under NSW's Saving Our Species program. These guidelines support the monitoring and evaluation framework developed for the program.
Common indicator species represent a functional group or community of species that can be used to measure on-ground changes to that group or community as a result of management interventions.
DELWP has not developed or documented a similar set of guidelines to assess the impacts of its prioritised management interventions or criteria for common indicator species to guide its targeted or long-term monitoring of threatened species status and trends as a result of management interventions.
DELWP-funded programs focus on implementing on-ground actions to protect threatened species, rather than monitoring and reporting their outcomes.
This is mainly a result of funding constraints and a lack of prioritisation of funds for monitoring. Monitoring and reporting underlying trends and understanding the particular contribution of interventions is challenging due to the complexity and dynamics of ecosystems and other environmental influences. This is slow and expensive work, meaning that the cost of confidently explaining how much difference a project is making to persistence of a species may be comparable to the investment in actual management of the threats. As a result, striking the right balance is essential. For example, DELWP’s $6 million Threatened Species Initiative prioritised just 1.8 per cent of the program’s total budget ($108 000) to monitor species' responses.
DELWP's 2019 evaluation of the program reported that it could not assess on-ground outcomes due to the focus on delivering and reporting outputs, rather than outcomes.
DELWP cannot reliably assure government and the public about the cost effectiveness of its programs to control threats and recover threatened species without an adequate targeted monitoring program and associated funding. The Commissioner has consistently identified this problem since 2008 through State of the Environment reports.
Common indicator species to monitor the impact of management interventions
DELWP does not effectively use common indicator species designed to detect changes in functional groups of threatened species as a result of targeted interventions or the cumulative long-term impact of its prioritised management interventions.
Research has highlighted that monitoring the impact of on-ground interventions on all individual threatened species and groups targeted by management interventions is not cost-effective or often warranted.
DELWP regions use 27 different indicator species, monitored using different methods, to assess the impact of management interventions on threatened species' populations. This means it cannot compare data across regions for similar species.
In 2019, DELWP began to develop a suite of common biodiversity indicators, including ones for threatened species. DELWP was due to finalise the project in 2021, but it has extended the timeline to March 2022 due to a lack of resources.
Once DELWP identifies a suite of indicators, it will need to establish baselines for these indicators to measure changes as a result of management interventions. To do this, DELWP will need to determine the available baseline data for each indicator, address the gaps in data for each indicator species, and resource the collection of this data. This is likely to take several years to complete.
DELWP's delay in delivering a common set of indicators and baselines means it will not meet:
- the Commissioner’s State of the Environment 2018 recommendation to develop a unified set of indicators to inform management and reporting within DELWP prior to the publication of the 2023 State of the Environment report.
- the need to provide comprehensive data to the Commissioner for their five-yearly public report on the progress of Biodiversity 2037 in achieving its outcomes and outcome targets, as told through the 2023 State of the Environment report.
3. DELWP's approach to halt the decline of threatened species
Conclusion
DELWP’s limited use of legislative tools means that the inclusion of a species on the FFG Act Threatened List does not guarantee its protection. DELWP has better-practice tools to support its decision making to protect threatened species. However, gaps in data underpinning these tools limits confidence in their outputs.
DELWP lacks a transparent process to prioritise critically endangered species for protection. This is a critical gap in DELWP's approach to prevent further species extinctions.
DELWP has not provided detailed advice to the government about the cost of protecting threatened species. DELWP’s short term funding is not adequate to halt the decline in threatened species.
This chapter discusses:
3.1 Legislative tools to halt threatened species decline
Legislative tools under the FFG Act provide DELWP with a range of management interventions to protect threatened species and their habitats. However, DELWP continues to underuse these tools. As a result, listing a species on the FFG Act Threatened List does not guarantee its protection or drive its conservation.
Figure 3A shows that DELWP has made little progress in addressing the issues and recommendations identified in our 2009 audit Administration of the Flora and Fauna Guarantee Act 1988.
FIGURE 3A: Issues with DELWP's use of the FFG Act tools to protect threatened species
| Tool | Implementation | Details |
|---|---|---|
| Action statements | Not developed per FFG Act | DELWP has not kept pace with species listings. Figure 3B shows that only 20 per cent of listed species are covered by an action statement and a significant percentage of these statements are over 10 years old. This has inhibited their use and hindered effective conservation efforts. |
| Critical habitat determinations | Used once | These identify habitat that is critical to the survival of any species and are one of the few tools in the FFG Act that can lead to the legal protection of threatened species' habitats. A critical habitat has only been declared once, in 1996. |
| Flora and fauna management plans | Never used | Under the FFG Act, DELWP can develop a management plan in accordance with guidelines that outline when it is needed. DELWP has not developed these guidelines and has not used management plans to conserve threatened species. |
| Habitat conservation orders | Never used | As part of the FFG Act reforms, habitat conservation orders replaced interim conservation orders, providing for more long-term arrangements to protect threatened species' habitats. DELWP has never used any orders. |
| Public authority management agreements | Not used since 2009 | These have not been widely used. DELWP has made none since our 2009 audit. Previous reviews found that their usefulness is limited by a lack of understanding of their role and DELWP's limited ability to enforce them. DELWP identified in 2018 that it required guidelines to increase the use of this tool but is yet to develop these. |
Note: Issues with legislative tools were identified through past DELWP reviews and were part of DELWP’s 2017 Review of the Flora and Fauna Guarantee Act 1988 Consultation Paper and its submission and response summary.
Source: VAGO, based on DELWP data.
Action statements
DELWP is not complying with the legislative obligation to prepare action statements for all listed species in a timely manner. Its use of action statements is therefore not driving the protection of threatened species, as intended by the FFG Act.
Action statements must outline steps to conserve and manage a threatened species or group of similar species and help secure their long-term persistence. However, there is no legislative requirement to implement, monitor and report against them.
In our 2009 audit we reported that only 42 per cent of listed species, communities or potentially threatening processes had an approved action statement. This backlog of action statements has only worsened due to the increased number of listed species following the 2019 amendments to the FFG Act. The number of listed species increased from 650 in January 2021 to 1 991 as at June 2021. However, only 20 per cent of listed species, excluding communities and potentially threatening processes, are covered by an action statement, as Figure 3B shows.
FIGURE 3B: Species covered by an action statement compared to species on the FFG Act Threatened List
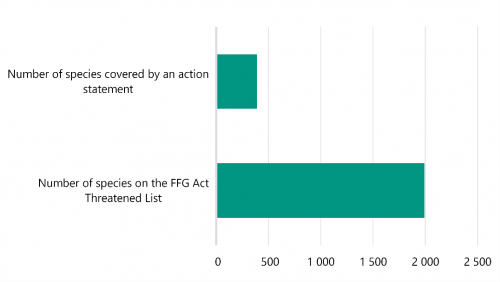
Note: Threatened List current as of June 2021.
Source: VAGO, based on DELWP information.
While action statements do not formally expire, approximately 93 per cent have been in place for more than 10 years, and 34 per cent for more than 20 years. This means that:
- there is a higher risk that completed action statements no longer reflect the current and emerging threats to species persistence
- DELWP may miss opportunities to protect these species and their status could continue to decline.
DELWP acknowledges that it does not have the resources to complete comprehensive up-to-date action statements for all species in a timely manner, as required by the FFG Act. Moreover, it has not prioritised the completion of statements based on assessment of species risk status and prospects of recovery.
DELWP sought government funding in 2021 to develop a process to streamline the preparation of action statements so they take less resources and time to develop. DELWP advised us that while it did not obtain this requested funding, its plan to streamline the development of action statements will proceed in 2021–22. Starting in 2022, DELWP also advised us that it will publish an annual list of species for which action statements and management plans will be prepared that year.
3.2 Decision-support tools to prioritise actions
DELWP has developed a set of tools to support cost-effective decision-making for its landscape-scale approach. Together, these tools model the predicted distribution of threatened species, spatially predict the benefits of threat reduction for many species and allow the comparison and ranking of actions within and between locations.
Figure 1J describes these tools and their purpose. DELWP continues to review and refine these tools.
HDMs and the SMP
DELWP engaged scientific experts to peer review the design of its modelling and decision support tools, known as HDMs and the SMP. These reviews confirm that the purpose and design of these tools are consistent with better practice in conservation ecology.
|
DELWP's … |
This review identified … |
This means … |
|
SMP was reviewed by experts and the review was published in the journal Biological Conservation in 2020. |
that the SMP was the first example of a tool for prioritising multiple management actions at both broad and fine scales. |
that the SMP quantitatively identifies what actions will cost-effectively benefit biodiversity in specific locations, unlike other tools that operate only at larger scale spatial regions. |
|
HDMs were reviewed by ecology and modelling experts from the University of Melbourne in 2015. |
the data preparation, modelling and model evaluation work is of an exceptionally high standard and represents best practice. |
DELWP has developed a world-class system of data management, modelling and model evaluation that should provide sound evidence for regulatory decisions. |
However, the reviews also identified issues with the datasets that underpin and inform the tools’ outputs. Both University of Melbourne experts and our audit identified that the VBA dataset, used as one of the key inputs to generate the tool's outputs, has significant gaps relating to:
- the lack of data for approximately 80 per cent of individual threatened species (however, one species can be representative of a number of species, so this figure maybe lower)
- the age of the data for many species
- biases associated with data collection methods and observations, such as easily observed and known species over unknown or less easily identified species.
The quality and comprehensiveness of the tools’ inputs impact the reliability of DELWP's decision-making processes. While DELWP encourages the use of other information sources to supplement the tool, it does not validate outputs systematically.
No ecological modelling process can consistently deliver accurate outputs due to the complex range of factors and their relationship dynamics in ecological systems. This highlights the importance of validating the modelled outputs.
DELWP's modelling must be supported by a systematic validation process, such as monitoring on-ground changes to threatened species. This does not occur.
SMP inputs
SMP inputs have the following limitations:
- DELWP has not developed HDMs determining listed species presence and location for all species. For those that have been developed (1 420 out of 1 991), the VBA data used to inform them has gaps and biases.
- the SMP is limited to two of the four categories of threats—pervasive threats, such as climate change, and broad threats, such as weed invasion. It does not include narrow and unique threats, such as loss of tree hollows and inbreeding depression. The tool is also yet to include threats to freshwater and marine species.
- Information and knowledge gaps around the cumulative impact and interplay between species, threats and habitats mean the outputs can be limited in scope, impacting the accuracy of predicted benefits and prioritisation of actions.
Without the support of on-ground data validation, these limitations raise questions about the accuracy of information supporting decisions to prioritise and fund actions.
DELWP uses an expert elicitation protocol to collect expert knowledge to identify the responses of threatened species to different scenarios. DELWP uses the scientifically published (Hemming, 2018) Investigate, Discuss, Estimate and Aggregate protocol, which provides a structured, consistent process to collect expert knowledge.
To address gaps in critical on-ground data, DELWP uses expert elicitation to assess the responses of threatened species to different management actions and scenarios. This is extrapolated across the range of relevant species HDMs. This works well as an additional input to DELWP's tools, where experts are available.
DELWP's biodiversity planning has highlighted gaps in expert knowledge around some lesser-known species, particularly in relation to threatened plants.
Addressing critical knowledge gaps
Ecologists agree it is not possible to fill all knowledge gaps on species' habitat distributions and the responses of threatened species to different management scenarios. Therefore, it is not practical or required that DELWP addresses all knowledge gaps, only those determined critical.
In collaboration with experts, academic institutions and responsible agencies, DELWP led the development of the Biodiversity Knowledge Framework in 2019 and Knowledge Portal in 2020. The Biodiversity Knowledge Framework outlines a transparent process to identify and prioritise critical gaps in knowledge that must be filled to improve the reliability and comprehensiveness of tool inputs and therefore, the accuracy of their outputs. The portal is the key public interface tool for natural resource management organisations, research institutes and investors to access information on the critical priority knowledge gaps.
DELWP intends that the portal will encourage coordinated and increased external investment and research to address knowledge and data gaps. DELWP has recently drawn on the portal to identify its own research investment priorities, with three active research projects underway. Though it has had inquiries from other organisations since 2020, the portal is yet to drive external projects to fill identified gaps in the Biodiversity Knowledge Framework.
While the Biodiversity Knowledge Framework is DELWP's key approach to prioritise and encourage investment in new knowledge and data, it is also working on other ways to improve its data collection and collation. This includes an association with the University of Melbourne to develop the Environmental Evidence Based Policy Centre. DELWP intends this Centre, once running, to be responsible for improving the collection, collation and analysis of biodiversity data, including threatened species, and for developing evidence-based policy. DELWP has a joint agreement with the University of Melbourne to develop options for the operation of the centre and is finalising a request for quotes on options to finance the centre.
We anticipate these initiatives will significantly improve collaboration across key players with a role in protecting threatened species and, with appropriate investment, fill critical gaps in data and knowledge.
DELWP's decision-support tool outputs and its CSH predictions will continuously improve in accuracy when this knowledge becomes available.
DELWP's review of its decision-support tools
Tools designed to support decision-making must be regularly reviewed to ensure their quality, relevance and accuracy.
In 2015, DELWP contracted external ecological experts, who reviewed the principles and design of these decision-support tools and assessed them to be better practice. DELWP, in its Biodiversity 2037 business case, outlined a schedule of regular tool reviews from 2018–2021. DELWP identified that these reviews were subject to adequate funding and resourcing, but it did not specify the cost for each review.
DELWP received $86.3 million to implement Biodiversity 2037, less than half of what it requested. DELWP said that this funding shortfall has delayed its implementation of the scheduled reviews, including updating the data in the SMP tool to assess a wider range of threats and species interactions. DELWP indicated it will soon release its third iteration of the SMP, initially due in 2019.
DELWP has not actively collected new data to inform its update and reviews of HDMs. In 2020, however, it updated its HDMs using expert knowledge and feedback. This resulted in further expert elicitation and knowledge for DELWP to better understand the responses of species to different management actions, threats and scenarios for use in the SMP.
We consider DELWP's process to collate expert knowledge for the purpose of updating HDMs to be thorough and beneficial in the absence of comprehensive on ground data.
However, a comprehensive update of the tools to improve the accuracy of decision support outputs relies on the collection and use of on-ground species data. This has only occurred in an ad hoc manner to date.
Figure 3C provides an example of where out-of-date inputs from HDMs increased the potential loss of threatened species.
FIGURE 3C: Friends of Leadbeater's Possum Inc v VicForests
In 2020, the High Court of Australia found that VicForests relied on DELWP’s inaccurate habitat maps to identify that the habitat of two threatened species—the greater glider and the Leadbeater’s possum—were not present in coupes proposed for logging.
DELWP used these maps to inform its HDMs for forest threatened species. This led to the coupes being logged, which impacted species numbers and distribution.
DELWP reimbursed VicForests’ foregone income because of not being able to log in the previously approved coupes during 2018 and 2019 ($6.62 million each year) while this case was being heard.
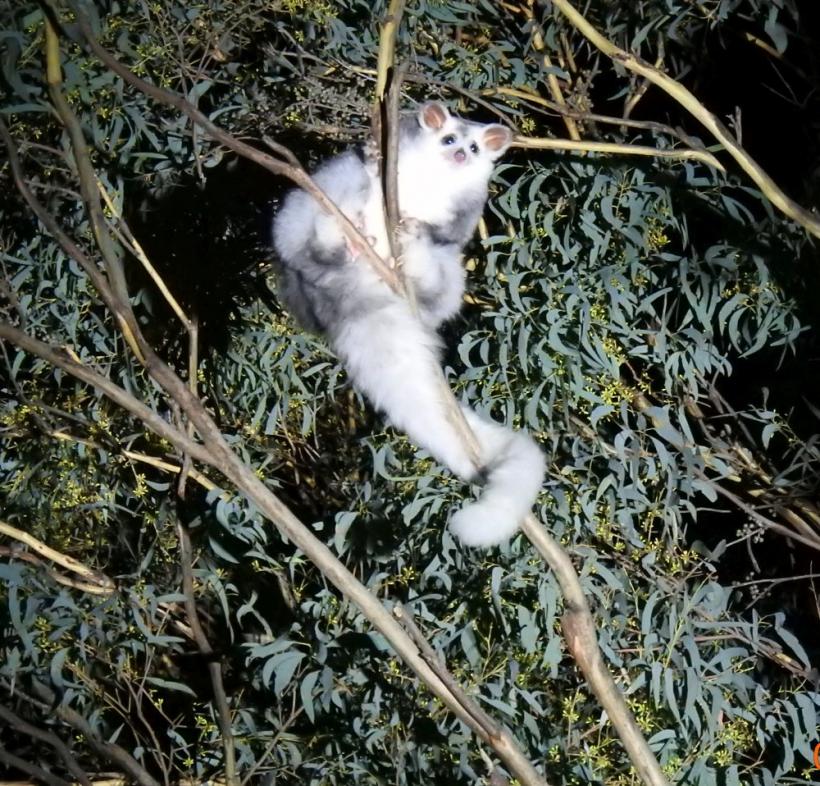
Source: VAGO, from publicly available information. Photo of greater glider publicly available from DELWP.
This case resulted in the government providing DELWP additional funding—$4.7 million annually—to collect current and comprehensive data for prioritised threatened species in logging areas and use this to update its HDMs for species in these areas. This helped DELWP to improve its species distribution and observation data for threatened species in logging areas through annual surveys of planned logging coupes. DELWP was only able to prioritise this due to the additional government funding provided above its four-year Budget allocation for biodiversity.
DELWP more recently updated several species' HDMs in areas impacted by the 2019–20 bushfires, again due to additional government funding for threatened species protection in these areas.
3.3 Preventing species extinctions
DELWP does not have a systematic and transparent process to coordinate the prioritisation of protection for critically endangered species at extreme risk of extinction. This is required as current funding constraints do not allow all species with unique needs to have individual bespoke management interventions or a recovery program. We have identified this as a critical gap in DELWP's approach to preventing further species extinctions.
There are 556 critically endangered species listed under the FFG Act. As acknowledged by DELWP’s own assessment in its Biodiversity 2037 business case (see Section 3.4), current funding levels are not enough to protect all these species through individual programs and bespoke management interventions. These species will not all be protected by DELWP’s prioritised actions to control common landscape threats.
DELWP does not transparently document which of these 556 species require individual management intervention. In addition, it is not clear how many of these species can be adequately protected under current funding arrangements.
DELWP’s current processes for choosing which species to prioritise and fund for recovery or protection lack:
- transparency—decisions are neither clearly documented nor communicated to all stakeholders and the community
- objectivity—decisions and priorities are not based on the consistent application of an evidence-based approach. Rather, they are based on a disparate, changing set of criteria and decision-making factors, including political and social influences or responding to a catastrophic threat
- scientific rigour—the collection, analysis and use of data around its current species choices is not rigorous and decisions to prioritise and continue funding are not based on the best-available evidence
- cost-effectiveness—investment decisions are not based on maximising expected return in terms of outcomes relative to cost.
In contrast, the NSW and Australian governments have implemented transparent and consistent processes and frameworks to prioritise critically endangered species for funding and protection through bespoke management intervention. This is in addition to, and complements, their landscape scale work to address more common threats and support species at lower risk of extinction.
The NSW and Australian governments have separate threatened species frameworks that transparently identify a set of criteria to prioritise critically endangered species for targeted protection, funding and reporting. Both develop prioritised plans for these species, cost their recovery and seek dedicated funding to achieve this. They separately report against these frameworks.
Recent reporting by these governments provides evidence that most prioritised species are being conserved and a number successfully re-established in the wild, as Figure 3D shows.
FIGURE 3D: NSW's threatened species approach
NSW’s Saving our Species program has strategies to protect and prioritise both high-risk endangered and landscape species.
NSW's Saving Our Species 2016–21 program prioritises iconic, site managed and landscape-managed species. It identifies a set of transparent risk-based criteria that it uses to prioritise high-risk endangered species for protection. The NSW Government provided $20 million to fund this program over four years. This is in addition to other funding it provides to implement its landscape scale programs to protect other threatened species not at the same level of extinction risk.
The Saving our Species program has its own monitoring, evaluation and reporting framework. External experts reviewed the NSW approach in 2021 and identified it as a better-practice approach with the funds available.
Source: VAGO, VAGO, based on information from NSW's Saving our Species Year in Review 2019–20.
DELWP funds two individual species-specific programs to protect and recover 10 vulnerable, endangered and critically endangered species (out of 556 listed critically endangered species):
- 2017–18 to 2020–21 Icon Species program—10 species, with six critically endangered, three endangered and one vulnerable
- 2018–19 to 2019–20 Faunal Emblems program—two critically endangered species (these two species are also part of DELWP’s Icon Species program).
DELWP advised us it made supplementary investment in 2020–21 to target a further nine individual threatened species.
Scientific papers and the State of the Environment 2018 report show that a number of these species have not improved in status or outlook over the last 10 years. Examples include the Leadbeater’s possum, Baw Baw frog and the Spotted Tree frog. This is despite some of these species being subject to government funding for over 20 years, as in the case of the Leadbeater’s possum.
Prioritising actions for critically endangered threatened species
DELWP's decision-support tools to prioritise landscape threat management actions to benefit the greatest number of species are mature and are fully integrated into DELWP's approach to manage threatened species.
DELWP's decision-support tool to prioritise actions for individual species, SNA, is not catered for by its SMP tool and is not yet fully mature or integrated into DELWP’s overall approach. DELWP has completed SNAs for only nine per cent (49 of 556) of critically endangered species. This impacts the protection of critically endangered species with specific needs, as DELWP does not have a systematic approach for completing SNAs.
Where additional funding becomes available, DELWP generally prioritises SNAs for species when a need is identified through a critical event or special interest group. For example, after the 2019–20 bushfires, DELWP completed SNAs for 48 species across 12 taxa.
DELWP identified these 48 species for SNAs through desktop assessments and on ground surveys of fire-impacted areas. It used this information to prioritise critically endangered and endangered species for recovery, monitoring or further assessment across fire-affected areas. The species were deemed to be at highest risk of extinction due to their drastic decline in numbers or distribution as a result of the fires.
DELWP does not use this approach to prioritise SNAs for species outside fire-affected areas.
3.4 Cost of protecting threatened species to meet Biodiversity 2037 outcomes
DELWP has not comprehensively costed what funding is needed to halt threatened species decline. It also has not provided advice to the government on the funding required to implement a targeted monitoring program to determine if its approach under Biodiversity 2037 is on track. It does not know what the sector spends to protect threatened species across the state.
Threatened species protection and recovery requires sustained and adequate long term funding. To date, however, DELWP’s funding is generally short-term, allocated based on shifting priorities and not adequate to meet current needs.
DELWP's advice to the government
DELWP's advice to the government in its Biodiversity 2037 business case on the required funding to meet the strategy’s targets and expected outcomes was not comprehensive or fully evidence-based. However, it did identify the impacts to its threatened species programs based on three funding options.
In its business case, DELWP recommended the government provide $196.4 million in funding to implement Biodiversity 2037 between 2017 to 2021, and then $58 million annually until 2037. This is shown as option 2 in Figure 3E.
FIGURE 3E: Project funding options in DELWP's Biodiversity 2037 business case
| Project option | Funding over four years | Advice provided |
|---|---|---|
|
1: Life support |
$86.43 million |
'This option will maintain the basic elements of a biodiversity program for Victoria. Some existing initiatives would continue but this option will not implement the actions nor achieve the targets proposed in Biodiversity 2037. This option will not protect, and halt further decline in the 10 critically endangered species DELWP has prioritised for protection.' |
|
2: Rebuilding our natural capital |
$196.4 million |
'This option will maintain currently funded initiatives, add key targeted new initiatives and deliver the implementation of actions and targets proposed in Biodiversity 2037 over the planned 20-year timeframe. All initiatives in this option are considered core and critical to halt the decline in biodiversity in Victoria. This option will halt further decline in the 10 critically endangered species DELWP has prioritised for protection.' |
|
3: Leadership in biodiversity |
$268.9 million |
'This option will maintain currently funded initiatives and provide for enhanced and accelerated implementation of Biodiversity 2037. This option will halt further decline in the 10 critically endangered species DELWP has prioritised for protection. This option has the potential to not only halt the overall decline of Victoria’s biodiversity, but to reverse the decline for a range of species.' |
Source: VAGO, from DELWP's Biodiversity 2037 business case.
The government provided $86.3 million (option 1) for the first four years of Biodiversity 2037. The current targeted government investment after 2021 is projected to be $20 million per year. This leaves a shortfall of approximately $110 million over the first four years and $38 million ongoing annually.
In its business case, DELWP advised the government that option 1 is likely to result in:
- the continued decline of biodiversity across Victoria, which is forecast to increase with the compounding impacts of climate change
- the state’s inability to preserve its 10 endangered icon species
- the likelihood of many more vulnerable species becoming endangered
- increased competition between government and non-government agencies for less funding
- continued limited information to support evidence-based decision-making.
DELWP's advice to the government only addressed funding requirements and impacts to 10 vulnerable, endangered, and critically endangered icon species, when at the time, DELWP had over 600 species listed as endangered or critically endangered.
As of June 2021, this list has increased to 1 991 species, 1 627 of which are endangered or critically endangered.
DELWP's advice on costings was not comprehensive because it was not supported by:
- a detailed analysis of the status of Victoria’s threatened species
- a collation of funding required as identified by species’ action statements, management plans and species recovery efforts
- analysis of the extent to which investment had led to the recovery of species.
The advice also did not include costing for a long-term monitoring program to assess the effectiveness of Biodiversity 2037.
Since 2017, DELWP has not provided any further advice to the government through its Budget bids about the impacts of the funding shortfalls to date, or the increased need for more investment due to the increased number of listed endangered and critically endangered species.
DELWP's on-ground biodiversity program expenditure and its prioritisation to protect threatened species
Most of DELWP's on-ground biodiversity program expenditure is aimed at addressing common landscape scale threats that impact the greatest number of species.
DELWP spent approximately $149.7 million on on-ground biodiversity programs between 2017–18 to 2019–20 to protect Victoria's threatened species based on figures it provided to us. This comprised $129.5 million for programs to address common landscape scale threats and $20.2 million to implement bespoke management interventions for nine endangered or critically endangered species and one vulnerable species. This is shown in Figure 3F.
FIGURE 3F: Expenditure on biodiversity landscape programs versus species-specific programs between 2017–18 to 2019–20
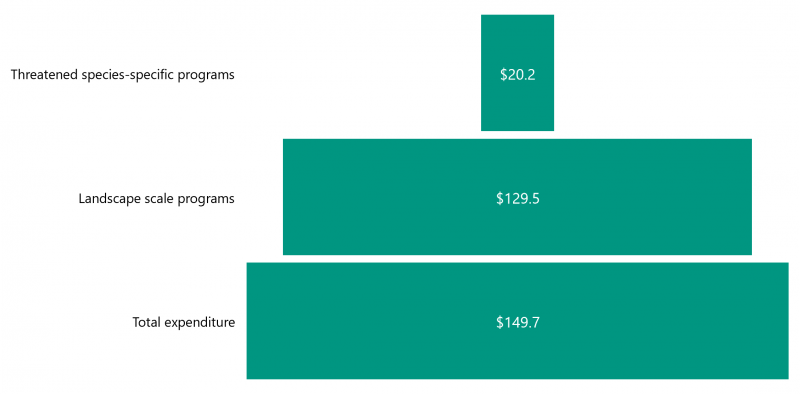
Source: VAGO, based on figures provided by DELWP for on-ground biodiversity programs and individual species management programs.
DELWP determined prioritisation of funding in 2017 based on approximately 1 830 vulnerable species and 50 critically endangered species (see Figure 1H). As of June 2021 there are 1 071 endangered, 556 critically endangered and 303 vulnerable listed threatened species (see Figure 1E).
DELWP identifies in Biodiversity 2037 that its on-ground biodiversity landscape scale programs mostly target vulnerable threatened species (see Figure 1H). DELWP advised us that these programs should also have flow-on benefits for endangered and critically endangered species. It predicts these programs should protect at least 80 per cent of threatened species. However, DELWP did not transparently identify which endangered and critically endangered species were expected to benefit or do benefit from its 2017–18 to 2020–21 prioritised Biodiversity 2037 landscape programs, even though it can predict this through its SMP and HDM tools. It also does not have targeted on-ground monitoring or data to validate these predictions.
DELWP is also yet to identify which of the 2020-listed 1 627 endangered and critically endangered species will benefit from flow-on effects as a result of DELWP’s prioritised 2021–22 to 2024–25 on-ground Biodiversity 2037 funded landscape scale programs.
Current investment in protecting threatened species
Total investment expended to protect threatened species across the state is not known, so it is difficult to determine the shortfall in what funding is needed to meet Biodiversity 2037’s statewide target and expected outcomes.
Threatened species programs and spending are fragmented across a range of government and non-government agencies, the Australian Government, academic research institutions and citizen science groups with no central coordination.
We attempted to calculate the approximate total expenditure of a range of key bodies responsible for, and funded to, protect threatened species across the state. This calculation only includes expenditure for actions that directly protect, recover or monitor threatened species across the state either through on-ground biodiversity programs targeted at common landscape scale threats or bespoke actions targeted at specific threatened species. This includes data provided by DELWP, Parks Victoria, Trust for Nature and publicly available data on catchment management authorities and Zoos Victoria’s expenditure on threatened species, as Figure 3G shows. These programs covered 125 threatened species (including some groups rather than individual species) across Victoria over 2018–19 to 2019–20.
FIGURE 3G: Estimated direct expenditure on threatened species through landscape scale and bespoke interventions in 2018–19 to 2019–20
| Agency | Land tenure | 2018–19 ($ million) | 2019–20 ($ million) |
|---|---|---|---|
| DELWP(1) | State forests (3.2 million hectares, or 40 per cent, of Crown land) | $4.57 | 4.57 |
| DELWP(1) | Crown land reserves (550 000 hectares, or 7 per cent) | $12.36 | $9.62 |
| DELWP(2) | DELWP-funded programs to address landscape scale threats | $32.00 (average across 4 years) | $32.00 (average across 4 years) |
| Parks Victoria(3) | National, state and regional parks (4 million hectares, or 50 per cent, of Crown land) | $10–15 | $10–15 |
| Zoos Victoria | Not applicable | $21.89 | $15.89 |
| Trust for Nature(4)(5) | Private land (62 per cent of Victoria’s land) | $4.90 | $6.40 |
| Commonwealth Government Landcare and Catchment Management Authority funded projects |
Public and private land | $6.95 | $13.85 |
| Total | $92.67–97.67 | $92.33–97.33 |
(1)Programs targeted at individual threatened species.
(2)Programs targeted at multiple species using actions to control landscape threats.
(3)Parks Victoria funding is approximate. A high and low range is provided as the figures may include DELWP-funded programs and may have some crossover with Australian Government funding.
(4)All direct intervention programs, but cannot determine how many benefited threatened versus native species.
(5)Overlapping of funds as DELWP directs funds to Trust for Nature. While we cannot use the figures to determine a total, we can use them as a comparison of what is spent on public versus private (minus local government).
Source: VAGO, based on information from DELWP, Parks Victoria and Trust for Nature and information from Zoos Victoria's Wildlife Conservation Master Plan 2019–24.
DELWP and Parks Victoria also implement a range of additional programs to protect biodiversity, which may directly or indirectly benefit threatened species. These include DELWP's Weeds and Pests on Public Land Program, its 2020 Victorian Deer Control Strategy and Peri-urban Weed Management Partnerships program. We are unable to identify specific portions of these programs that target DELWP priority areas to address landscape scale threats to threatened species, hence the amounts in Figure 3G estimate expenditure directly targeted to protect threatened species—as compared to indirect expenditure programs targeted to protect biodiversity, including all flora and fauna species.
The 2019 published research paper, Spending to save: What will it cost to halt Australia’s extinction crisis estimated that Australia would need to invest $1.69 billion annually to recover threatened species. One of the paper’s lead authors appeared at the parliamentary Inquiry into Ecosystem Decline in Victoria and stated Victoria would need at least $300 million annually directly spent on actions that protect its threatened species. Based on this figure, there was a significant shortfall in the funds needed to protect all listed threatened species between 2018–19 to 2019–20 based on our estimates in Figure 3G, as Figure 3H shows.
FIGURE 3H: Estimated funding shortfalls to protect listed species for 2018–19 and 2019–20
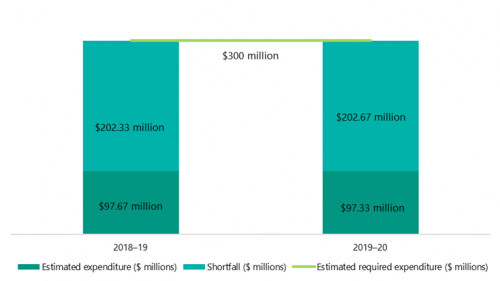
Source: VAGO, based on funding information from DELWP, Parks Victoria, Trust for Nature and Zoos Victoria.
This funding shortfall is exacerbated by the increased number of species on the Threatened List as of 1 June 2021. There has been no increase in the ongoing annual $20 million Budget allocation provided by the government to implement Biodiversity 2037 to account for the increased number of threatened species.
Biodiversity 2037 talks about establishing sustained funding and leveraging non government investment to protect Victoria’s biodiversity and threatened species. Biodiversity 2037’s four-year implementation plan identifies two priority actions for DELWP to investigate and adopt additional alternative funding approaches to secure sustained funding. In collaboration with other key stakeholders, DELWP began exploring alternative models of investment and released a draft Investment Strategy in 2019. To date, however, it is yet to finalise this strategy or adopt alternative investment models to provide sustained funding for Biodiversity 2037.
This is a critical gap in DELWP's approach. DELWP’s Biodiversity 2037 four-year implementation plan identified this as a priority action. We expect that this strategy would have been finalised and implemented as a priority in accordance with the plan.
Limited funding allocated to private land programs
Government funding to protect and recover threatened species on private land is limited.
Of the remaining native vegetation across Victoria’s 23 million hectares, an estimated 7.9 million hectares is located on public land and 3.3 million hectares is on private land. The Victorian Environmental Assessment Council states that this vegetation on private land provides a habitat for at least 30 per cent of Victoria’s threatened species populations.
Trust for Nature, which is the key public sector body working on private land conservation, estimates it is protecting and managing over 102 000 hectares (a small percentage of the total area) of Victoria’s private land through its 1 567 land covenants and its 43 private land nature reserves.
Trust for Nature spent $15.6 million from 2017 to 2020, an average of $5.2 million a year, to protect native flora and fauna (including threatened species) on private land, compared to $149 million spent on public land programs over the same period.
Trust for Nature had an average annual turnover of $7 million in these four years, which was made up of 20 per cent state funding. It receives recurring funding from DELWP of about $447 000 annually, with a further $920 000 to $950 000 from the Sustainability Fund and approximately $3 million in competitive government grants.
Trust for Nature developed Trust for Nature's Statewide Conservation Plan in 2013, which prioritises threatened species protection on private land. However, Trust for Nature’s ability to implement actions and monitor and report the impacts of its activities on private land is limited due to the funding it receives from DELWP and the government.
In June 2016, the NSW Government announced $340 million in additional funding over five years to manage, protect and enhance biodiversity. This included $240 million for a new strategic and prioritised private land conservation program.
3.5 Better-practice approach to protect threatened species
DELWP’s approach to inform and guide future investment to protect threatened species in fire-affected areas provides an example of a better-practice approach, as Figure 3I shows. However, this systematic evidence-based planning and implementation approach is not yet reflected in DELWP’s approach to protect threatened species outside of these areas across the state.
FIGURE 3I: Better-practice approach to protecting threatened species in fire impacted areas
DELWP's Biodiversity Bushfire Response and Recovery program is an example of a better practice program, with KPIs supported by monitoring programs to measure on-ground changes to threatened species.
In January 2020, the government provided DELWP with $17.5 million based on its comprehensive planning and assessment of the impact of the fires on species. DELWP used its decision-support tools, desktop assessments and expert input to identify and prioritise impacted threatened species for:
- immediate extraction and offsite recovery due to their risk of extinction
- urgent on-ground actions to halt impacted species at risk of further decline
- on-ground surveys where a lack of data and information existed about a species’ risk status
- ongoing monitoring and assessment of species' risk and status.
In August 2020, the government provided a further $25.5 million based on DELWP's efforts in protecting and recovering species in fire-impacted areas, which included evidence that further species were still at risk of decline. DELWP allocated $5 million to protect rare and threatened species identified in need of immediate intervention by DELWP’s on-ground assessments and surveys.
DELWP provided evidence-based progress reports to the government on the significant work undertaken, the outcomes achieved, and the further work required to prevent further threatened species extinctions and decline.
This included:
- the successful return of 14 extracted species to their on-ground habitats
- 510 000 hectares of predator control, which was identified as critical for flora and fauna species to re-establish after the fires
- on-ground seed recovery of rare plants
- outcomes of reconnaissance surveys for many threatened species.
Based on this, the government provided a further $29 million in the 2021–22 Budget for DELWP to continue its work in fire affected areas, including $16 million to further protect rare and threatened species.
Source: VAGO, from DELWP information. Photograph publicly available from DELWP bushfire response and recovery page.
The case study shows that with appropriate initial funding, threatened species protection programs can be well designed and implemented and outputs and outcomes can be achieved and reported. This was documented in DELWP’s 2020 Victoria's bushfire emergency: biodiversity response and recovery report. The reporting of evidence-based successful outcomes, such as 14 high-risk species extracted from fire-impacted areas, cared for and successfully returned to the wild, supported bids for further government funds, which were successful in 2019 and 2020.
Appendix A. Submissions and comments
Click the link below to download a PDF copy of Appendix A. Submissions and comments.

Appendix B. Acronyms and Abberviations
| Acronyms | |
|---|---|
| BP3 | Budget Paper No. 3: Service Delivery |
| BRP | biodiversity response planning |
| CSH | Change in Suitable Habitat |
| DELWP | Department of Environment, Land, Water and Planning |
| DTF | Department of Treasury and Finance |
| HDM | habitat distribution model |
| IUCN | International Union for Conservation of Nature |
| KPI | key performance indicator |
| MERF | Biodiversity 2037 Monitoring, Evaluation, Reporting and Improvements Framework |
| NSW | New South Wales |
| RMF | Resource Management Framework |
| SMP | strategic management prospects |
| SNA | specific needs analysis |
| VAGO | Victorian Auditor-General’s Office |
| VBA | Victorian Biodiversity Atlas |
| Abbreviations | |
|---|---|
| Biodiversity 2037 | Protecting Victoria’s Environment—Biodiversity 2037 |
| the Commissioner | Commissioner for Environmental Sustainability |
| FFG Act | Flora and Fauna Guarantee Act 1988 |
| the Minister | Minister for Energy, Environment and Climate Change |
Appendix C. Scope of this audit
| Who we audited | What we assessed | What the audit cost |
|---|---|---|
|
DELWP |
We assessed whether DELWP's management of Victoria's biodiversity loss is halting the decline of threatened species, including:
|
The cost of this audit was |
Our methods
As part of the audit we:
- reviewed legislation, policy, plans and strategic documents
- reviewed relevant agencies’ internal and publicly available documentation
- assessed relevant data, data management systems and tools
- assessed performance indicators and reporting
- interviewed agencies' staff and executive officers, stakeholders and subject matter experts
- consulted with Parks Victoria and Trust for Nature
We conducted our audit in accordance with the Audit Act 1994 and ASAE 3500 Performance Engagements. We complied with the independence and other relevant ethical requirements related to assurance engagements.
We also provided a copy of the report to the Department of Premier and Cabinet and the Department of Treasury and Finance.
Appendix D. DELWP's goals, outcomes, targets and KPIs
FIGURE D1: FFG Act objectives
| Objectives (section 4(a)–(d)) |
|---|
|
(a) to guarantee that all taxa of Victoria's flora and fauna can persist and improve in the wild and retain their capacity to adapt to environmental change |
|
(b) to prevent taxa and communities of flora and fauna from becoming threatened and to recover threatened taxa and communities so their conservation status improves |
|
(c) to protect, conserve, restore and enhance biodiversity, including: (i) flora and fauna and their habitats (ii) genetic diversity (iii) ecological communities (iv) ecological processes |
| (d) to identify and mitigate the impacts of potentially threatening processes to address the important underlying causes of biodiversity decline |
Source: VAGO, based on the FFG Act.
FIGURE D2: Biodiversity 2037 goals, outcomes, targets and KPIs
| Goal | Overall vision: Victoria's biodiversity is healthy, valued and cared for |
|---|---|
| Statewide target and expected outcomes |
A net improvement in the outlook across all species by 2037, as measured by CSH, with the expected outcomes being:
|
| Contributing targets |
|
| Annual targets |
|
| Annual KPIs |
|
| Five-year KPIs |
|
Source: VAGO, from DELWP information.
FIGURE D3: BP3 departmental objective, indicator and performance measures
| BP3 departmental objective | BP3 department objective indicator | BP3 output performance measures |
|---|---|---|
|
A healthy and resilient biodiverse environment |
Number of environmental partnerships |
|
Source: VAGO, from DELWP information.