Public Hospitals: 2014–15 Audit Snapshot
Overview
Clear audit opinions were issued for the 87 public hospitals and their 19 controlled entities for the financial year ending 30 June 2015. These entities make up the Victorian public hospital sector.
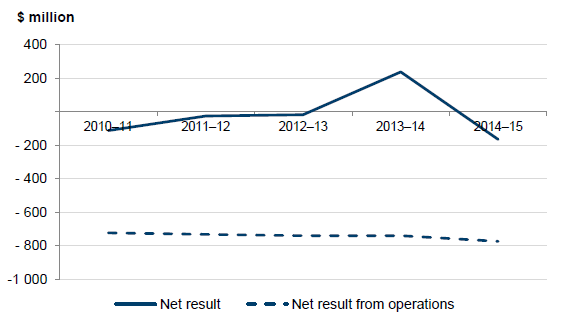
The sector generated a net deficit from operations (which excludes capital revenue) of more than $700 million annually in each of the past five financial years. The sector's net deficit from operations was $775.0 million in 2014–15 ($741.5 million in 2013–14). This has contributed to short-term cash-flow issues at individual public hospitals where they had taken actions such as delaying the payment of creditors or inappropriately using specific purpose funds to pay for operational costs. This indicates that the current funding model is not sufficiently sustainable for those hospitals.
Analysis of the sector found that public hospitals face both short- and long-term financial sustainability risks, as they are unable to generate a surplus from operations or build up reserves from operations to replace or renew their fixed assets.
The Department of Health & Human Services needs to work more closely with public hospitals to ensure that the funding model will address the root cause of public hospital financial sustainability risks. Financial support to public hospitals needs to allow them to fund operations, thus reducing public hospitals' cash-flow issues and this includes developing a longer-term financially sustainable framework for the renewal and replacement of assets.
Auditor-General's comments
|
Dr Peter Frost
Acting Auditor-General |
Audit team Ronald Mak—Engagement Leader Helen Grube—Team Leader Bryce Martin—Team member Peter Georgiou—Team member Melisa Kuru—Team member Engagement Quality Control Reviewer Timothy Maxfield |
Public hospitals have generated a net deficit from operations of more than $700 million annually in each of the past five financial years. The net deficit from operations excludes capital income used to fund new assets and/or to replace assets. The sector's net deficit from operations was $775.0 million in 2014–15 ($741.5 million in 2013–14).
These results have contributed to cash-flow issues at public hospitals which have resulted in them delaying the payment of creditors and using specific purpose funds to pay for operations. Further, the Department of Health & Human Services has issued letters of support to 31 public hospitals to enable their boards to attest in their 30 June 2015 financial statements that they can operate as a going concern. Collectively, this highlights public hospital boards' inability to adequately align their responsibilities to report a financially sustainable entity, when they are unable to cover their operating expenses with their operational revenue.
Analysis of the sector found that public hospitals face short- and long-term financial sustainability risks. In the short term, the sector is making operational losses and at times does not have sufficient funds to cover their current financial obligations. In the longer term, the sector is unable to generate sufficient surpluses to set aside to fund future asset renewal and replacement. Currently, asset funding is separately provided by the state and Commonwealth governments, following assessment of business cases for funding the sector as a whole. Ultimately, the inability of public hospitals to fund specific assets may impact the level and variety of services they are able to offer to the community.
The Department of Health & Human Services needs to work more closely with public hospitals to ensure that funding provided will address the root cause of public hospitals' financial sustainability risks to allow them to fund operations, thus reducing public hospitals' cash-flow issues and developing a longer-term financially sustainable framework that facilitates the renewal and replacement of assets.
Clear audit opinions were issued for the 87 public hospitals and their 19 controlled entities for the financial year ending 30 June 2015. However, 17 entities did not comply with Standing Direction 4.5.6 Treasury Risk Management of the Financial Management Act 1994. Noncompliance is a serious issue, and the Minister for Health has also requested that the Department of Health & Human Services ensures that this matter is resolved before the end of 2015.

Dr Peter Frost
Acting Auditor-General
November 2015
Audit summary
Introduction
This report details the outcome of the financial audits of the 87 public hospitals in Victoria, and their 19 controlled entities, for the financial year ending 30 June 2015.
The report identifies and discusses key issues within the public hospital sector that arose during the financial audits, and provides an analysis of the information included in the public hospital financial statements at 30 June 2015. To assist in this analysis, the 87 public hospitals are split into four cohorts—metro, regional, rural and small rural—which is based on their size and location.
Conclusions
Public hospitals have generated a net deficit from operations of more than $700 million annually in each of the past five financial years. The sector's net deficit from operations was $775.0 million in 2014–15 ($741.5 million in 2013–14). This has given rise to short-term cash-flow issues at individual public hospitals where they had taken actions such as delaying the payment of creditors or inappropriately using specific purpose funds to pay for operational costs. This indicates that the current funding model is not sufficiently sustainable for those hospitals.
Analysis of the sector found that public hospitals face both short- and long-term financial sustainability risks, as they are unable to generate a surplus from operations or build up reserves from operations to replace or renew their fixed assets.
The Department of Health & Human Services (DHHS) needs to work more closely with public hospitals to ensure that the funding model will address the root cause of public hospital financial sustainability risks. Financial support to public hospitals needs to allow them to fund operations, thus reducing public hospitals' cash-flow issues and this includes developing a longer-term financially sustainable framework for the renewal and replacement of assets.
Findings
Clear financial audit opinions were issued for the 87 public hospitals and their 19 controlled entities for the year ending 30 June 2015. This means that Parliament and the public can have confidence in the financial statements of these entities.
While the general internal control frameworks of these entities were appropriate for financial reporting, we noted 93 control weaknesses across the 87 public hospitals that should be addressed by management as soon as possible. Public hospitals need to be more timely in addressing the issues identified by audit, as the sector has not resolved 84 issues (64.1 per cent) from prior year audits.
At 30 June 2015, the public hospital sector held $454.4 million in short-term investments ($510.5 million at 30 June 2014), and $291.2 million in long-term investments ($288.6 million in 2014).
2014–15 was the first financial year public hospitals were required by Standing Direction 4.5.6 Treasury Risk Management of the Financial Management Act 1994, to invest non-operational funds of greater than $2 million with the state's treasury bodies, rather than investing in deposit institutions with a lower than AAA credit rating. Seventeen public hospitals did not comply with this requirement, and the Minister for Health has made a commitment that this issue will be resolved by 31 December 2015.
Financial outcomes
The public hospital sector generated a net deficit of $165.9 million in the 2014–15 financial year ($237.1 million surplus in 2013–14). The comprehensive net result includes all categories of revenue and expenditure the public hospital sector has recorded during the financial year. This report also reviews the net result from operations generated by the sector, which excludes capital revenue and other comprehensive income that a public hospital has received in the financial year.
Public hospitals have generated a net deficit from operations of more than $700 million annually in each of the past five financial years. The net operational deficit was $775.0 million in 2014–15 ($741.5 million deficit in 2013–14). This net deficit from operations excludes capital revenue, but includes depreciation costs.
The main source of public hospital revenue is government grant funding. Public hospitals received $10.9 billion of government funding in 2014–15 ($10.8 billion in 2013–14), making up 82.6 per cent (82.6 per cent in 2013–14) of $13.1 billion in total revenue. Of this, $0.7 billion related to capital funding in 2014–15 ($1.0 billion in 2013–14).
The metro public hospital cohort generated a net deficit from operations of $553.6 million, after $525.3 million in depreciation costs. This represents a shortfall of $28.3 million in operational funding that these public hospitals need to achieve a break-even on the provision of their services to the public. Other cohorts generated a net deficit from operations similar to their depreciation costs.
Financial sustainability risks
Our analysis shows that the sector is facing short- and long-term financial sustainability risks, with 48 public hospitals (55.2 per cent) rated as having a medium or high liquidity risk at 30 June 2015, and most public hospitals in all cohorts receiving a high-risk rating for their capital replacement and internal financing indicators.
The larger hospitals, such as the metro and regional cohorts, are experiencing higher financial sustainability risks. Two-thirds (22) of these 33 public hospitals have a high liquidity risk.
The continuing deficits are not allowing public hospitals to build up reserves from operations to replace or renew their fixed assets. Funds for replacement and new assets are provided mostly through specific purpose government grants, which are awarded based on the assessment of business cases. In addition, public hospitals also undertake specific fund raising. Current revenue levels create longer-term financial sustainability risks, and could, ultimately, impact the quality and variety of services offered to the public.
Liquidity and cash management
As a consequence of the operating deficits, public hospitals experienced instances during the financial year where they had cash shortfalls, meaning they could not cover operational costs with their operational revenue.
We reviewed seven 'case-study' public hospitals to ascertain how they managed to continue to operate in an environment with poor cash-flow, and found measures taken included delaying the payment of creditors or inappropriately using specific purpose funds to cover operational costs.
The measures taken by the public hospitals to enable them to continue to meet their financial obligations are short-term symptom responses to the situation, and do not resolve the longer-term core issues regarding operational funding. DHHS needs to work more closely with public hospitals to make sure that the funding model provides financially sustainable support to public hospitals to allow them to fund operations, thus reducing public hospitals' cash-flow issues and developing a longer-term sustainable framework that facilitates the renewal and replacement of assets.
Recommendations
That public hospitals' governing boards and their management:
- implement appropriate governance and monitoring mechanisms to ensure all audit findings are addressed on a timely basis.
That public hospitals:
- comply with the requirements of Standing Direction 4.5.6 Treasury Risk Management of the Financial Management Act 1994.
That the Department of Health & Human Services:
- reviews the public hospital funding model to provide sustainable operational funding to enable public hospitals to replace or acquire new assets as required
- reviews and sets a commercially accepted target for the terms of trade with creditors and debtors, in line with state government policy.
That public hospitals:
- review their debtor collection policy and processes, and follow up on debtors that are overdue
- use restricted funds only for their intended purpose.
Submissions and comments received
We have professionally engaged with the Department of Health & Human Services throughout the course of the audit. In accordance with section 16(3) of the Audit Act 1994 we provided a copy of this report, or relevant extracts of this report to the Department of Health & Human Services and named public hospitals with a requested for submissions or comments.
We have considered those views in reaching our audit conclusions and have represented them to the extent relevant and warranted. Their full section 16(3) submissions and comments are included in Appendix E.
1 Context
1.1 Introduction
1.1.1 Structure of this report
This report details the outcome of the financial audits of the 87 public hospitals in Victoria, and their 19 controlled entities, for the financial year ending 30 June 2015.
Figure 1A outlines the structure of this report.
Figure 1A
Report structure
|
Part |
Description |
|---|---|
|
Part 1: Context |
Provides a summary of the results of the 2014–15 financial audits, including control weaknesses identified during the audits. Provides an overview of funding arrangements for public hospitals. |
|
Part 2: Financial outcomes |
Comments on the financial outcomes of the 87 public hospitals to 30 June 2015, including discussion of key financial issues impacting the 2014–15 financial statements, public hospital revenue and expenditure. Discusses the financial sustainability risks faced by the sector at 30 June 2015. |
|
Part 3: Liquidity and cash management |
Comments on liquidity and cash management at public hospitals. This includes a review of selected case studies. |
Source: Victorian Auditor-General's Office.
Pursuant to section 20(3) of the Audit Act 1994, unless otherwise indicated, any persons named in this report are not the subject of adverse comment or opinion.
The total cost of this report was $200 000.
1.2 Context
The 87 public hospitals across Victoria operate under the Health Services Act 1988 (the Act). The relevant objectives of the Act to this report are detailed in Figure 1B.
Figure 1B
Objectives of the Health Services Act 1988
|
Source: Health Services Act 1988, section 9.
The 87 public hospitals vary in size, capacity and range of services provided. Public hospitals are predominately funded by Commonwealth and state government grants. Public hospitals are required to prepare their financial statements in accordance with the Financial Management Act 1994 (FMA).
We have classified the public hospitals into four cohorts based broadly on their location, size and funding. Figure 1C details the cohorts and how many hospitals are in each as at 30 June 2015. Appendix A lists the hospitals within each cohort. References in this report to the public hospital sector refer to all 87 hospitals, plus the entities they control.
Figure 1C
Public hospitals—cohorts used in this report
|
Cohort |
Number of hospitals |
Example hospital included |
|---|---|---|
|
Metro |
18 |
Monash Health Royal Children's Hospital |
|
Regional |
15 |
Ballarat Health Services Latrobe Regional Hospital |
|
Rural |
11 |
Bass Coast Health Portland District Health |
|
Small rural |
43 |
Alpine Health Omeo District Hospital |
|
Total |
87 |
Note: Denominational hospitals—Calvary Health Care Bethlehem Ltd, Mercy Public Hospital Inc, and St Vincent's Hospital Melbourne Ltd—have been included in Metro.
Source: Victorian Auditor-General's Office.
1.3 Audits for the year ending 30 June 2015
1.3.1 Opinions issued
Independent audit opinions add credibility to financial statements by providing reasonable assurance that the information reported is reliable and accurate. A clear audit opinion confirms that the financial statements present fairly, in all material respects, the transactions and balances for the reporting period, in accordance with the requirements of relevant accounting standards and legislation.
Eighty-seven clear audit opinions were issued to public hospitals and 19 to controlled entities for the financial year ending 30 June 2015. The financial audits of these entities were undertaken in accordance with Australian Auditing Standards. The opinions for Bass Coast Health and West Gippsland Healthcare Group were signed after the statutory deadline of 22 September 2015, as these two public hospitals experienced delays in the production of their financial statements.
1.4 Key issues identified during 2014–15 audits
This report seeks to bring to Parliament's attention material financial reporting issues that were identified during the 2014–15 financial audits of the 87 public hospitals, as well as a summary of internal control weaknesses identified through the audit process.
1.4.1 Investment of funds by public hospitals
This is the first year public hospitals were required to comply with Standing Direction 4.5.6 Treasury Risk Management of the Minister for Finance, issued pursuant to the FMA. Public hospitals were exempted from this requirement in the prior years by the Minister for Finance.
This Standing Direction requires public hospitals to invest all non-operational and non‑exempt funds with a financial institution that is either a state-owned entity—such as the Treasury Corporation of Victoria, or the Victorian Managed Funds Corporation—or has a credit rating, assigned by a reputable rating agency, that is the same as, or better than, the State of Victoria. The state has been rated AAA by the rating agencies Standard and Poor's and Moody's. An entity can request an exemption from this Standing Direction, but this can only be granted by the Treasurer.
At 30 June 2015, the public hospital sector held $454.4 million in short-term investments ($510.5 million at 30 June 2014), and $291.2 million in long-term investments ($288.6 million in 2014). At this date, the Reserve Bank of Australia had a cash rate of 2.00 per cent. This is the rate that the state financial institutions offer, compared to a higher average retail deposit return rate of 2.85 per cent that would otherwise be available to public hospitals.
Of the 87 public hospitals, 70 complied with the investment requirements of Standing Direction 4.5.6 at 30 June 2015. The remaining hospitals were noncompliant, as they had not invested the required funds in institutions with AAA ratings, nor had they obtained an exemption from compliance with the Standing Direction from the Treasurer. The Treasurer had determined not to support exemptions from the Standing Direction for public hospitals as all Government agencies should be treated consistently and the great majority comply with the Standing Direction 4.5.6, and have access to the services of the Treasury Corporation of Victoria and the Victorian Managed Funds Corporation. The Minister for Health has also requested that the Department of Health & Human Services ensures that this matter is resolved before the end of 2015.
1.4.2 General internal controls
In conducting our financial audits, we found that those internal controls that were tested were adequate and reliable for the purposes of financial reporting. Nevertheless, we identified a number of instances where these controls need to be strengthened.
Weaknesses in internal controls found during an audit are reported to the board, chief executive officer and the audit committee through a formal letter, called a management letter. Typically, two management letters will be provided during a financial audit—an interim and a final.
In 2014–15, across the 87 public hospitals, 93 high- and medium-risk control-related issues were reported through interim and final management letters. Figure 1D shows the reported issues by area and risk rating. The risk ratings used in our management letters are provided in Appendix B.
Figure 1D
2014–15 management letter issues by area and risk rating
|
Area of issue |
Risk rating of issue |
|||
|---|---|---|---|---|
|
Extreme |
High |
Medium |
Total |
|
|
Expenditure and accounts payable |
– |
3 |
14 |
17 |
|
Payroll |
– |
3 |
10 |
13 |
|
Information systems |
– |
14 |
11 |
25 |
|
Revenue, cash and accounts receivable |
– |
1 |
6 |
7 |
|
Fixed assets |
– |
– |
4 |
4 |
|
Other |
– |
3 |
6 |
9 |
|
Financial reporting |
– |
3 |
15 |
18 |
|
Total |
– |
27 |
66 |
93 |
Note: Figure 1D excludes low-risk issues raised.
Source: Victorian Auditor-General's Office.
The most common issues reported concerned information systems. These were discussed in further detail in our report Financial Systems Controls Report: Information Technology 2014–15 (tabled in Parliament in October 2015). In summary, the weaknesses identified included user access not aligning with staff member's roles and duties of employment, and generic user accounts set up for some systems which were shared among several users.
The issues identified can impact the integrity of the underlying financial data, and the weaknesses should be rectified as soon as possible to reduce the possibility of material misstatements in the financial statements.
Appendix B outlines the expected time lines for the resolution of issues based on the risk rating provided.
1.4.3 Status of prior period issues
The status of internal control weaknesses identified in prior periods are presented and communicated through the current year's management letters. These issues are monitored to ensure weaknesses in the controls identified in previous audits are resolved promptly.
Figure 1E shows the status of internal control weaknesses identified in the prior period, by risk rating.
Figure 1E
Prior period internal control weaknesses—resolution status by risk
|
Area of issue |
Risk rating |
|||
|---|---|---|---|---|
|
Extreme |
High |
Medium |
Total |
|
|
Unresolved |
– |
8 |
76 |
84 |
|
Resolved |
– |
5 |
42 |
47 |
|
Total |
– |
13 |
118 |
131 |
Note: Figure 1E excludes low-risk issues raised.
Source: Victorian Auditor-General's Office.
Nearly two-thirds (64.1 per cent) of prior year issues raised remained unresolved at 30 June 2015. This indicates that public hospitals are not addressing the weaknesses identified in a timely manner, nor following the recommended time lines for the resolution of issues as detailed in Appendix B.
1.5 Public hospital sector funding
1.5.1 Government funding
Public hospitals received $10.9 billion of government funding in 2014–15 ($10.8 billion in 2013–14), making up 82.6 per cent (82.6 per cent in 2013–14) of total revenue. Of this, $0.7 billion related to capital funding in 2014–15 ($1.0 billion in 2013–14).
The National Health Reform Agreement 2011 was entered into by all states, territories and the Commonwealth in August 2011. It sets out the shared intention of the Commonwealth, and state and territory governments to work in partnership to improve health outcomes for all Australians and ensure the sustainability of the Australian health system.
The state and the Commonwealth both contribute funding for hospitals into a single national pool which is administered by an independent national funding body, distinct from Commonwealth and state departments. Figure 1F shows the flow of funds from both levels of government to public hospitals through the State Pool Account (the Pool).
Figure 1F
Funding flows between the Commonwealth Government, state government and Victorian public hospitals
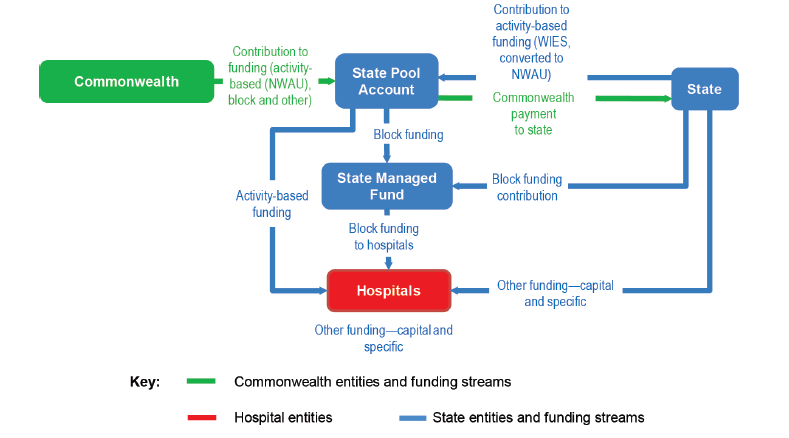
Note: NWAU = National Weighted Activity Units, WIES = Weighted Inlier Equivalent Separation.
Source: Victorian Auditor-General's Office.
Hospitals are funded to perform their services from three streams of revenue. The majority of hospitals will receive a combination of 'activity based', 'block' and 'other' funding to perform their services to the community.
Activity-based funding (ABF) is given to hospitals to fund acute admitted, non-admitted, emergency department, sub-acute, and admitted mental health service categories. ABF funding is a method of funding allocation based on unit prices for each activity undertaken, and the number of that activity to be performed by a hospital.
ABF funding is paid to hospitals through the Pool, which receives contributions from the state and Commonwealth.
The state provides funds to the Pool based on unit prices set by the WIES regime, and up to the targeted level of activity to be performed by each public hospital. These activity levels are detailed in each hospital's annual Statement of Priorities, which are endorsed by the Victorian Minister for Health.
The funds provided to the Pool by the Commonwealth are linked to state's proposed activity levels and are calculated based on service volume estimates provided by the state at the start of each financial year, which is expressed as NWAU. The unit price of the NWAU is determined by the Commonwealth, and can differ to the unit price used by the state through the WIES regime.
Block funding is provided for non-admitted mental health, teaching, training and research and other non-admitted categories of service. This funding is provided to individual hospitals based on their population, particularly where the nature of the services provided by the hospital to the local community would not generate enough funding through the ABF method. Small rural hospitals often receive block funding, rather than ABF funding.
Other funding is made up of Commonwealth and state contributions to public health services, which are paid to the hospitals by the Department of Health & Human Services and the State Managed Fund. This funding includes one-off grants specifically for capital projects.
1.5.2 Funding future
Since July 2014, Victorian funding of public hospitals by the Commonwealth has been on an ABF approach, and the pledge from the Commonwealth was to meet 45 per cent of the growth rising to 50 per cent after 2017.
However, from 1 July 2017, the Commonwealth will no longer use this model—its contribution will be linked instead to movements in the consumer price index (CPI) and population growth. This is a return to the funding model that was in place prior to July 2014. Effectively, if the CPI movements are less than the increase in the cost of medical services, the state will face a shortfall of funding under the future model.
Recommendations
- That public hospitals' governing boards and their management implement appropriate governance and monitoring mechanisms to ensure all audit findings are addressed on a timely basis.
- That public hospitals comply with the requirements of Standing Direction 4.5.6 Treasury Risk Management of the Financial Management Act 1994.
2 Financial outcomes
At a glance
Background
This Part looks at the 30 June 2015 financial performance and position of the 87 public hospitals and their controlled entities. It details the main drivers behind the net results achieved, and analyses the sector against five financial sustainability risk indicators.
Conclusion
The public hospital sector has generated a net deficit from operations of more than $700 million each year for the past five financial years.
The continuing deficits are not allowing public hospitals to build up any reserves from operations to replace or renew their fixed assets. Funding for replacement and new assets has mostly come from specific purpose government grants. The current funding model does not address longer-term financial sustainability risks, and could ultimately impact the quality and variety of services offered to the community.
Findings
- The public hospital sector generated a deficit of $165.92 million at 30 June 2015 ($237.1 million surplus at 30 June 2014), and a deficit from operations—after excluding capital revenue—of $775.0 million ($741.5 million deficit at 30June2014).
- Analysis of the net operating cash inflow shows that the sector did not generate sufficient cash inflows from operations to cover cash outflows.
- Public hospitals received $10.9 billion of government funding in 2014–15 ($10.8billion in 2013–14), making up 82.6 per cent (82.6 per cent in 2013–14) of revenue. Of this, $0.7 billion related to capital funding in 2014–15 ($1.0 billion in 2013–14).
- The sector faces short- and long-term financial sustainability risks—generating a deficit on its operations and it is unable to put funds aside to replace and renew assets as required.
Recommendation
That the Department of Health & Human Services reviews the public hospital funding model to provide sustainable operational funding to enable public hospitals to replace or acquire new assets as required.
2.1 Introduction
This Part reviews the financial results and performance of the public hospital sector for the 2014–15 financial year. It also assesses the sector against five financial sustainability risk indicators at 30 June 2015.
2.2 Conclusion
At 30 June 2015, the 87 consolidated public hospitals generated a net operating deficit of $775.0 million, after excluding capital revenue. The sector shows a constant deficit from operations of more than $700 million for each of the past five financial years. This means that the revenue from operations have not adequately covered the operating expenditure of the sector.
The continual deficits are not allowing public hospitals to build up any reserves from their operations to replace or renew their fixed assets. Funds for replacement and new assets have been derived mostly from Department of Health & Human Services (DHHS) or specific fund raising undertaken by the public hospitals. This adds to longer-term financial sustainability risks, and may impact on the quality and variety of services offered to the community at each public hospital.
2.3 Financial overview of the sector
Figure 2A summarises the key financial balances of the public hospital sector at 30 June 2015. The sector had a turnover of $13.2 billion for 2014–15 ($12.9 billion in 2013–14). It generated a comprehensive deficit of $165.9 million at 30 June 2015 ($235.7 million surplus at 30 June 2014).
Figure 2A
Key balances for public hospital sector for the financial year ending 30 June 2015
|
Cohort |
Revenue ($ million) |
Expenditure ($ million) |
Net result ($ million) |
Net assets ($ million) |
|---|---|---|---|---|
|
Metro |
9 340.65 |
9 429.47 |
–88.82 |
6 448.51 |
|
Regional |
2 844.05 |
2 895.69 |
–51.64 |
2 116.34 |
|
Rural |
404.21 |
421.14 |
–16.93 |
429.56 |
|
Small rural |
563.05 |
571.57 |
–8.53 |
909.20 |
|
Total |
13 151.95 |
13 317.88 |
–165.92 |
9 903.61 |
Source: Victorian Auditor-General's Office.
2.3.1 Net result
The net result of the public hospital sector includes both operational and capital funding provided to public hospitals from the state and Commonwealth governments and recorded in accordance with the Australian Accounting Standards.
As noted in Part 1, capital funding is often one-off in nature for specific projects such as new assets, replacing or repairing equipment. Money received by the sector for capital projects should not be used by public hospitals to fund normal operations. Public hospitals do not receive any specific funding for depreciation of assets. Figure 2B shows the net results of the public hospital sector for the financial years 2010–11 to 2014–15 as per the audited financial statements of the 87 consolidated public hospitals making up the sector.
The comprehensive net result includes all categories of revenue and expenditure the public hospital has recorded during the financial year. The net result from operations excludes capital revenue that the public hospital has received in the financial year.
Figure 2B
Comprehensive and operational net results of public hospital sector
Source: Victorian Auditor-General's Office.
Comprehensive net result
Figure 2B shows that the public hospital sector has been making a net comprehensive deficit every financial year since 2010–11, with the exception of 2013–14.
The metro cohort was the key driver behind the sector's surplus in 2013–14, with $745.4 million being provided in capital purpose income to this cohort in that financial year. By comparison, metro public hospitals received $508.5 million in capital purpose income during 2014–15. Building projects undertaken by the metro public hospitals and funded using this capital income during the 2013–14 and 2014–15 financial years include:
- Eastern Health—redevelopment of Box Hill Hospital
- Melbourne Health and the Peter MacCallum Cancer Institute—constructing the Victorian Comprehensive Cancer Centre
- Peninsula Health—expanding the Frankston Emergency Department and the rehabilitation centre at Mornington.
The 2014–15 deficit was driven by losses at 79.3 per cent of public hospitals during this period, inclusive of capital grant revenue (66.7 per cent in 2013–14).
Net result from operations
The net result from operations for the sector was a deficit of $775.0 million at 30 June 2015, in line with similar deficits in prior years.
This means that in 2014–15, the normal operations of the 87 consolidated public hospitals are costing more than funding received or revenue generated. This deficit is mostly due to depreciation expenses as shown in Figure 2C.
Figure 2C
Net result analysis per cohort at 30 June 2015
|
Cohort |
Net result 2015 |
Revenue excluding capital purpose income |
Expenditure |
Net result from operations |
Depreciation |
Net operating cash outflows |
|---|---|---|---|---|---|---|
|
Metro |
–88.82 |
8 875.91 |
9 429.47 |
–553.56 |
525.26 |
376.38 |
|
Regional |
–51.64 |
2 740.18 |
2 895.69 |
–155.51 |
164.33 |
107.55 |
|
Rural |
–16.93 |
393.76 |
421.14 |
–27.38 |
26.19 |
5.96 |
|
Small rural |
–8.53 |
533.01 |
571.57 |
–38.56 |
53.89 |
23.53 |
|
Total |
–165.92 |
12 542.86 |
13 317.87 |
–775.01 |
769.67 |
513.42 |
Source: Victorian Auditor-General's Office.
Analysis of the net operating cash inflow for the same period shows that the sector did not generate sufficient cash inflows from operations to cover cash outflows for this period.
The metro cohort was the major contributor to the net deficit from operations position with losses of $553.6 million in 2014–15. This loss is due to operational expenses outstripping revenue or funding received by $28.3 million and depreciation. This shortfall can be linked to the type of the public hospitals within this cohort—with the 18 public hospitals being metro-based public hospitals that treat and provide a higher variety of service across a large cross-section of Victoria's population.
As shown in Part 3 of this report, Alfred Health and Melbourne Health, both metro public hospitals, have required additional funds from DHHS to help them address this shortfall; with Alfred Health receiving a $10 million loan in 2013–14, and Melbourne Health receiving $11.7 million in additional funding in 2014–15. In both cases, the money was used to fund operational costs such as creditors and payroll.
The small rural cohort of public hospitals receives block funding rather than activity-based funding (ABF). However, Figure 2C shows that this cohort, together with the other cohorts, has still not generated sufficient operating surplus to fully cover its depreciation expenses.
2.3.2 Revenue and expenditure
For the 2014–15 financial year, the public hospital sector generated revenue of $13.2 billion ($12.9 billion in 2013–14) which includes capital revenue. It incurred expenditure of $13.3 billion ($12.6 billion in 2013–14).
Revenue
As noted in Part 1, the major revenue source of the sector was government funding primarily for operational purposes, with the sector receiving $10.9 billion of government funding in 2014–15 ($10.8 billion in 2013–14), making up 82.6 per cent (82.6 per cent in 2013–14) of revenue. Of this, $0.7 billion related to capital funding in 2014–15 ($1.0 billion in 2013–14).
Other revenue received by the sector included private patient fees, donations from the public and income from commercial research. Figure 2D shows the sources of the revenue public hospitals generated in 2014–15.
Figure 2D
Revenue received by the public hospital sector in 2014–15
Source: Victorian Auditor-General's Office.
Despite government funding being the main source of revenue, public hospitals have limited control over the amount of government grants they received. As noted in Part 1, public hospitals are funded for operations through a mix of activity-based, block and other funding. The amount of money awarded to each hospital is determined by the state government, through DHHS and paid through the State Pool Account and State Managed Fund, and is based on the operational services that the hospital has agreed with the state to deliver to its patients during the financial year. While public hospitals provide key information into this calculation regarding expected service types and levels, the funding they are provided for each service is determined by government and standardised for the sector, thus bringing subject variability to each public hospital.
For capital funding, public hospitals are required to apply to the government, and submit a business case supporting their application. The government then determines the value and benefit of any grant awarded.
There are limited avenues for a public hospital to raise additional revenue for operational activities—for example, donations raised through public hospital foundations are usually for a specific purpose, or are required to be used as per the donor's instructions.
Expenditure
For the 2014–15 financial year, the sector spent $13.3 billion ($12.6 billion in 2013–14). Figure 2E summarises the types of expenditure incurred by the sector in 2014–15.
Figure 2E
Expenditure by the public hospital sector in 2014–15
The main expenditure of public hospitals is the cost of employees—costing the sector $8.8 billion in 2014–15 ($8.5 billion in 2013–14). Similar to their main source of revenue, the cost of employees is largely outside of a public hospital's control, with the state government setting the key factors influencing this cost and volume, including:
- penalty and wage rates
- patient-to-staff ratios dictating the minimum number of medical staff a public hospital will require for each service.
These factors are determined through the enterprise bargaining agreement, which is negotiated between the state government and the relevant staff unions. Public hospital boards and management are required to abide by the terms of the agreement, despite having no direct input into the negotiations. As a result, they only have limited ability to control their employee-related expense costs.
Public hospitals have more discretion over other types of expenditure, which is dependent on the needs of the community. Therefore, a public hospital has a very tight margin in which both to manage expenses and improve their net result.
Impact on net deficit from operations
As shown in Figure 2B, the sector has continually generated a deficit of more than $700 million annually over the past five financial years from their operations.
Due to the nature of public hospitals' revenue and expenditure, and the major components of both being outside their control, individual public hospitals have a limited capacity to generate additional revenue, or to reduce expenditure in order to reduce ongoing deficits.
Part 3 of this report analyses how a sample of public hospitals across the cohorts have dealt with such challenges during 2014–15. However, there are long-term implications to the continual build-up of deficits for the sector, which are discussed through our review of financial sustainability risk indicators below.
2.4 Financial sustainability risks
To be financially sustainable, public hospitals should aim to generate sufficient revenue from operations to meet their operational obligations, and to fund asset replacement and acquisitions.
We use five financial sustainability risk indicators over a five-year period to assess the potential risks in the public hospital sector. An overall risk rating is determined for each public hospital taking into account short- and long-term risks, based on their financial statement results. Appendix C describes the financial sustainability indicators, risk assessment criteria and benchmarks we use in this report.
Figure 2F summarises the financial sustainability risk ratings for the sector for 30 June 2015 based on public hospital cohorts. The financial sustainability risk indicators are based on the consolidated financial statements of each public hospital, and include capital revenue.
Figure 2F
Financial sustainability risk indicators for public hospital sector at 30 June 2015
|
Indicator |
Industry average |
Metro average |
Regional average |
Rural average |
Small rural average |
|
|---|---|---|---|---|---|---|
|
2010–11 to 2014–15 |
2014–15 |
|||||
|
Net result ratio |
–1.5% |
–2.6% |
–0.6% |
–2.0% |
–4.0% |
–3.8% |
|
Liquidity ratio |
1.1 |
1.1 |
1.1 |
0.8 |
1.0 |
1.3 |
|
Average number of cash days available |
39.47 |
35.5 |
20.5 |
29.7 |
36.2 |
55.8 |
|
Capital replacement ratio |
1.1 |
1.2 |
1.3 |
1.4 |
0.8 |
1.3 |
|
Internal financing ratio |
–75.5% |
–96.5% |
–174.8% |
–86.8% |
–52.6% |
–71.6% |
Note: A red result shows a high-risk assessment, a orange result is a medium-risk assessment and a green result is a low-risk assessment.
Source: Victorian Auditor-General's Office.
2.4.1 Short-term indicators
The short-term indicators—net result, liquidity and available cash days—show the financial sustainability risk the sector faces in the next 12 months. This analysis includes whether the sector is making a surplus or if it can cover its short-term financial obligations from its current liquid assets.
Public hospitals continue to face short-term financial sustainability risks over the past five years. Sixty-nine public hospitals (79.3 per cent) generated a net comprehensive deficit in 2014–15, and 48 (55.2 per cent) had a liquidity ratio of less than one at 30 June 2015. This is largely a result of the funding model, which does not specifically fund depreciation.
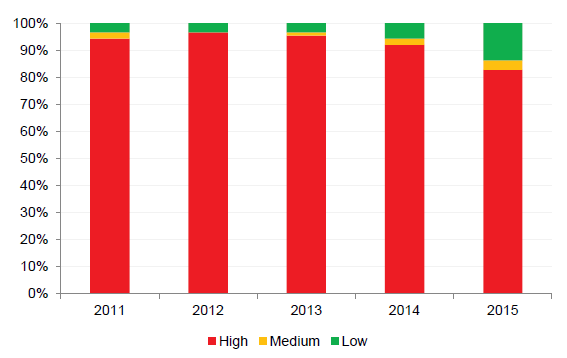
Net comprehensive result
As discussed in Section 2.3.1, Figure 2B shows that the public hospital sector has been making a net comprehensive deficit every financial year since 2010–11, with the exception of 2013–14. This surplus was driven by capital purpose income paid to metro public hospitals in that financial year. Figure 2G shows this impact through the net result indicator, over the same five financial years.
Figure 2G
Net result indicator for the public hospital sector, financial years ending 30 June 2011 to 2015
Note: The financial sustainability risk indicators are based on the consolidated financial statements of each public hospital, and include capital revenue.
Source: Victorian Auditor-General's Office.
Liquidity
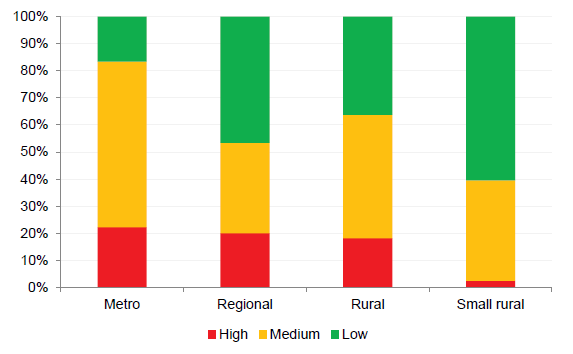
As shown in Figure 2F, the overall sector, and each public hospital cohort, has been rated as having a low to medium risk for liquidity. However, these results are influenced by the highly positive results of a few public hospitals, which is masking the high number of individual public hospitals in some cohorts with a high risk of not being able to meet their current financial obligations over the next 12 months. This is shown in Figure 2H.
Figure 2H
Liquidity ratio per cohort for 30 June 2015
Note: The financial sustainability risk indicators are based on the consolidated financial statements of each public hospital, and include capital revenue.
Source: Victorian Auditor-General's Office.
The small rural public hospital cohort, which solely receives block funding, is the only cohort not facing short-term financial sustainability risks, with only four public hospitals rated as high risk for liquidity. However, the cohorts funded for operations solely through ABF have immediate short-term liquidity risks, with 22 of the 33 metro and regional public hospitals rated as high risk.
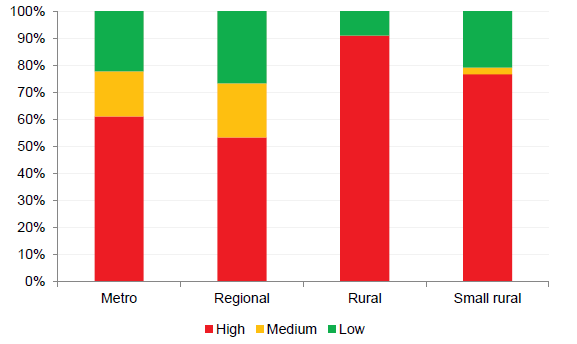
Average number of cash days available
Additional information regarding the short-term financial sustainability risks faced by the public hospital sector is demonstrated with the average number of cash days available. This ratio shows how many days the public hospital can operate using the cash they have available at 30 June which is not restricted for a predetermined purpose. Ideally, public hospitals should have more than 30 days' worth of funds available as this will be in line with the public hospitals' monthly government funding cycle. We rate public hospitals with less than seven days funding as being at high risk.
Figure 2I details the risk ratings of each public hospital cohort at 30 June 2015.
Figure 2I
Average number of cash days available indicator for financial year ending 30 June 2015
Note: The financial sustainability risk indicators are based on the consolidated financial statements of each public hospital, and include capital revenue.
Source: Victorian Auditor-General's Office.
This ratio indicates that the risk is similar across the cohorts receiving ABF (metro, regional and rural public hospitals). Forty-seven public hospitals (54.0 per cent) across all cohorts, at least 40 per cent in each cohort, do not hold enough cash to finance their operating costs beyond 30 days after 30 June if no additional funds are received. This is an increase on the prior year, when 31 public hospitals (35.6 per cent) were in this position.
None of the small rural public hospitals have a high-risk rating for this indicator at 30 June 2015. This is attributed to their lower operating costs per day, due to offering less varied services and catering to a smaller catchment population cluster than other public hospital cohorts.
Letters of comfort
Each year, when preparing their financial statements, a public hospital's board must assess its ability to continue as a going concern entity over the next 12 months, as a minimum. This includes an assessment of their short-term financial sustainability position.
At 30 June 2015, 31 public hospitals (32 at 30 June 2014) sought written confirmation from DHHS that adequate cash-flow support would be available, if required, to enable them to meet current and future operational obligations as and when they fall due until 30 September 2016 or 31 October 2016 dependent on when the financial statements were certified. This has allowed the public hospitals to adopt the going concern assumption in their financial statements. This additional support by DHHS has been disclosed in the 31 public hospitals' annual financial statements.
2.4.2 Longer-term indicators
The longer-term indicators of capital replacement and internal financing assess the ability of the public hospital sector to replace and/or renew their fixed assets at the rate they are using them, and if they are able to fund the replacement from operations.
As shown in Figure 2C, public hospitals did not generate a surplus from their operations, nor were they able to fund their depreciation expenses from operations. At 30 June 2015, the 87 public hospitals collectively held $12.3 billion of fixed assets ($12.0 billion at 30 June 2014), with $0.77 billion in depreciation expenses during the year ($0.72 billion in 2013–14).
This means that public hospitals are unable to put funds aside for the renewal or replacement of assets from operations, leaving them heavily reliant on other funding sources. New or replacement assets are often funded through capital purpose grants awarded by DHHS. However, funding may not be awarded evenly across all cohorts and DHHS has a finite amount of funds to distribute each year—as determined by the State Budget— and award this on an as-needs basis across the 87 public hospitals.
Figure 2F indicates that across the sector, public hospitals have a longer-term financial sustainability risk based on the capital replacement and internal financing indicators.
Capital replacement
The capital replacement indicator illustrates whether public hospitals are spending more on replacing or renewing assets each year compared with depreciation costs. Depreciation costs approximate the value of assets used each year. As shown in Figure 2J, over 50 per cent of public hospitals in each cohort have a high-risk rating for this indicator.
Figure 2J
Capital replacement indicator at 30 June 2015
Note: The financial sustainability risk indicators are based on the consolidated financial statements of each public hospital, and include capital revenue.
Source: Victorian Auditor-General's Office.
This indicator considers spending on new assets, and the better result in the metro and regional cohorts reflects the higher capital funding DHHS has recently provided to these public hospitals to fund newer assets, such as the Victorian Comprehensive Cancer Centre—through the Peter MacCallum Cancer Institute—and Bendigo Hospital's new facilities being built through a public private partnership.
Internal financing
The internal financing indicator assesses the ability of public hospitals to set aside a portion of their revenue to fund the replacement or renewal of assets without external funds.
Figure 2K shows that more than 80 per cent of public hospitals received a high-risk rating for their internal financing ratio in each of the past five years. As public hospitals acquire new assets, the issue worsens as they seek to fund increasing maintenance costs.
Figure 2K
Internal financing indicator at 30 June
Note: The financial sustainability risk indicators are based on the consolidated financial statements of each public hospital, and include capital revenue.
Source: Victorian Auditor-General's Office.
The high longer-term risk indicates that public hospitals may experience challenges maintaining modern, fit-for-purpose facilities that they require to effectively and efficiently deliver their services. By not being able to fund their own asset renewal, public hospital boards cannot control their asset renewal priorities and may find that they are unable to provide the adequate level of services the Victorian public expects.
Recommendation
- That the Department of Health & Human Services reviews the public hospital funding model to provide sustainable operational funding to enable public hospitals to replace or acquire new assets as required.
3 Liquidity and cash management
At a glance
Background
This Part reviews seven public hospitals across the four cohorts to ascertain how they manage their liquidity and cash flow.
Conclusion
Five of the seven public hospitals made a net operating deficit in 2014–15. This contributed to cash shortfalls when they could not cover operational costs with operational revenue.
The review found some hospitals accessed restricted and/or foundation funds, requested financial assistance from the Department of Health & Human Services (DHHS), and/or delayed paying creditors in response to the cash shortages.
In all cases, the measures taken by the hospitals only address the symptom of the situation but do not resolve the long-term causes of risks to operational financial sustainability.
Findings
- DHHS provided a loan of $10 million to Alfred Health in 2013–14, and made a payment of $11.7 million in 2014–15 to Melbourne Health, to assist in resolving their immediate cash-flow issues. In both cases, this money was used to fund operations, and both entities continued to generate a net deficit from operations in 2014–15.
- Public hospitals, as disclosed in their financial statements, aim to settle debt in 30days in accordance with state government policy. Only one of the seven public hospitals achieved the 30-day target at 30 June 2015, and one other public hospital did not meet the DHHS 60-day benchmark.
Recommendation
That the Department of Health & Human Services reviews and sets a commercially accepted target for the terms of trade with creditors and debtors in line with state government policy.
3.1 Introduction
Under section 65S of the Health Services Act 1988 (the Act), the boards of public health services are required to develop plans to ensure the 'long-term financial viability of their public health service'. However, as detailed in Part 2, many public hospitals are facing short- and long-term financial sustainability risks, and have limited capacity to build up reserves to solve these issues.
Not all 87 public hospital are classified as public health services by the Act, however, section 65S is good practice and should be complied with by all public hospital boards.
This Part reviews seven public hospitals through case studies as a representation of the sector, and examines how hospitals manage liquidity and cash to meet their financial obligations.
3.2 Conclusion
Five of the seven public hospitals we reviewed made a net operating deficit in 2014–15. This contributed to instances where they had cash shortfalls when they could not cover operational costs with operational funds.
Some of the seven public hospitals accessed a combination of restricted and/or foundation funds, requested financial assistance from the Department of Health & Human Services (DHHS), and/or delayed paying creditors to respond to the cash-flow issue.
Our audit identified that the measures taken by the public hospitals only address the short-term symptom of situation, and do not resolve the long-term causes of risks to operational financial sustainability.
3.3 Case studies
The following representative public hospitals across the four cohorts were selected as case studies for this Part:
- metro public hospitals—Alfred Health, Melbourne Health and Peter MacCallum Cancer Institute (Peter MacCallum)
- regional public hospitals—Barwon Health
- rural public hospitals—Colac Area Health and East Grampians Health Service
- small rural public hospitals—Hepburn Health Service.
3.3.1 Financial results and sustainability
Financial results
The seven public hospitals selected as case studies collectively generated $3.2 billion in revenue for the 2014–15 financial year, and expended $3.2 billion, of which $181.3 million related to depreciation. The seven hospitals received $202.2 million in capital funding.
Figure 3A shows the key balances held by each of seven public hospitals at 30 June 2015.
Figure 3A
Key balances for public hospitals reviewed for the financial year ending 30 June 2015
|
Hospitals |
Net result |
Revenue excluding capital purpose income |
Expenditure |
Net result from operations |
Depreciation |
Net cash in (out) flows from operations |
|---|---|---|---|---|---|---|
|
Metro |
||||||
|
Alfred Health |
–30.59 |
982.87 |
1 045.43 |
–62.56 |
65.48 |
35.04 |
|
Melbourne Health |
–28.25 |
967.27 |
1 020.31 |
–53.05 |
48.09 |
15.59 |
|
Peter MacCallum |
91.17 |
361.18 |
352.80 |
8.38 |
18.96 |
103.63 |
|
Regional |
||||||
|
Barwon Health |
8.92 |
590.83 |
632.88 |
–42.05 |
40.95 |
42.63 |
|
Rural |
||||||
|
Colac Area Health |
–1.36 |
37.96 |
40.20 |
–2.24 |
3.01 |
0.88 |
|
East Grampians Health Service |
–1.70 |
31.64 |
34.12 |
–2.48 |
2.63 |
0.68 |
|
Small rural |
||||||
|
Hepburn Health Service |
–2.25 |
25.81 |
28.04 |
–2.23 |
2.22 |
–0.97 |
Note: Figures are for consolidated entities in line with analysis in Part 2.
Note: Comprehensive result includes capital revenue, and net result from operations excludes capital revenue.
Source: Victorian Auditor-General's Office.
Of the seven public hospitals, only Peter MacCallum generated a surplus from operations for the 2014–15 financial year. This was due to $45.2 million worth of donations—far greater than any of the other public hospitals. These donations have enabled Peter MacCallum to offset the shortfall from its operational revenue.
The higher comprehensive net result by Peter MacCallum includes $88.5 million in capital grant funding. This is funding towards the building of the Victorian Comprehensive Cancer Centre where it will relocate to in 2015–16. These funds are not available to meet the hospitals operating costs.
Consistent with Part 2 of this report, the metro public hospitals have generated the greater net deficit from operations. As discussed in Part 2, there is a correlation between the operating result and the level and type of services provided and the size of populations the public hospital caters for. For example, Alfred Hospital has a large emergency and trauma centre that services all of Victoria, and also offers more specialist and general services compared to smaller public hospitals.
Financial sustainability risk indicators
Figure 3B shows the financial sustainability risk indicator results for the seven public hospitals at 30 June 2015. The definitions and criteria for these indicators are shown in Appendix C.
Figure 3B
Financial sustainability risk indicators for the public hospitals reviewed at 30 June 2015
|
Hospital |
Financial sustainability risk ratios |
|||||
|---|---|---|---|---|---|---|
|
Net result |
Liquidity |
Cash days |
Capital replacement |
Internal financing |
||
|
Metro |
||||||
|
Alfred Health |
–3.01% |
0.30 |
0.81 |
0.60 |
–106% |
|
|
Melbourne Health |
–2.85% |
0.58 |
20.28 |
0.57 |
–81% |
|
|
Peter MacCallum |
20.54% |
1.87 |
47.97 |
7.35 |
–74% |
|
|
Regional |
||||||
|
Barwon Health |
1.39% |
0.40 |
6.72 |
1.92 |
–57% |
|
|
Rural |
||||||
|
Colac Area Health |
–3.50% |
0.29 |
2.46 |
0.46 |
–67% |
|
|
East Grampians Health Service |
–5.24% |
1.01 |
43.34 |
0.43 |
–66% |
|
|
Small rural |
||||||
|
Hepburn Health Service |
0.71% |
0.44 |
24.83 |
1.01 |
–164% |
|
Note: A red result means a high-risk assessment, a yellow result means a medium-risk assessment, and a green result means a low-risk assessment.
Source: Victorian Auditor-General's Office.
Consistent with the sector analysis discussed in Part 2, the public hospitals selected as case studies are showing both short- and long- term financial sustainability risks. In particular, five of the public hospitals have a high-risk rating for liquidity, and could not meet their current financial obligations with their current assets at 30 June 2015. Current financial obligations include trade creditors and current employee provisions.
All public hospitals have high long-term sustainability risks as there is insufficient capacity to self-fund asset replacement or renewal of assets. This is partly a consequence of the funding model, which provides these funds as one-off grants. The model does not provide specific funding for depreciation, which equates to the value of assets used during each financial year, and public hospitals have been unable to fund this expense through their operations, including fund raising activities.
Alfred Health and Colac Area Health are rated as having a higher risk of being financially unsustainable, with a high-risk result noted across four of the five indicators.
Peter MacCallum has the lowest financial sustainability risk indicator results. The net result is positive, however, this is a result of both the high level of donations the public hospital receives, and the current level of capital funding it received.
It should be noted that the days of available cash indicator excludes cash that is required to be held for a specific purpose—for example money that relates to accommodation bonds. However, public hospitals may have other restrictions on their cash reserves, such as conditional special purpose grants, monies that can only be used for capital projects and specific conditional bequests.
3.4 Liquidity and cash management
As detailed in Part 1, each public hospital agrees to a Statement of Priorities (SoP) with the Minister for Health prior to the start of each financial year. The SoP details the number and type of services the public hospital will deliver, and calculates the funding they will receive for operational purposes if they meet their agreed targets. Revenue is paid to the public hospital in 12-monthly instalments.
Figure 3A shows that six of the seven public hospitals did not achieve a net surplus from their operations in 2014–15. This means that these public hospitals have not received sufficient funds or generated sufficient revenue to cover their expenses—including depreciation—for the services that they have provided to the public during the financial year. A consequence of this is that these public hospitals could find themselves in a position where they do not have enough cash to cover their operations at any given point in time.
We have reviewed the liquidity and cash management policies and procedures at each of the seven public hospitals, which are discussed below. We have also provided examples of measures that have been taken in the hospitals to address immediate liquidity and cash issues.
3.4.1 Governance
Public hospital boards are required to ensure the long-term financial sustainability of their hospitals. However, as discussed in Part 2, a number of revenue and expenditure items—such as government grants and employee expenses—are outside of their control, which presents a big challenge to boards.
Public hospital boards should ensure that their hospitals have good cash management processes in place, and that they are able to pay their liabilities as and when they fall due. To achieve this, public hospitals should:
- have comprehensive cash and treasury management policies to enable cash to be available as and when it is required
- have cash management forecasting and monitoring processes, including appropriate reporting frameworks
- set a minimum liquidity ratio that the hospital should always operate to
- seek to generate more own-sourced income where possible to assist with the acquisition of new and replacement assets
- engage internal audit and other reviews of forecasting
- achieve their SoP targets—including breaking even on operations.
Board awareness
The boards of the public hospitals selected for the case study are given regular updates on cash balances and spending commitments at their board meetings.
The boards have delegated day-to-day responsibilities for the management of cash‑flow issues to management, and we found that cash-flows and liquidity positions are monitored at all seven public hospitals on a daily basis. Where issues have arisen, we noted that the board had been informed in a timely manner.
Figure 3C
Case study: board awareness
|
Melbourne Health Melbourne Health undertakes continuous cash forecasting that enables it to report on its future cash positions to the board on a monthly basis. In September 2014, these forecasts demonstrated that the hospital would have a significant shortfall at 30 June 2015. This was communicated to the board out of session. An updated review of Melbourne Health's cash flow in April 2015 indicated that a cash shortfall of $35.8 million was predicted at 30 June 2015, and proposed remedial actions to allow the hospital to continue to meet its obligations through delaying creditor payments and using restricted funds. The use of these measures was approved by the board and the Finance & Performance Committee. The situation was also discussed with DHHS which, following a review of Melbourne Health's financial situation, provided an additional advance funding of $11.7 million against their long service leave (LSL) liabilities. This amount was then spent on operating expenses in 2014–15. DHHS provides funding for all LSL liabilities for public hospitals as and when the LSL is taken by employees. By using this advance for alternative purposes/expenditure, the public hospital has resolved an immediate issue, but will face further problems in the future when the leave is actually taken by the employees if DHHS does not provide additional funding, or the public hospital cannot generate sufficient surpluses, to cover the advance received from DHHS. |
Source: Victorian Auditor-General's Office.
3.4.2 Managing cash shortfalls
The following methods were identified in our review of the seven public hospitals as ways in which public hospitals responded to a lack of available cash to meet their daily operational obligations.
Use of funds held for specific purposes
Some public hospitals have accessed funds earmarked for specific purposes to cover operational costs.
The monies for these funds are sometimes used by public hospitals to overcome a short-term cash-flow issue, as the specific purpose cash is held in bank accounts or short-term investments that can be accessed without incurring financial penalties associated with breaking a longer-term investment. The 'borrowed' amount can be/is then reimbursed once the next grant funding payment is received, or when a longer‑term investment matures.
Figure 3D
Case study: use of funds
|
Colac Area Health At 30 June 2015, Colac Area Health held $2.5 million in accommodation bonds. Accommodation bonds are restricted cash balances held by a public hospital that must only be used on the aged care facilities, and which must be returned to the resident—or their estate—when they leave care. In June 2015, Colac Area Health had utilised $0.6 million of its cash backed accommodation bonds to assist in meeting its creditor and payroll obligations. The money was paid back into the accommodation bond fund in July 2015 following receipt of government grant funding for 2015–16. This use of accommodation bonds for operational purposes was not in compliance with the Aged Care Act 1997. As noted in Figure 3I, Colac Area Health had to utilise these funds due to the non-payment of additional pre-approved funding by DHHS in the 2014–15 financial year. Melbourne Health Following the April 2015 cash-flow analysis, the board agreed to utilise restricted funds to enable the public hospital to overcome immediate cash-flow issues and to pay their creditors on time. The use of restricted funds for this purpose is temporary, and the fund is replenished when the next funding instalment is received. Melbourne Health expects to continue to access restricted funds for operational purposes for the foreseeable future if no additional funding is received to rectify cash-flow issues. |
Source: Victorian Auditor-General's Office.
Public hospitals are addressing their short-term liquidity issues by not using restricted funds for their intended purposes. However, they are failing to address the causes that have put them into that position. Further, in some cases, the use of restricted funds for unintended purposes could mean the public hospital has breached legislation governing the use of the fund, as shown for Colac Area Health in Figure 3D.
DHHS should work with public hospitals to make sure that the funding model will provide sustainable revenue to fund operations—thus reducing public hospitals cash‑flow issues—and to undertake a wider consultation to ensure a more sustainable financial framework.
Use of foundation donations
Two of the seven public hospitals received a combined $45.2 million in donations and bequests during the 2014–15 financial year, of which the majority was attributable to Peter MacCallum. In the prior year, three of the public hospitals received $40.98 million in donations and bequests.
At 30 June 2015, two of the public hospitals—including Peter MacCallum—maintain their foundations as separate entities, while others operate within the governance framework of the public hospital itself—such as Melbourne Health.
Our review found that all of the foundations have specific criteria on how donations can be spent by the public hospital, often only allowing them to fund capital items or to be made available for a specific use. Where a donation/bequest has been given for an intended purpose—for example, to purchase a piece of equipment, or to be used in a particular type of ward—the money should be spent as the donor instructs/wishes. Where there is no specific requirement, the board can decide and direct management on how the money is allocated or spent, which may include funding operations.
While the use of this donation funding is not a misuse of foundation funds, ideally operational revenue should cover operational expenditure without having to use donations to fund operations.
Figure 3E
Case study: use of donations
|
Melbourne Health Business units across the public hospital can apply for grants from Melbourne Health Foundation, with both unrestricted and specific purpose funding grants being awarded. In 2014–15, Melbourne Health Foundation made $4.42 million in disbursements through these funding streams, funding a mix of capital projects, research grants and other costs. Funding is awarded following an application process that considers the business cases for each funding request by a panel of executives, including the Director of the Foundation. Peter MacCallum The Peter MacCallum Foundation disbursed $14.4 million to various programs across the hospital in 2014–15. Of this, $8.9 million was awarded to unrestricted programs to fund research and operational expenditure, and a further $4.8 million was awarded as restricted funding. In total, $3.4 million went to capital projects. The funding is awarded following the assessment of business cases by the executive of the public hospital and the Peter MacCallum Foundation. |
Source: Victorian Auditor-General's Office.
Delaying creditor payments
At 30 June 2015, the seven public hospitals held $188.6 million worth of payables ($206.8 million at 30 June 2014), of which only 1.2 per cent related to items that were due after 12 months. The nature of the current creditors balance is detailed in Figure 3F.
Figure 3F
Composition of creditors due within 12 months at 30 June 2015
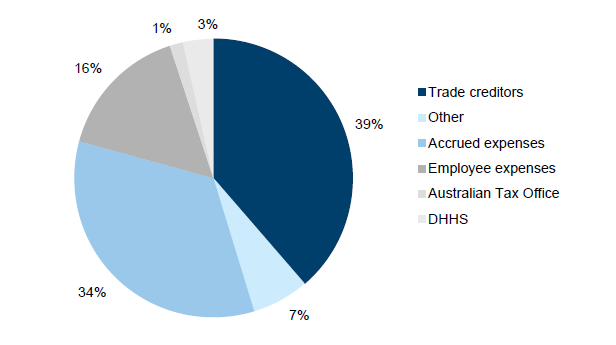
Source: Victorian Auditor-General's Office.
An analysis of the aggregated seven public hospitals showed that they could only fund 64.5 per cent of their current payables from available cash at 30 June 2015.
DHHS monitors public hospitals against a benchmark of paying creditors within 60 days. However, this is not in line with the state government's Fair Payment Policy, where financial obligations should be settled within 30 days. All seven public hospitals state in their financial statements that their usual credit terms are 30 days, and four cited compliance with the Fair Payment Policy. Figure 3G shows average creditor days ratio at 30 June 2015 for each of the seven public hospitals.
Figure 3G
Average creditor days ratio at 30 June 2015
|
Public hospital |
Creditor days |
Liquidity |
Creditor balance |
|---|---|---|---|
|
Metro |
|||
|
Alfred Health |
37 |
0.30 |
58.27 |
|
Melbourne Health |
57 |
0.58 |
73.23 |
|
Peter MacCallum |
58 |
1.87 |
26.70 |
|
Regional |
|||
|
Barwon Health |
36 |
0.40 |
31.94 |
|
Rural |
|||
|
Colac Area Health |
74 |
0.29 |
1.99 |
|
East Grampians Health Service |
26 |
1.01 |
0.61 |
|
Small rural |
|||
|
Hepburn Health Service |
37 |
0.44 |
0.82 |
Source: Victorian Auditor-General's Office from data provided by DHHS.
Only East Grampians Health Service achieved its own policy of paying creditors within 30 days based on this ratio. The remainder of the public hospitals exceeded 30 days, and Colac Area Health did not achieve the DHHS benchmark of 60 days.
The delayed payment of creditors is a technique used by public hospitals to assist in cash-flow management, as illustrated in Figure 3H.
Figure 3H
Case study: creditor payments
|
Melbourne Health At 30 June 2014, Melbourne Health delayed the payment of $15 million of creditors until receipt of the first payment of government funding for 2014–15, received in July 2014. At 30 June 2015, creditor payments were covered through accessing restricted cash and using the DHHS advance of LSL liabilities. |
Source: Victorian Auditor-General's Office.
Requesting assistance from DHHS
Our case studies found that requesting financial assistance from DHHS to help with cash-flow funding of operational costs is seen as a last resort. The public hospitals noted that additional funding is conditional on the achievement of new revised targets, or the money is made as a cash advance/loan and has to be repaid at a later date. In each circumstance, the public hospital is not tackling the cause of the issue but shifting the problem into the future.
Figure 3I
Case study: requesting assistance
|
Alfred Health In June 2014, Alfred Health received an interest free loan of $10 million from DHHS. This is to be repaid at $2.5million per year starting in June 2017. The decision to make these funds available followed agreement between DHHS and Alfred Health to undertake an independent review into cash management practices. The loan payment was used by Alfred Health to assist in funding operational expenses such as payroll and creditor payments. Colac Area Health In March 2015, Colac Area Health made a request to DHHS for $0.9 million of 2015–16 funding to be bought forward and paid to them in the 2014–15 financial year to assist with cash-flow issues. Despite approving the request, DHHS did not provide this additional funding to Colac Area Health. As noted in Figure 3D, to cover this shortfall in funding, Colac Area Health needed to use restricted funds in June 2015 to enable them to meet their payroll and creditor costs. Melbourne Health As noted in Figure 3C, Melbourne Health identified in April 2015 that a potential cash-flow shortfall of $35.8 million was forecast for 30 June 2015, and discussed the issues with DHHS. Following a review, DHHS provided Melbourne Health with additional funding of $11.7 million in April 2015, which was an advance against their LSL liabilities. This money was spent on public hospital operating expenses. Melbourne Health had also utilised restricted funds to enable them to meet the shortfall between the request and when cash advance were received, as discussed Figure 3C. |
Source: Victorian Auditor-General's Office.
3.4.3 Improving cash-flow management
Through our review of the seven public hospitals, we noted that there were two actions that were often not being actively undertaken to assist in improving a public hospital's cash position.
Outstanding debtors
At 30 June 2015, the seven public hospitals held $193.0 million in receivables, of which 74.7 per cent was classified as current in their financial statements ($177.1 million held at 30 June 2014, of which 72.4 per cent was current). Across the seven public hospitals, 9.1 per cent of non-statutory debtors ($11.8 million) were greater than 90 days old at 30 June 2015. The nature of the debtors balance is detailed in Figure 3J.
Figure 3J
Composition of debtors held by the seven public hospitals at 30 June 2015
Source: Victorian Auditor-General's Office.
DHHS monitors public hospitals against a benchmark of 60 days for the collection of debtor payments, and we noted that the public hospitals do not prioritise the recovering of outstanding debtor balances. The average debtor days ratio for the seven public hospitals at 30 June 2015 is detailed in Figure 3K. Alfred Health exceeds the DHHS benchmark for debtor collection, and only three public hospitals have a position of less than 30 days.
Figure 3K
Average debtor days ratio at 30 June 2015
|
Public hospital |
Debtor days |
Debtor balance |
Debtors older than 30 days |
|---|---|---|---|
|
Metro |
|||
|
Alfred Health |
64 |
45.35 |
18.09 |
|
Melbourne Health |
49 |
64.46 |
4.67 |
|
Peter MacCallum |
31 |
34.52 |
1.73 |
|
Regional |
|||
|
Barwon Health |
29 |
42.68 |
2.69 |
|
Rural |
|||
|
Colac Area Health |
43 |
2.06 |
0.14 |
|
East Grampians Health Service |
28 |
1.91 |
0.12 |
|
Small rural |
|||
|
Hepburn Health Service |
18 |
2.05 |
0.20 |
Source: Victorian Auditor-General's Office from data provided by DHHS.
Ideally, public hospitals should be proactively seeking to collect debts as and when they fall due. While public hospitals need to be sensitive to issues such as patient circumstances when collecting outstanding revenue, improving debt collection would increase the amount of available cash for public hospital immediate use.
Long-term investments
Five of the seven public hospitals held $153.6 million in investments at 30 June 2015. Colac Area Health and East Grampians Health Service did not hold any long-term investments at this date. Of these investments, 62.1 per cent were held in non-current financial instruments.
We did not find any instances where the seven public hospitals had accessed their longer-term investments prior to maturity to assist with their cash-flow issues. This is partly because to access these funds the public hospitals were likely to incur financial charges, and/or penalties in the form of lost interest. Additionally, longer-term investments are usually restricted funds.
Figure 3L
Case study: improving cash flow
|
Melbourne Health At 30 June 2015, Melbourne Health held $5.5 million in non-current investments. However, this represents shares held by the Melbourne Health Foundation. The public hospital is not able to use this money to fund operations as it is restricted to a specific purpose, and foundation monies can only be spent in accordance with criteria determined by the board. As noted in Figure 3E, an assessment process is applied to distributions from the Foundation. |
Source: Victorian Auditor-General's Office.
Public hospitals should make sure their investment strategies enable them to utilise these longer-term funds to generate additional income (interest revenue) to assist them in resolving their short-term cash-flow issues, while complying with Standing Direction 4.5.6 Treasury Risk Management, as detailed in Part 1, and having flexible investments that they can assess without being penalised.
Recommendations
- That the Department of Health & Human Services reviews and sets a commercially accepted target for the terms of trade with creditors and debtors in line with state government policy.
That public hospitals:
- review their debtor collection policy and processes, and follow up on debtors that are overdue
- use restricted funds only for their intended purpose.
Appendix A. Categorisation of hospitals
As detailed in Part 1, to assist with our analysis of the public health sector, the 87 consolidated public hospitals have been split into four cohorts, based on the definitions shown in Figure 1C.
Figure A1 lists the public hospitals that make up each category.
Figure A1
Public hospital categories
|
Hospital category |
|
|---|---|
|
Metro—18 public hospitals |
|
|
Alfred Health |
Peninsula Health |
|
Austin Health |
Peter MacCallum Cancer Centre |
|
Calvary Health Care Bethlehem Ltd(a) |
Queen Elizabeth Centre |
|
Dental Health Services Victoria |
Royal Children's Hospital |
|
Eastern Health |
Royal Eye and Ear Hospital |
|
Melbourne Health |
Royal Women's Hospital |
|
Mercy Public Hospital Inc(a) |
St Vincent's Hospital Melbourne Ltd(a) |
|
Monash Health |
Tweddle Child and Family Health Service |
|
Northern Health |
Western Health |
|
Regional—15 public hospitals |
|
|
Albury Wodonga Health |
Latrobe Regional Hospital |
|
Bairnsdale Regional Health Service |
Northeast Health Wangaratta |
|
Ballarat Health Services |
South West Healthcare |
|
Barwon Health |
Swan Hill District Health |
|
Bendigo Health Care Group |
West Gippsland Healthcare Group |
|
Central Gippsland Health Service |
Western District Health Service |
|
Echuca Regional Health |
Wimmera Health Care Group |
|
Goulburn Valley Health |
|
|
Rural—11 public hospitals |
|
|
Bass Coast Health |
Gippsland Southern Health Service |
|
Benalla Health |
Kyabram & District Health Service |
|
Castlemaine Health |
Maryborough District Health Service |
|
Colac Area Health |
Portland District Health |
|
Djeriwarrh Health Services |
Stawell Regional Health |
|
East Grampians Health Service |
|
|
Small rural—43 public hospitals |
|
|
Alexandra District Hospital |
Mallee Track Health & Community Service |
|
Alpine Health |
Mansfield District Hospital |
|
Beaufort & Skipton Health Service |
Moyne Health Service |
|
Beechworth Health Service |
Nathalia District Hospital |
|
Boort District Health |
Numurkah District Health Service |
|
Casterton Memorial Hospital |
Omeo District Hospital |
|
Cobram District Hospital |
Orbost Regional Health |
|
Cohuna District Health |
Otway Health |
|
Dunmunkle Health Services |
Robinvale District Health Services |
|
East Wimmera Health Service |
Rochester & Elmore District Health Service |
|
Edenhope & District Memorial Hospital |
Rural Northwest Health |
|
Heathcote Health |
Seymour District Memorial Hospital |
|
Hepburn Health Service |
South Gippsland Hospital |
|
Hesse Rural Health Service |
Tallangatta Health Service |
|
Heywood Rural Health |
Terang & Mortlake Health Service |
|
Inglewood & District Health Service |
Timboon & District Healthcare Service |
|
Kerang & District Health |
Upper Murray Health & Community Services |
|
Kilmore & District Health |
West Wimmera Health Service |
|
Kooweerup Regional Health Service |
Yarram & District Health Service |
|
Kyneton District Health Service |
Yarrawonga District Health Service |
|
Lorne Community Hospital |
Yea & District Memorial Hospital |
|
Maldon Hospital |
|
(a) Denominational hospital, as per Health Services Act 1988.
Source: Victorian Auditor-General's Office.
Figure A2 details the 19 controlled entities included in the consolidated public hospitals data.
Figure A2
Public hospital controlled entities
|
Public Hospital |
Controlled entity |
|---|---|
|
Metro—13 controlled entities |
|
|
Alfred Health |
Whole Time Medical Specialists |
|
Peter MacCallum Cancer Centre |
Peter MacCallum Cancer Foundation Peter MacCallum Cancer Foundation Limited Cell Therapies Pty Ltd Cellularity Pty Ltd |
|
Royal Children's Hospital |
Royal Children's Hospital Education Institute Limited The Royal Children's Hospital Foundation Trust Funds |
|
Royal Women's Hospital |
The Royal Women's Hospital Foundation Limited The Royal Women's Hospital Foundation Trust Funds |
|
Monash Health |
Kitaya Holdings Pty Ltd |
|
Northern Health |
Northern Health Research, Training and Equipment Foundation Northern Health Research, Training and Equipment Trust |
|
Western Health |
Western Health Foundation Limited |
|
Rural—three controlled entities |
|
|
East Grampians Health Service |
East Grampians Health Building for the Future Foundation |
|
Portland District Health |
Active Health Portland |
|
Stawell Regional Health |
Stawell Regional Health Foundation |
|
Small rural—three controlled entities |
|
|
Beaufort & Skipton Health Service |
Beaufort and Skipton Health Service Foundation Limited |
|
Cohuna District Health |
Cohuna Community Nursing Home Inc |
|
Hesse Rural Health Service |
The Winchelsea Hostel and Nursing Home Society |
Source: Victorian Auditor-General's Office.
Appendix B. Management letter risk ratings
Figure B1 shows the risk ratings applied to management letter points raised during an audit review.
Figure B1
Risk definitions applied to issues reported in audit management letters
|
Rating |
Definition |
Management action required |
|---|---|---|
|
Extreme |
The issue represents:
|
Requires immediate management intervention with a detailed action plan to be implemented within one month. Requires executive management to correct the material misstatement in the financial report as a matter of urgency to avoid a qualified audit opinion. |
|
High |
The issue represents:
|
Requires prompt management intervention with a detailed action plan implemented within two months. Requires executive management to correct the material misstatement in the financial report to avoid a qualified audit opinion. |
|
Medium |
The issue represents:
|
Requires management intervention with a detailed action plan implemented within three to six months. |
|
Low |
The issue represents:
|
Requires management intervention with a detailed action plan implemented within six to 12 months. |
Source: Victorian Auditor-General's Office.
Appendix C. Financial sustainability risk indicators
Figure C1 shows the indicators used in assessing the financial sustainability risks of public hospitals in Part 2 of this report. These indicators should be considered collectively, and are more useful when assessed over time as part of a trend analysis.
Figure C1
Financial sustainability risk indicators
|
Indicator |
Formula |
Description |
|---|---|---|
|
Net result (%) |
Net result / Total revenue |
A positive result indicates a surplus, and the larger the percentage, the stronger the result. A negative result indicates a deficit. Operating deficits cannot be sustained in the long term. Net result and total revenue is obtained from the comprehensive operating statement. |
|
Liquidity (ratio) |
Current assets / Current liabilities |
This measures the ability to pay existing liabilities in the next 12 months. A ratio of one or more means there are more cash and liquid assets than short-term liabilities. |
|
Average number of cash days available (ratio) |
Unrestricted cash / (Total annual operating cash outflows / 365 days) |
This measures the number of days of operating expenses that a hospital could pay with its current available cash. Unrestricted cash available includes cash equivalents that can be easily converted to cash and excludes cash held where the use has been restricted—such as accommodation care bonds. |
|
Capital replacement (ratio) |
Cash outflows for property, plant and equipment / Depreciation |
Comparison of the rate of spending on infrastructure with its depreciation. Ratios higher than 1:1 indicate that spending is faster than the depreciating rate. This is a long-term indicator, as capital expenditure can be deferred in the short term if there are insufficient funds available from operations, and borrowing is not an option. Cash outflows for infrastructure are taken from the cash flow statement. Depreciation is taken from the comprehensive operating statement. |
|
Internal financing (%) |
Net operating cash flow / Net capital expenditure |
This measures the ability of an entity to finance capital works from generated cash flow. The higher the percentage, the greater the ability for the entity to finance capital works from their own funds. Net operating cash flows and net capital expenditure are obtained from the cash flow statement. |
Source: Victorian Auditor-General's Office.
The analysis of financial sustainability risk in this report reflects on the position of each consolidated public hospital.
Financial sustainability risk assessment criteria
The financial sustainability risk of each public hospital has been assessed using the criteria outlined in Figure C2.
Figure C2
Financial sustainability risk indicators – risk assessment criteria
|
Risk |
Net result |
Liquidity |
Average number of cash days available |
Capital replacement |
Internal financing |
|---|---|---|---|---|---|
|
High |
Negative 10% or less |
Less than 0.75 |
Less than 7 days |
Less than 1.0 |
Less than 10% |
|
Insufficient revenue is being generated to fund operations and asset renewal. |
Immediate sustainability issues with insufficient current assets to cover liabilities. |
Insufficient cash held to fund operations. |
Spending on capital works has not kept pace with consumption of assets. |
Limited cash generated from operations to fund new assets and asset renewal. |
|
|
Medium |
Negative 10%–0% |
0.75–1.0 |
7–30 days |
1.0–1.5 |
10–35% |
|
A risk of long‑term run down to cash reserves and inability to fund asset renewals. |
Need for caution with cash flow, as issues could arise with meeting obligations as they fall due. |
May indicate insufficient cash available to fund operations. |
May indicate spending on asset renewal is insufficient. |
May not be generating sufficient cash from operations to fund new assets. |
|
|
Low |
More than 0% |
More than 1.0 |
More than 30 days |
More than 1.5 |
More than 35% |
|
Generating surpluses consistently. |
No immediate issues with repaying short‑term liabilities as they fall due. |
Low risk of insufficient cash available to fund operations. |
Low risk of insufficient spending on asset renewal. |
Generating enough cash from operations to fund new assets. |
Source: Victorian Auditor-General's Office.
Changes to prior year reports
The financial sustainability risk indicators used in this report have changed slightly from prior years. The changes are detailed below:
- the results have been calculated based on the consolidated public hospital entity, rather than the parent public hospital financial information alone
- the indicators have been calculated from the information in the published financial statements for the entity, with no adjustments made to these figures
- the net result indicator has replaced the previous underlying result indicator
- the internal financing indicator has replaced the previous self-financing indicator.
Appendix D. Glossary
Accountability
Responsibility on public sector entities to achieve their objectives, with regard to reliability of financial reporting, effectiveness and efficiency of operations, compliance with applicable laws, and reporting to interested parties.
Activity-based funding
Method of funding allocation based on unit prices for each activity undertaken, and the number of that activity to be performed by an entity.
Acute admitted services
Services performed by hospitals in which the intent is to perform surgery, diagnostic or therapeutic procedures in the treatment of illness or injury.
Asset
A resource controlled by an entity as a result of past events, and from which future economic benefits are expected to flow to the entity.
Audit Act 1994
The Audit Act 1994 establishes the operating powers and responsibilities of the Auditor-General. This includes the operations of his office—the Victorian Auditor‑General's Office (VAGO) as well as the nature and scope of audits conducted by VAGO.
Auditor's opinion
Written expression within a specified framework indicating the auditor's overall conclusion on the financial—and performance—reports based on audit evidence obtained.
Block funding
A system of funding public hospital functions and services as a fixed amount based on population and previous funding.
Capital expenditure
Amount capitalised to the balance sheet for contributions by a public sector entity to major assets owned by the entity, including expenditure on:
- capital renewal of existing assets that returns the service potential or the life of these assets
- expenditure on new assets, including buildings, infrastructure, plant and equipment.
Capital grant / capital purpose income
Government funding given to an agency for the purpose of acquisition or building of capital assets such as buildings, land or equipment.
Clear audit opinion
A positive written expression provided when the financial report has been prepared and presents fairly the transactions and balances for the reporting period in accordance with the requirements of the relevant legislation and Australian Accounting Standards.
Also referred to as an unqualified audit opinion.
Comprehensive net result
The net result is calculated by subtracting an entity's total expenses from the total revenue, to show what the entity has earned or lost in a given period of time.
Deficit
Total expenditure exceeds total revenue resulting in a loss.
Depreciation
The systematic allocation of the value of an asset over its expected useful life.
Emergency care
Procedures dedicated to the diagnosis and treatment of unforeseen illness or injury.
Emphasis of matter
A paragraph included in an auditor's report to which draws the users of the financial reports' attention to a particular note or disclosure which, in the auditor's opinion, is fundamental to the user's understanding of the financial report.
Entity
Is a body whether corporate or unincorporated that has a public function to exercise on behalf of the state or is wholly owned by the state, including departments, statutory authorities, statutory corporations and government business enterprises.
Equity or net assets
Residual interest in the assets of an entity after deduction of its liabilities.
Expense
Outflows or other depletions of economic benefits in the form of incurrence of liabilities or depletion of assets of the entity, other than those relating to contributions by owners, that results in a decrease in equity during the reporting period.
Financial Management Act 1994
An Act of the State of Victoria that establishes the financial administration and accountability of the public sector, as well as annual reporting to the Parliament by all departments and public sector entities.
Financial report
Structured representation of the financial information, which usually includes accompanying notes, derived from accounting records and intended to communicate an entity's economic resources or obligations at a point in time, or the changes therein for a period in accordance with a financial reporting framework.
Financial sustainability
An entity's ability to manage financial resources so it can meet spending commitments, both at present and into the future.
Going concern
An entity which is expected to be able to pay its debts as and when they fall due, and continue in operation without any intention or necessity to liquidate or otherwise wind up its operations.
Governance
The control arrangements in place that are used to govern and monitor and entity's activities in order to achieve its strategic and operational goals
Impairment
The amount by which the value of an asset held by an entity exceeds its recoverable amount.
Internal control
Internal control is a means by which an entity's resources are directed, monitored and measured. It plays an important role in preventing and detecting error and fraud and protecting the entity's resources.
Investment
The expenditure of funds intended to result in medium- to long-term service and/or financial benefits arising from the development and/or use of infrastructure assets by either the public or private sectors.
Liability
A present obligation of the entity arising from past events, the settlement of which is expected to result in an outflow from the entity of resources embodying economic benefits.
Management letter
A letter issued by the auditor to the governing body, the audit committee and management of an entity outlining weaknesses in controls and other issues identified during the financial audit.
Material error or adjustment
An error that may result in the omission or misstatement of information, which could influence the economic decision of users taken on the basis of the financial statements. Materiality depends on the size and nature of the omission or misstatement judged in the surrounding circumstances.
Materiality
Information is material if its omission or misstatement could influence the economic decisions of users taken on the basis of the financial report. Materiality depends on the size or nature of the item or error judged in the particular circumstances of its omission or misstatement.
Modified audit opinion
A qualified or disclaimed audit opinion issued when the auditor cannot be satisfied that the financial report is not free from material misstatement.
National Health Reform Agreement
An agreement entered into by all states, territories and the Commonwealth in August 2011 outlining the funding, governance and performance arrangements for the delivery of public hospital services in Australia.
National Weighted Activity Units
Unit prices set by the Commonwealth Government as the basis for calculating activity based funding paid to public hospitals.
Net result from operations
The net result is calculated by subtracting an entity's total expenses from the total revenue, to show what the entity has earned or lost in a given period of time. The operational net result excludes capital income and expenditure items—but not depreciation expenses.
Non-admitted care
Procedures undertaken where the patient is not admitted to the hospital, for example day-surgery.
Qualified audit opinion
A qualification is issued when the auditor concludes that an unqualified opinion cannot be expressed due to one of the following reasons:
- disagreement with those charged with governance
- conflict between applicable financial reporting frameworks
- limitation of scope.
Revenue
Inflows of funds or other enhancements or savings in outflows of service potential, or future economic benefits in the form of increases in assets or reductions in liabilities of the entity, other than those relating to contributions by owners which result in an increase in equity during the reporting period.
Risk
The chance of a negative impact on the objectives, outputs or outcomes of the entity.
Standing direction
They support the Financial Management Act 1994 by specifying matters that must be complied with by government departments and public bodies to:
- implement and maintain appropriate financial management practices
- achieve a consistent standard of accountability and financial reporting.
Specific purpose funds / specific purpose grants
Grant funding provided by the Commonwealth to the state government for a particular area or service.
Statement of priorities (SoP)
Key accountability agreements between Victorian public health services and the Minister for Health. The annual agreements facilitate delivery of or substantial progress towards the key shared objectives of financial viability, improved access and quality of service provision. SoP include funding and targets confirmed at the time of signing.
Sub-acute admitted care
Specialised multidisciplinary care in which the primary need for care is optimisation of the patient's functioning and quality of life.
Weighted Inlier Equivalent Separation
Unit prices set by the Victorian State Government as the basis for calculating activity based funding paid to public hospitals.
Appendix E. Audit Act 1994 section 16—submissions and comments
Introduction
In accordance with section 16(3) of the Audit Act 1994, a copy of this report, or relevant extracts from the report, was provided to the Department of Health & Human Services and named public hospitals with a request for submissions or comments.
The submissions and comments provided are not subject to audit nor the evidentiary standards required to reach an audit conclusion. Responsibility for the accuracy, fairness and balance of those comments rests solely with the agency head.
Responses were received as follows:
Further audit comment:
RESPONSE provided by the Acting Secretary, Department of Health & Human Services
Acting Auditor-General's response to the Acting Secretary of Department of Health & Human Services
The Acting Secretary does not agree with my report's adoption of the net results from operations, which excludes capital revenue but includes depreciation costs. The department instead places emphasis on the financial result excluding capital revenue and depreciation.
My report comments on both the comprehensive net result of public hospitals—which includes all revenue and expenditure—and the net result from operations (excluding capital revenue). The net result from operations demonstrates that public hospitals are unable to generate sufficient revenue to cover their depreciation costs and therefore are unable to fund the renewal and replacement of their assets. My report also highlights that capital revenue funding may not be awarded evenly across all public hospital cohorts and the department has a finite amount of funds to distribute each year. Consequently many public hospitals have a high-risk financial sustainability rating for their capital replacement and internal financing indicators. These financial sustainability indicators take into account capital revenue received by public hospitals. The department's emphasis on the financial result excluding capital revenue and depreciation does not address these longer-term financial sustainability risks, which could ultimately impact the quality and variety of services provided by public hospitals.
This report recommends that the department reviews the public hospital funding model to provide sustainable operational funding to enable public hospitals to replace or acquire new assets as required. It is disappointing that the Acting Secretary does not support this recommendation.
Similarly, it is also disappointing that the Acting Secretary only supports in principle, subject to consideration of funding issues, this report's recommendation of setting a commercially accepted target for the terms of trade with creditors and debtors in line with the state government's own policy.
RESPONSE provided by the Executive Director Finance and Logistics, Melbourne Health
RESPONSE provided by the Chief Executive, Alfred Health
RESPONSE provided by the Chief Executive Officer, Colac Area Health