Public Hospitals: Results of the 2012–13 Audits
Overview
This report covers the results of the financial audits of 112 entities within the public hospital sector, comprising 87 public hospitals and the 25 entities they control. It informs Parliament about significant issues arising from the 2012–13 financial audits and complements the assurance provided through audit opinions included in the entities’ annual reports.
The report also looks at public hospital financial results, financial sustainability and targeted areas of internal controls related to public hospital risk management frameworks and private patient revenue.
Public Hospitals: Results of the 2012–13 Audits: Message
Ordered to be printed
VICTORIAN GOVERNMENT PRINTER March 2013
PP No 282, Session 2010–13
President
Legislative Council
Parliament House
Melbourne
Speaker
Legislative Assembly
Parliament House
Melbourne
Dear Presiding Officers
Under the provisions of section 16AB of the Audit Act 1994, I transmit my report on Public Hospitals: Results of the 2012–13 Audits.
This report summarises the results of the financial audits of 87 Victorian public hospitals and their 25 associated entities at 30 June 2013.
It informs Parliament about significant issues identified during our audits and complements the assurance provided through individual audit opinions included in the entities' annual reports.
The report again highlights the impact of the funding model on the ability of hospitals to fund long-term debt and capital replacement. Coupled with low cash holdings, some public hospitals continue to rely upon the Department of Health to support them. To this end, 28 public hospitals required letters of support from the Department at 30 June 2013, in order to continue to operate as going concerns.
Yours faithfully

John Doyle Auditor-General
28 November 2013
Audit summary
The Victorian public hospital sector consists of 112 entities—comprising 87 public hospitals and 25 associated entities. The 112 entities provide a range of public health services across metropolitan, regional and rural Victoria.
This report summarises the results of the financial audits of the 112 entities and also provides an analysis of public hospital financial reporting, financial results, financial sustainability and internal controls relevant to the preparation of their financial reports. It informs Parliament about significant issues identified during our audits and complements the assurance provided through the individual audit opinions included in the entities' annual reports.
Conclusion
Parliament can have confidence in the 2012–13 financial reports of public hospitals and their associated entities. Clear audit opinions were issued on all financial reports for 2012–13, meaning that the financial reports of the audited entities can be relied on by Parliament and the public in relation to the results of the entities' operations and their assets and liabilities as at 30 June 2013.
Public hospital sustainability
Approximately 88 per cent of public hospital revenue comes from Commonwealth and state funding tied to the delivery of health care. The remaining revenue is self-generated and is typically derived from additional services such as pharmacy sales, cafeteria sales, diagnostic imaging, private practice fees, car park fees and income on investments.
The Department of Health does not provide public hospitals with direct funding to cover the depreciation of their assets and so the funding model continues to have a direct and significant impact on the financial sustainability of hospitals. The ability of governing bodies and management to make decisions to renew and replace assets is limited because they do not generate sufficient revenue from their own operations to fund such decisions.
Public hospitals built and delivered through public private partnership (PPP) arrangements have maintenance requirements and asset quality standards written into contracts with the private sector providers. As a result the maintenance of the assets is managed throughout the operating period of the PPP and the asset is required to be returned to the state at the end of the period, in an agreed condition.
Across the sector, the average self-financing ratio was assessed as low in 2012–13, highlighting the sector's ongoing reliance on government funding to maintain service levels and to maintain and replace assets. Consequently, more spending may be required over the long term to replace ageing public hospital assets. This poses a risk to the sector's ability to keep up with the increasing demand for health services while maintaining assets.
Under the current funding model, public hospitals hold very low cash reserves and have limited ability to fund long-term debt and capital replacement. The cash holdings at 23 public hospitals was less than seven days at 30 June 2013. This means that these hospitals could only continue to operate for a week if there was a delay in providing their next funding instalment. These cash levels risk the ability of these hospitals to respond in the event of unexpected costs.
As at 30 June 2013, 28 public hospitals (31 in 2011–12) relied on a 'letter of support' from the Department of Health committing to provide sufficient cash flows to them to meet their obligations if required.
Private patient revenue
Private patients provide a source of revenue for public hospitals independent of government funding. Eighty-two of the 87 public hospitals generated revenue from this source in 2012–13. Private patient revenue collected in 2012–13 amounted to more than $719 million, up from $611 million collected in 2011–12.
Most public hospitals had private patient revenue policies or revenue policies covering the generation, collection and recording of these fees. We observed that practices employed by public hospitals generally aligned with their policies and were supported by strong monitoring controls. Half of the public hospitals that collected private patient revenue had engaged internal auditors to review the activity within the past three years.
Risk management at public hospitals
To effectively manage risk, management and governing boards should identify risks, then design and implement mitigation strategies. All public hospitals had risk management frameworks, however, they could be improved by:
- reviewing risk management policies annually so that they are current
- embedding risk into the business and strategic plans of public hospitals
- explicitly providing a role for the audit committee in the oversight of risk management, by articulating responsibilities in the audit committee charter.
Many public hospitals relied on outsourced providers for critical financial functions, including payroll, information technology services and accounts payable functions. However, not all had sought and obtained assurance about their providers' risk management practices in order to act to mitigate any related risk exposure.
The public hospitals could also improve their risk management by regularly engaging their governing boards and audit committees in reviewing risk policies and documents and by reporting critical or extreme risks to them, as well as engaging internal auditors to review practices.
Recommendations
Recommendations have been made throughout this report. These recommendations are outlined below.
That public hospitals:
- adjust all errors identified during audits so that their financial statements are of the highest possible quality
- review their financial reporting processes to address the better practice report preparation elements, including the timely preparation of shell financial statements
- review their risk management frameworks and policies, at least annually
- report on 'critical' or 'extreme' risks and associated mitigation strategies to their board or audit committee, at least quarterly
- use internal audit to review practices in relation to private patient revenue and compliance with established policies.
Submissions and comments received
In addition to progressive engagement during the course of the audit, in accordance with section 16(3) of the Audit Act 1994 a copy of this report, or relevant extracts from the report, was provided to the Department of Health and named agencies with a request for submissions or comments.
Agency views have been considered in reaching our audit conclusions and are represented to the extent relevant and warranted in preparing this report. Their full section 16(3) submissions and comments are included in Appendix F.
1 Background
1.1 Introduction
Public hospitals provide a range of services across metropolitan, regional and rural areas. Metropolitan and regional public hospitals typically provide acute health services, as well as a mix of mental health, subacute, community health and aged care services. Rural public hospitals generally offer a higher proportion of aged care and community health services.
This report provides the results of the financial audits of 112 entities, comprising 87 public hospitals and their 25 associated entities, and is one of a suite of Parliamentary reports on the results of the 2012–13 financial audits conducted by VAGO. The full list of reports can be found in Appendix A of this report.
A breakdown of the 112 entities commented on in this report is set out in Figure 1A.
Figure 1A
Public hospitals and controlled entities
|
Hospital category |
2012 |
2013 |
|---|---|---|
Metropolitan | ||
Public hospitals |
18 |
18 |
Entities controlled by public hospitals(a) |
16 |
15 |
Other associated entities(b) |
2 |
2 |
Regional | ||
Public hospitals |
15 |
15 |
Entities controlled by public hospitals(a) |
2 |
2 |
Rural | ||
Public hospitals |
54 |
54 |
Entities controlled by public hospitals(a) |
5 |
5 |
Other associated entities(b) |
1 |
1 |
Total |
113 |
112 |
(a) Entities
controlled by public hospitals generally comprise foundations and trusts.
Subsequent to the 2011–12 audits, the control arrangements for one entity were
reassessed and it was determined that the entity was no longer controlled by
the related public hospital. The entity has therefore been excluded from the
2012–13 report.
(b) Other
associated entities are not directly controlled by a public hospital and
generally comprise joint ventures or unrelated not-for-profit entities.
Source: Victorian
Auditor-General's Office.
The names of all the entities, within the public hospital sector, audited by VAGO appear in Appendix B.
1.2 Structure of this report
This report informs Parliament about issues arising from the audits of the Victorian public hospital sector, and adds to the assurance provided through audit opinions on the financial statements included in the respective entities' annual reports.
The structure of this report and details covered in each Part are set out in Figure 1B.
Figure 1B
Report structure
|
Part |
Description |
|---|---|
Part 2: Audit opinions and quality of reporting at public hospitals |
Covers the results of the audits of the 2012–13 financial reports of the 87 public hospitals and their 25 associated entities. It comments on the quality of financial reporting against better practice, and timeliness against legislated time lines. |
Part 3: Financial sustainability |
Summarises and analyses the financial results of 87 public hospitals, including financial performance for 2012–13. Also provides insight into the financial sustainability of the 87 public hospitals, based on the trends of five financial sustainability indicators over a five-year period. |
Part 4: Internal controls at public hospitals |
Assesses the sector's general internal controls and control procedures over private patient revenue and the adequacy of risk management frameworks. |
1.3 Audit of financial reports
An annual financial audit has two aims:
- to give an opinion consistent with section 9 of the Audit Act 1994, on whether the financial report is fairly stated
- to consider whether there has been wastage of public resources or a lack of probity or financial prudence in the management or application of public resources, consistent with section 3A(2) of the Audit Act 1994.
The framework applied in conducting our financial audits is set out in Figure 1C.
Figure 1C
Financial framework
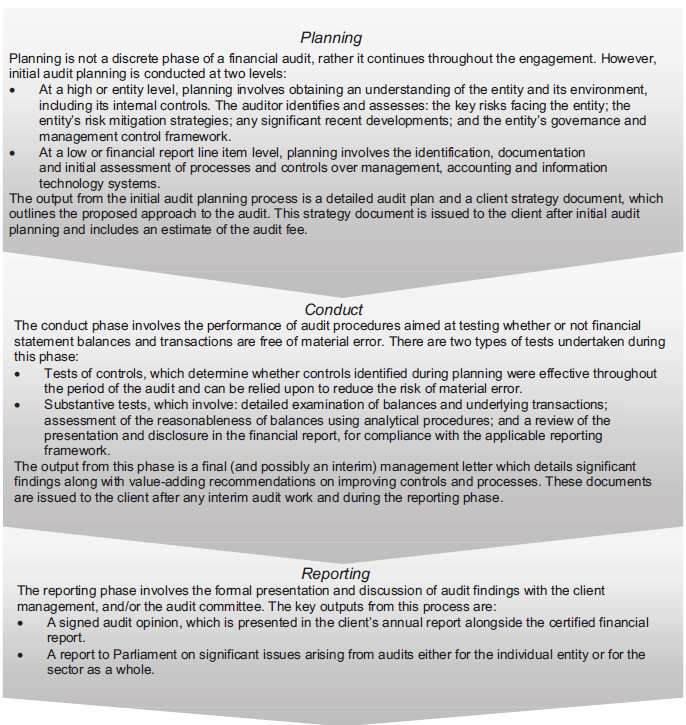
Source: Victorian Auditor-General's Office.
1.3.1 Audit of internal controls relevant to the preparation of the financial report
Integral to the annual financial audit is an assessment of the adequacy of the internal control framework, and the governance processes, related to an entity's financial reporting. In making this assessment, consideration is given to the internal controls relevant to the entity's preparation and fair presentation of the financial report, but this assessment is not used for the purpose of expressing an opinion on the effectiveness of the entity's internal control.
Internal controls are systems, policies and procedures that help an entity reliably and cost effectively meet its objectives. Sound internal controls enable the delivery of reliable, accurate and timely internal and external reporting.
An explanation of the internal control framework, and its main components, is set out in Appendix C. An entity's governing body is responsible for developing and maintaining its internal control framework.
Internal control weaknesses we identify during an audit do not usually result in a 'qualified' audit opinion because often an entity will have compensating controls in place that mitigate the risk of a material error in the financial report. A qualification is warranted only if weaknesses cause significant uncertainty about the accuracy, completeness and reliability of the financial information being reported.
Weaknesses in internal controls found during the audit of an entity are reported to its chief executive officer and audit committee in a management letter.
Our reports to Parliament raise systemic or common weaknesses identified during our assessments of internal controls over financial reporting, across a sector.
1.4 Public hospital funding framework
During 2012–13, reforms to National Health funding arrangements came into operation. The National Health Reform Agreement was introduced to give greater control for funding of public hospitals to the Commonwealth Government. The implementation of a nationally consistent approach to funding acute admitted services, emergency department services and non-admitted patient services began on 1 July 2012, and for the remaining non-admitted services, mental health and subacute services, on 1 July 2013. The funding basis is referred to as Activity Based Funding (ABF).
ABF involves the setting of a unit price for each type of medical or clinical activity, and agreeing on the quantity of units to be provided by the hospital. This forms the basis for calculating the funding to be provided under the health services agreement between the hospital and Minister for Health.
Block funding continues to be provided where appropriate, and is also set out in an annual health services agreement. Block funding is provided to public hospitals when it is not technically possible to use ABF, or where there is an absence of economies of scale that mean some services would not be financially viable under ABF.
The National Health Funding Pool
Under the new arrangements, state and territory governments remain responsible for the performance of public hospitals in their jurisdictions. However, Commonwealth and state ABF monies as well as Commonwealth block funding are now paid into a pool bank account established for each state or territory. The Victorian bank account is known as the National Health Funding Pool—Victorian State Pool Account. Each state's pool account is to be managed by an independent administrator. An administrator is required for the Commonwealth, and for each of the states and territories.
At the time of preparing this report an administrator for Victoria had not been appointed. The Victorian Minister for Health has temporarily granted authority to the Chief Finance Officer of the Department of Health (DH) to make payments out of the Victorian pool account to Victorian hospitals.
ABF payments are made directly from the Pool to hospitals, circumventing the previous role of state and territory health departments. Payments can only be made from the Pool following instruction from the relevant state or territory health minister.
Commonwealth block funding is paid from the Victorian pool account to the State Managed Fund (managed by DH) and then passed on to hospitals. State block funding is paid by DH directly to hospitals and therefore does not go through the Pool.
The Commonwealth administrator oversees the payments, maintains the associated records and prepares annual financial statements for each state and territory pool, for auditing and reporting to the Parliament of the related jurisdiction.
The Victorian Auditor-General is responsible for the audit of the financial statements of the National Health Funding Pool—Victorian State Pool Account. However, as the Pool does not form part of the operations of the public hospital sector its financial results are not included in this report.
1.5 Conduct of public hospital financial audits
The audits of the 87 Victorian public hospitals and their 25 associated entities were undertaken in accordance with Australian Auditing Standards.
Pursuant to section 20(3) of the Audit Act 1994, unless otherwise indicated, any persons named in this report are not the subject of adverse comment or opinion.
The total cost of preparing and printing this report was $205 000.
2 Audit opinions and quality of reporting at public hospitals
At a glance
Background
This Part covers the results of the 2012–13 audits of the 87 public hospitals and their 25 associated entities. It also compares financial reporting practices in 2012–13 against better practice.
Findings
- Parliament can have confidence in the financial reports of public hospitals as all financial reports were given unqualified audit opinions.
- The time taken to finalise public hospital financial reports increased in 2012–13 due in part to the new state funding pool arrangements, however the audits of all public hospitals were completed within legislated time lines. The audits of two associated entities were not completed within the legislated time lines, but were completed by 31 October.
- Financial report preparation by public hospitals can be improved with the preparation of shell financial reports. These enable the early identification and resolution of financial reporting issues, thereby reducing the risk of delays and any associated additional costs.
Recommendations
That public hospitals:
- adjust all errors identified during audits so that their financial statements are of the highest possible quality
- review their financial reporting processes to address the better practice report preparation elements, including the timely preparation of shell financial statements.
2.1 Introduction
This Part covers the results of the audits of the 2012–13 financial statements of public hospitals and their associated entities.
2.2 Audit opinions issued
Independent audit opinions add credibility to financial reports by providing reasonable assurance that the information reported is reliable and accurate. An 'unqualified' or 'clear' audit opinion confirms that the financial statements present fairly the transactions and balances for the reporting period, in accordance with the requirements of relevant accounting standards and legislation.
A 'qualified' audit opinion means that the financial report is materially different to the requirements of the relevant reporting framework or accounting standards, and is less reliable and useful as an accountability document.
For 2012–13, unqualified audit opinions were issued on the financial statements of all 112 public hospitals and associated entities. This positive result is consistent with 2011–12 when all 113 public hospitals and associated entities received unqualified audit opinions.
In certain circumstances an audit opinion may draw attention to, or emphasise, a matter relevant to the users of an entity's financial report but does not warrant a qualification. No public hospitals' audit opinion included an emphasis of matter paragraph for 2012–13. One associated entity's opinion contained an emphasis of matter paragraph in relation to the winding up of the business. This was adequately disclosed within the financial statements.
2.3 Quality of individual hospital financial reporting
The quality of an entity's financial reporting can be measured in part by the timeliness and accuracy of the preparation and finalisation of its financial report, as well as against better practice criteria.
2.3.1 Accuracy
The frequency and value of errors in financial statements are direct measures of the quality of the draft financial statements submitted for audit. Ideally, there should be no errors or adjustments required as a result of an audit.
Our expectation is that all entities will adjust any errors identified during an audit, other than those errors that are clearly trivial or clearly inconsequential to the financial report, as defined under the auditing standards.
The public is entitled to expect that any financial statements that bear the Auditor‑General's opinion are accurate and of the highest possible quality. Therefore all errors identified during an audit should be adjusted, other than those that are clearly trivial.
Material adjustments
Material errors need to be corrected before an unqualified audit opinion can be issued and while all material errors were adjusted prior to the completion of the financial reports, 81 material adjustments were made during the 2012–13 audits. This compares to 129 in 2011–12. Rural hospitals continue to account for half (53 per cent) of the material adjustments each year.
The nature of material adjustments identified during the 2012–13 audits were:
- financial instrument disclosures—incomplete or incorrect adjustments to financial instrument disclosures
- financial statement and accounting policy disclosures—adjustments to financial statements to bring disclosures into line with the sector's model financial report, and adjustments to accounting policy disclosures to reflect the individual public hospital's actual situation
- revenue/receivables—adjustments to the revenue recognised where entities had either incorrectly classified revenue items or had accounted for revenue in the wrong year
- cash and investments—reclassification of cash balances to investments for deposits held with maturity terms in excess of 90 days.
Adjustment of other misstatements
Other errors should also be corrected before the audit opinion is signed. While some errors may appear immaterial in isolation, in aggregate, a series of small errors may have a significant impact on an entity's financial statements or an entity's operating result.
During the 2012–13 audits, a number of misstatements clearly above trivial thresholds were identified. Most were subsequently adjusted in entities' financial statements. However, some were not adjusted because either they were identified too late in the audit, or could not be processed in a timely manner without raising the risk of creating further errors. In these instances the misstatement was raised with management and will be rectified during 2013–14.
2.3.2 Timeliness
Timely financial reporting is key to providing accountability to stakeholders and enables informed decision-making. The later reports are produced and published after year end, the less useful they are.
Public hospitals are required to finalise their audited financial reports within 12 weeks of the end of the financial year, and they are to be tabled in Parliament within four months of the end of the financial year. The need to consolidate the results of controlled entities into their parent entity's financial report means that the financial statements of associated entities that operate under the Corporations Act 2001 are also required to report within 12 weeks of the end of financial year.
All public hospitals met the legislated time frame in 2012–13, as was the case in 2011–12. The audits of two associated entities were, however, not completed within the legislated time lines, but were completed by 31 October 2013.
The average time to finalise financial statements increased to 9.1 weeks in 2012–13 from 8.5 weeks in 2011–12. Some delays arose directly from the need to complete the audit of the National Health Funding Pool—Victorian State Pool Account prior to finalising audits of individual hospitals, to ensure that funds distributed from the pool account were accurately reflected in hospital financial statements.
2.3.3 Better practice
An assessment of the quality of financial reporting processes was conducted against better practice criteria, detailed in Appendix C, using the following scale:
- no existence—process not conducted by the entity
- developing—partially encompassed in the entity's financial reporting preparation processes
- developed—entity has implemented the process, however, it is not fully effective
- better practice—entity has implemented effective and efficient processes.
The results are summarised in Figure 2A.
Figure 2A
Results of assessment of report preparation processes against better practice elements
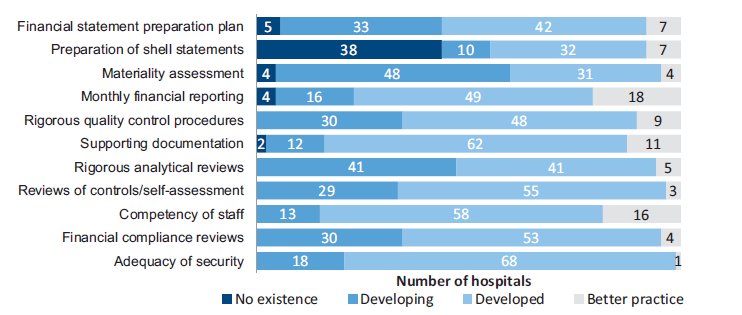
Source:Victorian Auditor-General's Office.
While most elements were developing or developed, with some public hospitals having achieved better practice, the most significant element to be addressed across the sector is the preparation of shell financial statements. Providing these to auditors well before year end enables format, presentation and disclosure issues within the financial statements to be identified and resolved early. Conversely, not providing shell financial statements to the auditors in advance of year end can cause significant delays and additional costs in the finalisation of the audit—potentially jeopardising the hospital's ability to meet legislated time lines and causing unnecessary cost increases.
Recommendations
That public hospitals:
- adjust all errors identified during audits so that their financial statements are of the highest possible quality
- review their financial reporting processes to address the better practice report preparation elements, including the timely preparation of shell financial statements.
3 Financial sustainability
At a glance
Background
To be financially sustainable, entities need to be able to meet current and future expenditure as it falls due. They also need to absorb foreseeable changes and risks without significantly changing their revenue and expenditure policies.
This Part provides an insight into the financial sustainability of the 87 public hospitals based on an analysis of the trends in their key financial indicators over the past five years.
Findings
We assessed the overall financial sustainability risk for public hospitals in 2012–13 as medium, meaning there are some concerns relating to the longer-term financial sustainability of public hospitals.
The financial reports of 28 public hospitals (31 in 2012) were supported by a letter from the Department of Health which stated that it would provide financial support to enable them to meet their financial obligations, if required. Without this letter, these 28 public hospitals would have been unable to report as a going concern at 30 June 2013.
Overall improvements in the sector's net result since 2009–10 have been driven by cost containment measures and increased government funding. In 2012–13, the number of public hospitals with an underlying deficit decreased to 60 (62 in 2011–12).
Twenty-three public hospitals had available cash on hand at year end to fund less than one week of operations. This puts these public hospitals at risk of not being able to respond if significant unforeseen expenditure arises.
The current hospital funding model continues to have a direct and significant impact on the financial sustainability of hospitals. It limits the ability of governing bodies and management to make decisions to renew and replace assets. For assets not subject to public private partnership arrangements, more spending may be required over the long term to replace ageing public hospital assets. This poses a risk to the sector's ability to keep up with the increasing demand for health services and to maintain assets.
3.1 Introduction
To be financially sustainable, entities need to be able to meet their current and future expenditure as it falls due. They also need to absorb foreseeable changes and financial risks that materialise, without significantly changing their revenue and expenditure policies. The assessment of financial sustainability assists in identifying trends that either warrant attention or highlight positive results.
Financial sustainability should be viewed from both short-term and long-term perspectives. Short-term indicators show the ability of an entity to maintain positive operating cash flows in the near future, or to generate an operating surplus in the next financial year. Long-term indicators focus on strategic issues, such as the ability to fund ongoing asset maintenance programs or reduce long-term debt.
In this Part, insight is provided into the financial sustainability of public hospitals through analysis of five key financial sustainability indicators as at 30 June 2013, and the trends of these indicators over the last five years. Appendix D describes the sustainability indicators and their significance, as well as the risk assessment criteria and rating scales used in this Part.
The analysis addresses the financial position of the sector as a whole, of the three categories of hospitals (metropolitan, regional and rural), and of individual public hospitals.
To form a definitive view of an entity's financial sustainability, a holistic analysis would be required, going beyond financial indicators and including an assessment of the entity's operations and environment. However, non-financial factors are not considered in this Part.
3.2 Financial results of public hospitals
3.2.1 Operating result
Public hospitals, as an essential public service, should manage their finances so that they break even or report a small profit. The sector's net result for 2012–13 was a deficit of $4 million—which against the total revenue of $12 billion for all entities in the sector is tantamount to a break even position.
Total public hospital revenue increased by 3 per cent in 2012–13, and expenditure increased by a corresponding 3 per cent. The composition of what makes up revenue and expenditure for public hospitals has remained unchanged over the past five years. Government funding contributes 88 per cent of public hospital revenue, and salaries and wages are the biggest expense, representing 65 per cent of expenditure.
Public hospitals derive and report revenue as either:
- revenue arising from health services agreements (HSA income)—which is largely made up of government funding
- revenue from hospital and community initiatives (non-HSA income).
Non-HSA income is self-generated and is typically derived from additional services provided such as pharmacy sales, cafeteria sales, diagnostic imaging, private practice fees, car park fees and income on investments.
Rural and regional public hospitals derive 92 per cent and 91 per cent, respectively, of their revenue from health service agreements. This means rural and regional hospitals have little self-generated revenue over which they have discretion to spend. In contrast, metropolitan public hospitals generate 87 per cent of their revenue from health services agreements and therefore have more capacity to fund initiatives and absorb unexpected cost fluctuations.
3.2.2 Financial position
An entity's financial position is generally measured with reference to its net assets—the difference between its total assets and total liabilities. However, this measure is less appropriate for public hospitals as they largely do not hold assets to generate revenue.
The strategic objectives for public hospitals are more aligned to providing key health services to the public. Maintaining assets and managing debt levels are lesser priorities for public hospitals, but are still important as the value of buildings, medical equipment and infrastructure assets is significant.
The total assets of the sector were $12.0 billion at 30 June 2013. Net assets at 30 June 2013 were $7.5 billion. This positive net asset position improved during 2012–13 as large scale capital projects progressed, such as the new Victorian Comprehensive Cancer Centre, and smaller capital projects were completed. Corresponding liabilities for some of these capital projects were recognised.
3.2.3 Going concern
Despite the financial results achieved by the sector in 2012–13, 28 public hospitals (31 in 2011–12) showed signs of financial stress, with a material uncertainty about their ability to continue as a going concern.
The Department of Health (DH) provided letters of financial support to these 28 hospitals, undertaking to provide adequate cash flows to enable them to meet their current and future obligations, as and when they fall due, for a period of 12 months up to September 2014, should it be required.
The letter of financial support mitigates the risk that the 28 hospitals will cease to operate during 2013–14. Accordingly, these hospitals are able to continue to report as a going concern, in accordance with Australian Accounting Standards.
Figure 3A shows the hospitals that relied upon 'letters of support' at the date of signing their 2012–13 financial reports.
Figure 3A
Public hospitals relying upon 'letters of support', 2012–13
|
Metropolitan |
Regional |
Rural |
|---|---|---|
|
Alfred Health Austin Health Eastern Health Melbourne Health Monash Health Northern Health Peter MacCallum Cancer Centre Royal Children's Hospital Royal Women's Hospital |
Albury Wodonga Health Ballarat Health Services Bendigo Health Care Group Central Gippsland Health Services Goulburn Valley Health Northeast Health Wangaratta Wimmera Health Care Group |
Alpine Health Bass Coast Regional Health Beechworth Health Service Castlemaine Health Colac Area Health Djerriwarrh Health Services Dunmunkle Health Services East Wimmera Health Services Kyneton District Health Service Maldon Hospital Maryborough District Health Portland District Health |
Source: Victorian Auditor-General's Office.
3.3 Financial sustainability of public hospitals
3.3.1 Overall assessment
The overall financial sustainability risk for the public hospital sector for 2012–13 was assessed as medium, consistent with the 2011–12 result. This assessment means there are concerns relating to the longer-term financial sustainability of public hospitals.
Figure 3B presents the indicators by hospital category for 2012–13.
Figure 3B
Financial sustainability risk, 2012–13
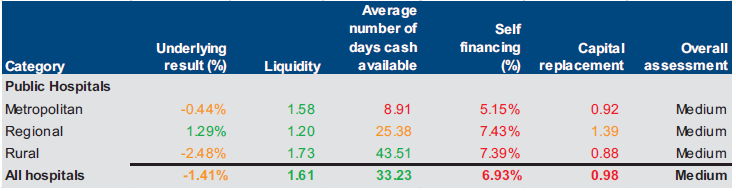
Note: Red signifies a high risk, while amber indicates longer-term sustainability issues and green indicates no issues.
Source: Victorian Auditor-General's Office.
Detailed results of our sustainability risk assessments for each category and each public hospital can be found in Appendix D. Detailed comments on the results for each of the five indicators follow in this Part.
3.3.2 Net result
Net result is calculated by subtracting an entity's total expenses from its total revenue, to show what was earned or lost in a given period of time. A positive result is known as a surplus, a negative result indicates a deficit.
Figure 3C shows the average net result for each public hospital category from 2008–09 to 2012–13.
Figure 3C
Net result, by hospital category
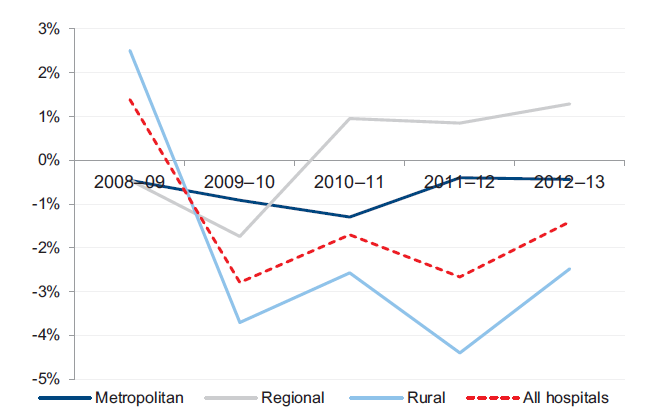
Source: Victorian Auditor-General's Office.
The net results by category have fluctuated significantly over the five year period, although most have remained in deficit. All categories have achieved some recovery since the large losses delivered in 2009–10. The losses in 2009–10 were largely due to significantly increased depreciation costs resulting from the sector wide asset revaluations performed in 2008–09. Under the funding model, DH does not fund public hospitals directly for depreciation, and it is expected that public hospitals will record operating deficits as they incur increased depreciation charges.
The overall improvement since 2009–10 has been driven by hospital cost containment measures and increased government funding.
Regional hospitals have achieved sustained average surpluses in recent times. These averages are buoyed by consistently strong results from a number of hospitals which increase the average result of the category as a whole.
In 2012–13, the number of public hospitals with an underlying deficit decreased to 60 (62 in 2011–12). This continues an overall improvement in the number of public hospitals with operating deficits since 2009–10.
3.3.3 Liquidity
Liquidity is a measure of current assets against current liabilities. This measures the ability of an entity to pay existing liabilities in the next 12 months. A ratio of one or more means there are more current assets than short-term liabilities.
At 30 June 2013, 33 of 87 public hospitals had lower balances of current assets than current liabilities (33 in 2011–12). This means they face liquidity challenges of not being able to pay liabilities as and when they fall due. Low liquidity highlights the pressure on public hospitals to meet short-term debts and contributed to the need for some public hospitals to seek a 'letter of support'.
Figure 3D shows that the average liquidity ratio by hospital category has remained relatively stable over the past five years.
Figure 3D
Average liquidity ratio, by hospital category
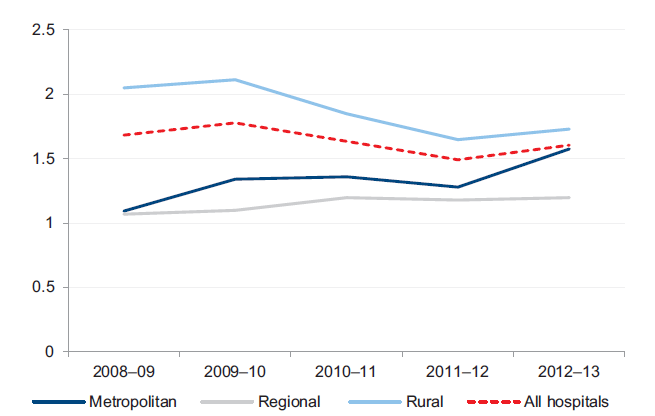
Source: Victorian Auditor-General's Office.
While average liquidity ratios have remained stable, the number of public hospitals with significant liquidity risks is slowly growing each year. The risk profile over the past five years in Figure 3E shows a greater number of public hospitals moving to the high‑ and medium-risk categories.
Figure 3E
Public hospital liquidity risk
Source: Victorian Auditor-General's Office.
3.3.4 Average number of days cash available
The average number of days cash available indicator measures the number of days of operating expenses that a hospital could pay with its current, unrestricted, cash.
This indicator is calculated using the cash and cash equivalents items disclosed within the financial reports of individual hospitals. This approach is consistent with the definition of cash and cash equivalents, within the Australian Accounting Standards. According to this definition certain assets, such as term deposits with original maturities of more than 90 days, are specifically excluded from cash. For the purposes of completeness and consistency across all hospitals, this indicator therefore excludes these particular assets.
The calculation of unrestricted cash also excludes amounts held by a public hospital, where the use of these amounts has been restricted–such as patient money held in trust or cash set aside for capital purposes. These amounts are excluded from this indicator, as they cannot be used by the public hospital to cover their day to day operating costs.
At 30 June 2013, 57 of 87 public hospitals (49 of 87 at 30 June 2012), including most major metropolitan and regional hospitals, had cash holdings equivalent to less than 30 days of their operating cash outflows.
Figure 3F shows that the average number of days of cash available at year end decreased at the whole of sector level, but remained greater than one month's operating cash flows as at 30 June 2013.
Figure 3F
Average number of days cash available, by hospital category
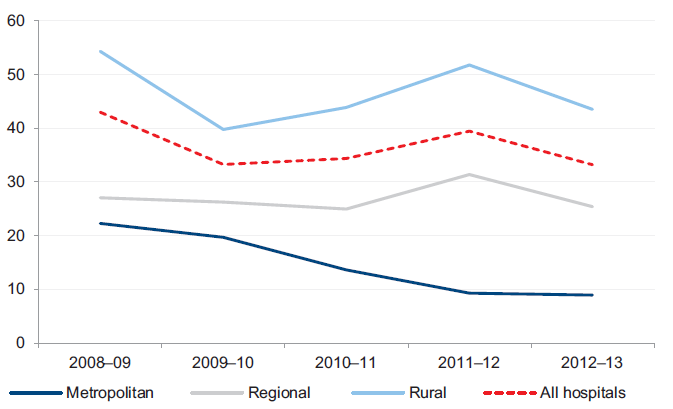
Note: Funds held in trust, unspent capital grants and restricted special purpose funds are excluded from this analysis as their use is restricted.
Note: Holdings in short term investments, such as such as term deposits, are also excluded from this analysis.
Source: Victorian Auditor-General's Office.
The cash holdings at 23 public hospitals were less than seven days at 30 June 2013. This means that these hospitals could only continue to operate for a week if there was some delay in providing them with their next funding instalment. The low level of cash held also puts at risk the ability of these hospitals to respond in the event of unexpected costs. The 23 hospitals are listed in Figure 3G, and include several large metropolitan public hospitals.
Figure 3G
Public hospitals with cash holdings of less than seven days' worth of operating cash outflow, 30 June 2013
|
Hospital |
Days cash available |
|---|---|
|
Alfred Health |
– |
|
Benalla Health |
– |
|
Colac Area Health |
– |
|
East Wimmera Health Service |
– |
|
Eastern Health |
– |
|
Inglewood and Districts Health Service |
– |
|
Mercy Public Hospitals Inc. |
– |
|
Monash Health |
– |
|
Peter MacCallum Cancer Centre |
– |
|
Royal Women's Hospital |
– |
|
Yarram and District Health Service |
– |
|
Melbourne Health |
2 |
|
Beechworth Health Service |
3 |
|
Kyabram and District Health Service |
3 |
|
St. Vincent's Hospital (Melbourne) Limited |
3 |
|
Western Health |
3 |
|
Austin Health |
4 |
|
Northeast Health Wangaratta |
4 |
|
Swan Hill District Health |
4 |
|
Ballarat Health Services |
5 |
|
Kerang District Health |
5 |
|
Northern Health |
5 |
|
Bendigo Health Care Group |
6 |
Note: Where a hospital's unrestricted cash balance is less than zero, it has been rounded to zero days cover.
Note: Funds held in trust, unspent capital grants, restricted special purpose funds and holdings in short term investments, such as such as term deposits, are excluded from this analysis.
Source: Victorian Auditor-General's Office.
3.3.5 Self-financing
The self-financing indicator measures the ability of an entity to replace assets using cash generated by its own operations. The higher the percentage the more effectively this can be done.
Across the sector, the average self-financing ratio remained low, highlighting the sector's ongoing reliance on government funding to maintain service levels and to maintain and replace assets. In 2012–13, metropolitan hospitals continued the trend of the past four years, with lower self-financing ratios than regional and rural hospitals.
Figure 3H shows the movement in the average self-financing ratio for each of the three hospital categories over the past five years.
Figure 3H
Average self-financing indicator, by hospital category
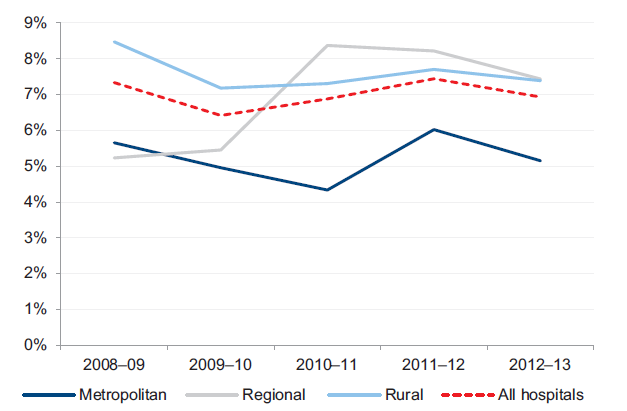
Source: Victorian Auditor-General's Office.
Figure 3I shows that the self-financing risk for 80 per cent of public hospitals was high for 2012–13. This is consistent with results since 2008–09, and is largely due to the funding model.
Figure 3I
Public hospital self-financing risk
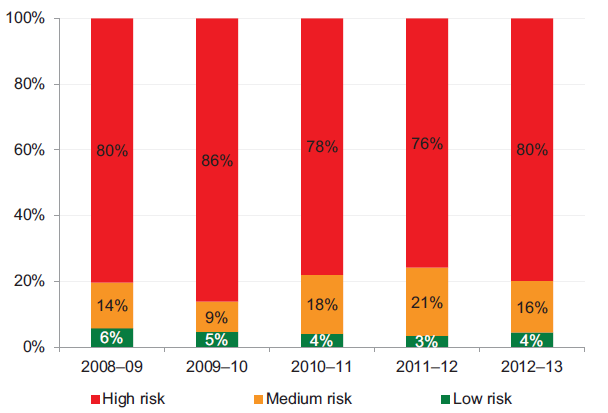
Source: Victorian Auditor-General's Office.
3.3.6 Capital replacement
The capital replacement indicator compares the rate of spending on infrastructure with an entity's depreciation. Ratios higher than 1:1 indicate that spending on new infrastructure is greater than depreciation for the year. This is a long-term indicator, as capital expenditure can be deferred in the short term if there are insufficient funds available from operations, and borrowing is not an option.
Figure 3J shows that after a sharp decline in 2009–10, the sector's overall capital replacement ratio has remained relatively stable. On average only regional hospitals are replacing assets at a rate greater than they are being consumed.
Figure 3J
Average capital replacement indicator, by hospital category
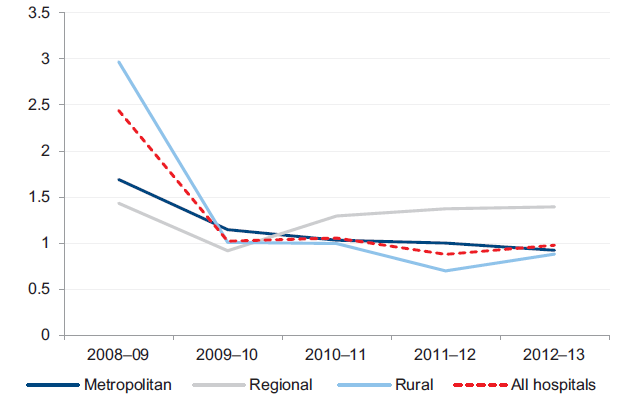
Source: Victorian Auditor-General's Office.
The data used for this indicator includes spending on replacing or improving facilities but does not capture ongoing repairs and maintenance. It also excludes expenditure on hospital assets procured through public private partnerships (PPP) and maintained by the private sector provider. Typically, PPP arrangements require the private sector provider to maintain the asset throughout the agreement's operating phase and return the asset to the state at the end of the partnership. When the asset is returned to the state, it must be returned in an agreed condition.
As a result of the above exclusions, the true level of spending on assets and their maintenance may be misstated. The results, nevertheless, remain indicative and identify challenges for DH and public hospitals to fund capital replacement into the future.
The data suggests that for assets not subject to PPP arrangements, more spending may be required over the long term to replace ageing public hospital assets. Current spending will not be sufficient for public hospitals to continue maintaining and upgrading existing infrastructure and equipment. This poses a risk to the sector's ability to keep up with the increasing demand for health services and to maintain assets.
Figure 3K highlights a declining annual spend on replacing and improving fixed assets compared with increasing annual depreciation expenditure.
Figure 3K
Cash spent on fixed assets compared to annual depreciation expenditure
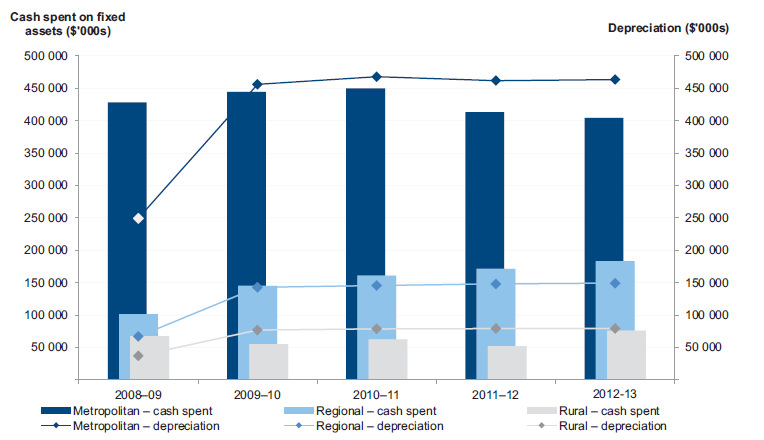
Source: Victorian Auditor-General's Office.
Annual capital spending was less than depreciation in both the metropolitan and rural sectors in each of the past four years. This indicates that assets are being used faster than they are being replaced.
The impact of the funding model, on the revenue side, is clearly evident in Figure 3L. In 2012–13, 37 per cent of public hospitals (32 hospitals) received capital grants from DH equal to less than 20 per cent of their depreciation expense for the financial year (38 hospitals in 2011–12). This was most pronounced in rural hospitals.
Figure 3L
Percentage of public hospitals receiving capital grants of less than 20 per cent of depreciation expense
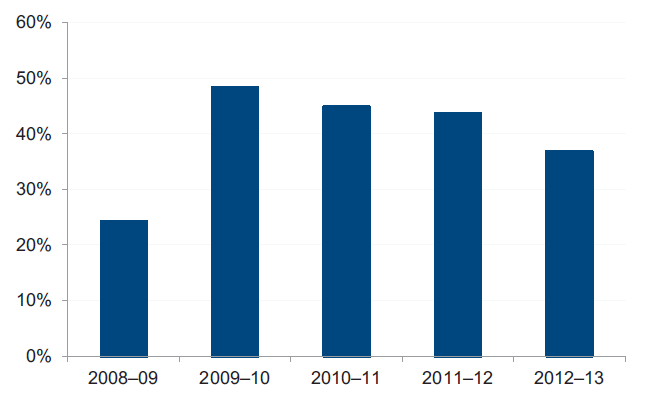
Source: Victorian Auditor-General's Office.
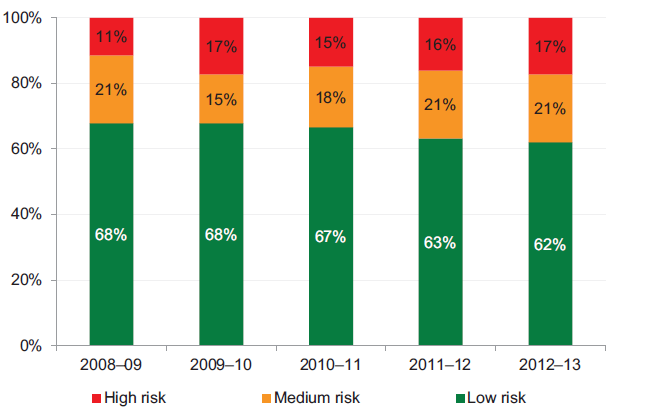
Figure 3M shows that the number of public hospitals with a high capital replacement risk has reduced since 2009–10, with more hospitals assessed as medium and high risk.
Figure 3M
Public hospital capital replacement risk
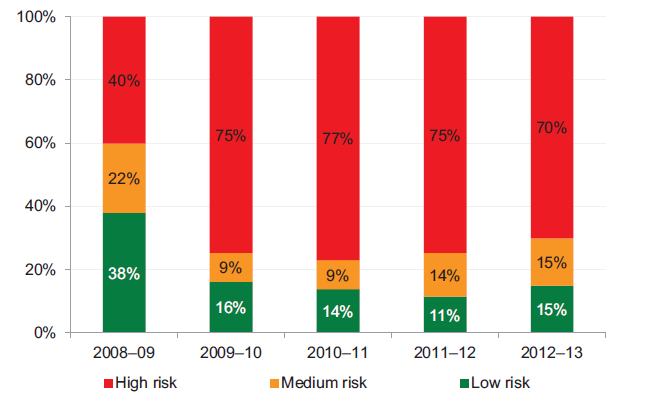
Source: Victorian Auditor-General's Office.
The value of assets across the sector increased in 2008–09, increasing the depreciation charged annually and affecting the capital replacement indicator.
The 2012–13 results show that the proportion of public hospitals in the low-risk category has improved slightly, however, it remains well below 2008–09 levels. The next revaluation cycle will occur in 2013–14, at which time it is likely that the value of assets across the sector will increase and affect the annual depreciation charge.
3.3.7 Impacts of the funding model on sustainability
Public hospital funding arrangements directly impact the financial sustainability of public hospitals. For hospitals to maintain an adequate level of service, their assets need to be maintained and replaced when necessary. However, they are almost entirely dependent on obtaining additional government funding to meet their asset maintenance, upgrade and replacement needs.
The funding model does not progressively provide funding to public hospitals to match the depreciation of their assets. Capital grants, which may be provided for asset renewal and replacement, are allocated by DH strategically across the sector.
The impact on public hospitals is demonstrated as follows:
- Seventy public hospitals (80 per cent) had a high self-financing risk in 2012–13 (66 in 2011–12).
- In 2012–13, 32 public hospitals received capital grants of less than 20 per cent of their depreciation expense for the year, that is, the funding received for replacing their assets was significantly less than the value of assets they consumed.
Under section 33 of the Health Services Act 1988, the functions of a public hospital's board are to oversee and manage the hospital, and to ensure that services provided comply with the requirements of the Act and the hospital's objectives. Despite this, under the funding model, management and hospital boards have limited control over capital funding while remaining accountable for the impacts of ageing infrastructure and associated expenditure. The mismatch between the governance and funding models blurs accountability for the financial performance of individual hospitals.
4 Internal controls at public hospitals
At a glance
Background
This Part presents the results of our assessment of general internal controls, risk management and controls over private patient revenue at public hospitals.
Findings
Some rural hospitals put at risk the accuracy of financial reporting and increase their exposure to fraud because of inadequate controls over key account reconciliations and changes to masterfiles.
Generally, public hospitals are not gaining assurance over the adequacy of the risk management practises at the outsourced providers on which they rely. This means they may be exposed to risks of which they are not aware and cannot manage.
The effectiveness of risk management could be improved by elevating its visibility to governing boards and audit committees through the regular reporting of policies and risks.
Recommendations
That public hospitals:
- review their risk management frameworks and policies, at least annually
- report on 'critical' or 'extreme' risks, and associated mitigation strategies to their board or audit committee, at least quarterly
- use internal audit to review practices in relation to private patient revenue and compliance with established policies.
4.1 Introduction
Poor internal controls diminish management's ability to achieve an entity's objectives, deliver upon agreed service levels and comply with relevant legislation. Poor internal controls also increase the risk of fraud, error and irregularities.
Reliable internal controls are a prerequisite for accurate and timely reporting. In our financial audits, we focus on the internal controls over financial reporting and assess whether entities have mitigated risks to the completeness and accuracy of their financial statements.
The board and management of each public hospital are responsible for developing and maintaining adequate systems of internal control to enable:
- the preparation of accurate financial records and other information
- timely and reliable external and internal reporting
- the appropriate safeguarding of public assets
- the prevention or detection of fraud, errors and other irregularities.
Integral to the annual financial audit is an assessment of the adequacy of the internal control framework, and the governance processes, related to an entity's financial reporting. In making this assessment, consideration is given to the internal controls relevant to the entity's preparation and fair presentation of the financial report, but this assessment is not used for the purpose of expressing an opinion on the effectiveness of the entity's internal control.
In this Part we report on aspects of the internal controls of Victoria's 87 public hospitals. We specifically address:
- general internal controls
- risk management frameworks, including a review of fraud risk management
- private patient revenue.
4.2 General internal controls
Internal controls at public hospitals and their associated entities were adequate for maintaining the reliability of external financial reporting. Nevertheless, the following areas were commonly identified as requiring improvement:
- preparing and reviewing key account reconciliations
- review of masterfile standing data changes.
Both of these issues were reported last year and while there has been some improvement in the number of hospitals at which these weaknesses were observed, further improvement is required particularly in rural hospitals.
Weaknesses were brought to the attention of management and audit committees by way of management letters.
4.2.1 Preparing and reviewing key account reconciliations
A financial report is prepared from information captured in an entity's general ledger, with key general ledger balances supported by information in subsidiary ledgers such as accounts payable, fixed assets and payroll. Periodic reconciliation of the general ledger with subsidiary ledger balances confirms the completeness and accuracy of data.
Timely preparation and independent review of reconciliations decreases the risk that errors may go undetected or may not be resolved in a timely manner. Poor controls can adversely affect the accuracy of financial reporting.
Twelve of the 87 public hospitals (23 in 2011–12) had deficiencies in the preparation and review of key reconciliations. While these 12 hospitals are preparing reconciliations regularly, independent reviews of these reconciliations either did not occur, or were not documented, in a timely manner. Nine of the 12 were rural hospitals.
4.2.2 Review of masterfile standing data changes
Financial systems such as accounts payable and payroll systems, rely on the maintenance of masterfiles holding standing data to enable reliable processing of individual payments. The standing data can include details such as names, addresses, pay rates and bank account details.
It is important that all changes to masterfile standing data are checked for completeness, accuracy and legitimacy. Without checks, processing errors can be repeated many times over, reducing data integrity. An independent review of masterfile standing data changes is important for the detection and timely correction of unintentional or fraudulent changes, and to guard against payments to fictitious parties.
Eleven of the 87 public hospitals (14 in 2011–12) had weaknesses in maintaining key system masterfiles, including a lack of an independent review of changes made, and inadequate documentation to support the changes made. These issues were identified at metropolitan and rural hospitals.
4.3 Risk management
Risk management is an important component of public sector governance. For public hospitals, risk management involves identifying and mitigating risks to the delivery of quality health services to the public, the timely and effective development of new infrastructure projects, and optimal resource allocation.
Risk management is a combination of organisational systems, processes and procedures that identify, assess, evaluate and mitigate risks in order to protect the organisation, its strategies and performance objectives. An effective risk management framework plays a significant role in reducing exposure to potentially unfavourable events.
For public hospitals, the potential consequences of ineffective risk management can be significant in terms of community health and wellbeing.
4.3.1 Risk management frameworks
Public hospitals are required to develop, implement and maintain a risk management framework. Primary responsibility for doing so rests with a hospital's board. Boards should ensure the hospital has a risk management policy and framework that clearly describes its overall approach and intention with respect to risk management.
Figure 4A outlines the key elements of an effective risk management framework. It draws on the requirements of the Financial Management Act 1994, the Department of Treasury and Finance's 2011 Victorian Government Risk Management Framework and the Australian/New Zealand Risk Management Standard AS/NZS ISO 31000:2009.
Figure 4A
Key elements of an effective risk management framework
|
Component |
Key elements |
|---|---|
|
Policy |
Risk management policy is established and:
|
|
Management practices |
Systems and processes exist for considering new and emerging risks and the revision of existing risks. Business risks are identified, categorised and rated with appropriate consideration of likelihood and consequence, within a register providing critical risks for executive management attention. Mitigation strategies (treatment plans) are developed, aiming to minimise the potential consequences of identified risks. Risk management principles are incorporated into strategic and business planning. Appropriate education and training of staff is undertaken to enable risk principles to be appreciated and responsibilities to be understood. Resources are provided to manage risk management activities. Systems for gathering and analysing incident data exist to identify or predict adverse trends. Regular and timely risk reports are prepared for the board and audit and risk committee considers critical or extreme risks and the implementation of mitigation strategies. Benchmarking of the entity risk profile against available industry data. |
|
Governance and oversight |
There is oversight of the risk management processes by audit and risk committee or board. Risk management policies and procedures are reviewed and approved by the board. Risk reports provided are considered, and appropriate action is taken where required. Entity risk workshops are conducted. Independent assessments (using internal audit) of the integrity of the entity's risk management are conducted. |
Source: Victorian Auditor-General's Office based on the Victorian Government Risk Management Frameworkand Risk Management Standard AS/NZS ISO 31000:2009.
We assessed the risk management framework of the 87 public hospitals against the above elements. All public hospitals had some form of risk management framework in place generally addressing most aspects of the better practice framework. Attention should be given to the regular review of overarching policies, the use of risk registers and the implementation of fraud incident logs.
4.3.2 Risk management policies
During 2012–13, 86 of 87 public hospitals had a risk management policy in place. Of the 86, many had better practice elements included in their policy. The following areas were typically well covered at public hospitals:
- the overall objectives of the risk management framework—100 per cent
- reference to the Department of Treasury and Finance's 2011 Victorian Government Risk Management Framework and the Australian/New Zealand Risk Management Standard AS/NZS ISO 31000:2009—91 percent
- the responsibility for risk management within the hospital—94 per cent
- reporting obligations for monitoring and managing identified risks—95 per cent
- the requirement for the approval of risk management policies by the board or relevant committee—93 per cent.
The following elements were not well incorporated into risk management policies:
- a requirement for risk management to be included in business and strategic plans—missing for 22 percent of hospitals
- a requirement for the audit or risk committee to include their risk oversight function in the committee's charter—missing for 19 per cent of hospitals
- a requirement for an annual review of the policy—missing at 24 per cent of hospitals.
These elements, if not properly addressed, can impact the overall effectiveness of risk management activities.
The one hospital that did not have a risk management policy in place, had a risk management plan and a regularly updated risk register. The hospital is a small rural hospital, and the responsibility for oversight of its risk framework falls directly with the Chief Executive Officer and audit committee. While establishing a risk management policy may seem cumbersome, documentation of key approaches and business rules enables the better transfer of knowledge in the event of changes to management personnel.
4.3.3 Management practices
The following elements of an effective risk management framework were in place, at public hospitals:
- systems and processes exist for considering new and emerging risks and the revision of existing risks—97 per cent
- risks identified, categorised and rated with appropriate consideration of likelihood of occurrence—98 per cent
- executive management involved in identifying and assessing risks—98 per cent
- appropriate training enabling risk principles to be appreciated and understood by all relevant staff—87 per cent
- adequate staff resources allocated to the risk management function—100 percent
- management review of existing risks, and consideration of new and emerging risks at least annually—100 per cent.
Generally, public hospitals did not review the risk management practices of their outsourced providers. Providers typically deliver key functions such as payroll, information technology services and accounts payable services. The delivery of these functions has important risk management, security and accountability implications for hospitals.
When outsourcing key functions, hospital management does not forego its duty to ensure that controls are adequate, that outputs are accurate or that sensitive information is protected.
Assurance over the effectiveness of a provider's control environment, including their risk management practices, is considered part of an entity's overall internal control framework. With no assurance about the adequacy of outsourced providers risk management, public hospitals may be exposed to risks of which they are not aware and cannot manage.
Maintaining risk registers
Ninety-five per cent of public hospitals (83 of 87) maintained a risk register. This is compared to 97 per cent of public hospitals with policies that required a risk register to be developed. The four hospitals that did not have a risk register were in the process of developing one. All 83 risk registers recorded the likelihood and consequence of each identified risk. Eighty‑one of the 83 hospitals also documented strategies to mitigate the identified risks.
Reporting
Risks identified in the risk registers as 'critical' or 'extreme' were reported to the board, or relevant risk committee, at least quarterly at 70 public hospitals.
Fourteen of the remaining 17 hospitals reported these risks to the board biannually, annually or on request. Better practice suggests that such risks should be reported to the board at least quarterly.
The remaining three hospitals had not identified any 'critical' or 'extreme' risks. Benchmarking against the industry can provide an opportunity to better inform risk identification and management, and encourage better performance. Benchmarking of the hospital's risk profile against industry data was not performed at 60 hospitals (69 per cent).
4.3.4 Governance and oversight
The board is ultimately accountable for a hospital's operations, and is a crucial part of effective risk management. Boards exercise governance and oversight by undertaking high-level reviews of identified risks and subsequent mitigation strategies, as well as developing and signing off the overall risk management framework.
The regularity of review of risk management policies and procedures was inconsistent across the sector. Despite the policies of 76 public hospitals requiring an annual review, 31 hospitals (36 per cent) had not reviewed their policy or framework in the past twelve months. These hospitals would therefore have no assurance about the currency of their risk management activities.
An internal audit can provide independent oversight and recommendations to improve a public hospital's risk management policies and practises. Across the sector, 68 per cent of hospitals included consideration of their most critical risks in the internal audit plan and had scheduled an internal audit review in the short or medium term. In 63 per cent of the hospitals, an internal audit had been conducted in the past three years.
Risk attestation
The Victorian Government Risk Management Framework requires public sector agency heads to attest that their risk identification and management plan is consistent with the requirements of AS/NZS ISO 31000:2009. A responsible body or audit committee is required to verify this attestation.
The 2012–13 annual reports of all 87 public hospitals carried a risk attestation, and in all cases it was supported by verification by the audit committee.
4.3.5 Managing the risk of fraud
The risk of fraud exists across all industries and sectors. Sound internal control and risk management frameworks assist to prevent and detect fraudulent activities. Seventy-seven of the 87 public hospitals had separate, and specific, policies and procedures in place to address fraud risk. Thirty-four of the 87 public hospitals maintained a separate fraud risk framework.
The Standing Directions of the Minister for Finance suggest that agencies maintain a register of all cases of suspected or actual theft, arson, irregularity or fraud to allow for appropriate reporting to the Minister for Finance and the Auditor-General. Thirty-seven public hospitals did not maintain a register, however each of the 37 had procedures in place to report identified frauds to the board and relevant committee.
Across the sector 14 instances of fraud were identified during 2012–13, with the single largest instance amounting to around $200 000. In each of the 14 cases the hospital reported the incident appropriately and has amended procedures to mitigate the risk of recurrence. Insurance policies covered losses at each of the affected hospitals.
4.4 Private patient revenue
In tight economic times, public hospitals are under increasing pressure to fund their operations from sources other than government funding. Private patient fees provide a stream of income over and above that provided under annual hospital service agreements with government, and give public hospitals greater flexibility in delivering services.
Private patient services typically generate higher fees for service than public patient services. In 2012–13, private patient services across Victorian public hospitals generated revenue of more than $719 million ($611 million in 2011–12). Eighty-two of the 87 public hospitals generated private patient revenue in 2012–13.
4.4.1 Private patient revenue framework
Figure 4B outlines the key components of an effective revenue framework. It draws on the Standing Directions of the Minister for Finance under the Financial Management Act 1994.
Figure 4B
Key elements of an effective revenue framework
|
Component |
Key elements |
|---|---|
|
Policy |
Established policy that includes:
Policy complies with the requirements of the Department of Health's hospital circulars. Policy is approved by the board. |
|
Management practices |
Compliance with the policy is monitored. Systems enable adequate recording, follow-up and monitoring of private patient fees. Appropriate training for staff is provided about the admission of private patients. Insurance details are verified or fees are collected at or in advance of admission. Debt collection agencies are engaged if appropriate. Debt write-offs are authorised by the appropriate person. Risks associated with private patient fees are included in the risk register and mitigation actions are taken. There is comprehensive reporting to the executive and board regularly. |
|
Governance and oversight |
Compliance with the policy and departmental requirements is monitored. Trends in private patient fee revenue and debt write-offs are monitored. Risks associated with private patient fees are reviewed periodically and risk mitigation is monitored. Management reports are reviewed and opportunities for improvement are considered/endorsed. Policies and procedures are periodically reviewed and approved by the board. An internal audit is engaged to periodically review policy compliance and processes and identify opportunities for improvement. |
Source: Victorian Auditor-General's Office.
We considered these elements when assessing the private patient revenue processes at the 87 public hospitals. Overall, frameworks for generating and collecting private patient revenue across the sector were adequate. While not all public hospitals had specific private patient revenue policies, appropriate procedures were typically included in the hospital's general revenue and patient admission policies. Management, governance and oversight of private patient revenue was generally appropriate for the scale of private patient revenue generated by the hospital.
4.4.2 Policies
Existence and approval of policies
Fifty-eight of the 82 public hospitals (71 per cent) that generated private patient revenue had policies or procedures specifically related to private patient revenue. The policies and procedures covered the generation, collection and recording of private patient fees.
Of the remaining 24 hospitals, 14 relied on their generic policies addressing patient admission and cash handling procedures. Eleven of the 24 (46 per cent) did not intend to develop or implement a specific private patient revenue policy.
The policies or procedures in place typically covered the key elements expected, including:
- procedures for admitting private patients—97 per cent
- requirements to comply with the national health care agreement arrangements—78 per cent
- requirements to obtain insurance or payment details in advance of admission—78 per cent of hospitals
- procedures for debt collection—91 per cent
- the level of authorisation required to write-off debt—100 per cent of hospitals.
The governing body had approved the policy in 95 per cent of the 82 hospitals. Eighty‑nine per cent of those approved by the governing body had been approved or reviewed in the past three years.
4.4.3 Management practices
Monitoring
Monitoring of private patient revenue was effective across the 82 public hospitals that generated private patient revenue. Seventy-six of the hospitals (93 per cent) had a designated officer or committee directly responsible for overseeing the income, while the remaining six relied on their general revenue monitoring processes.
Monitoring processes included annual (or more frequent) reviews of procedures in 55 per cent of the hospitals that generated private patient revenue.
Examinations of actual practice revealed that public hospitals operated in line with their policies. Policy areas addressed well included:
- systems being in place to record, follow up and monitor private patient revenue—100 per cent
- all relevant hospital staff being provided with training for the admission of private patients—99 per cent
- verification of insurance or payment details occurring before admission, or as soon as practicable afterwards—89 per cent
- regular reporting being provided to the governing body—100 per cent.
Reporting
Reporting of private patient revenue was appropriate across the sector. Most of the 82 public hospitals provided monthly information to the board and relevant committee. Figure 4C shows the lines of reporting for each of the hospital sectors.
Figure 4C
Lines of reporting, by hospital category
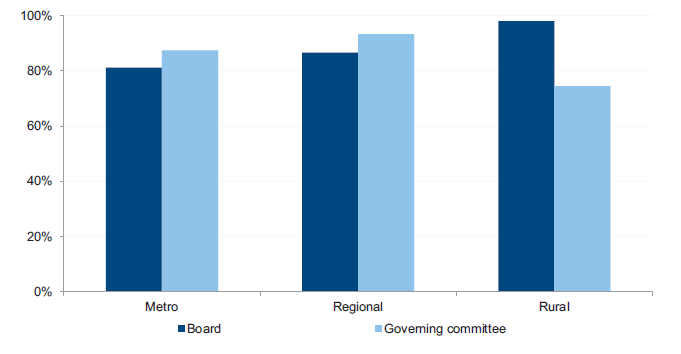
Source: Victorian Auditor-General's Office.
4.4.4 Governance and oversight
Monitoring at the board or committee level was adequate at 78 of the 82 public hospitals (95 per cent). Monitoring included regular reviews and updates of policy and procedure documents, revenue amounts, debt levels and debt write-offs.
An internal audit can be an effective tool for assessing compliance with established policies. However, an internal audit had not been engaged to review private patient revenue in most (55 per cent) of the public hospitals who collected this revenue.
In the eleven public hospitals that did have an internal audit review of their private patient revenue systems in the last three years, the reviews identified high- and moderate‑risk issues. In each instance, issues were appropriately dealt with by management in a timely manner.
Recommendations
That public hospitals:
- review their risk management frameworks and policies, at least annually
- report on 'critical' or 'extreme' risks and associated mitigation strategies to their board or audit committee, at least quarterly
- use internal audit to review practices in relation to private patient revenue and compliance with established policies.
Appendix A. VAGO reports on the results of financial audits
Figure
A1
VAGO reports on the results of the 2012–13 financial audits
Report |
Description |
|---|---|
Auditor-General's Report on the Annual Financial Report of the State of Victoria, 2012–13 |
This report provides the result of the audit of the state's annual financial report. It addresses the quality and timing of financial reporting, explains significant financial results for the state and financial implications of significant projects and developments that occurred during 2012–13. Tabled in Parliament in November 2013. |
Portfolio Departments and Associated Entities: Results of the 2012–13 Audits |
This report provides the results of the audits of approximately 210 entities. The report will address their financial reporting, financial sustainability and reporting developments, the use of contractors and temporary staff, and management of business continuity and information technology disaster recovery planning. Tabled in Parliament in November 2013. |
Public Hospitals: Results of the 2012–13 Audits This report |
This report provides the results of the audits of approximately 110 entities in the public hospital sector. The report will address their financial performance, financial sustainability, and management of private patient fees and risk. Tabled in Parliament in November 2013. |
Local Government: Results of the 2012–13 Audits |
This report provides the results of the audits of approximately 100 entities in the local government sector. The report will address their financial and performance reporting, financial sustainability, aspects of how they manage rate revenue, and the operation of audit committees. Proposed to be tabled in Parliament in December 2013. |
Water Entities: Results of the 2012–13 Audits |
This report provides the results of the audits of 20 entities in the water sector. The report will address their financial and performance reporting, financial sustainability, management of their treasury functions and procurement, and information technology security and change management. Proposed to be tabled in Parliament in December 2013. |
Tertiary Education and Other Entities: Results of the 2013 Audits |
This report provides the results of the audits of approximately 110 entities with a financial year other than 30 June 2013. The report will address their financial and performance reporting, financial sustainability, their financial policies and delegations, and management of procurement. Proposed to be tabled in Parliament in May 2014. |
Source: Victorian Auditor-General’s Office.
Appendix B. Completed audit listing
Metropolitan hospitals and associated entities
Audit type |
Financial report |
Finalised within statutory time frame |
||||||
|---|---|---|---|---|---|---|---|---|
Entity |
FMA |
Non-FMA |
Clear opinion issued |
Auditor-General's report signed |
Met |
Not met |
||
COMPLETED AUDITS WITHIN 30 JUNE 2013 BALANCE DATES |
||||||||
Alfred Health |
• |
✔ |
27 Aug 2013 |
• |
||||
Whole Time Medical Specialists |
O |
✔ |
17 Sep 2013 |
• |
||||
Austin Health |
• |
✔ |
30 Aug 2013 |
• |
||||
Calvary Health Care Bethlehem Ltd |
C |
✔ |
9 Sep 2013 |
• |
||||
Dental Health Services Victoria |
• |
✔ |
19 Aug 2013 |
• |
||||
Eastern Health |
• |
✔ |
28 Aug 2013 |
• |
||||
Melbourne Health |
• |
✔ |
4 Sep 2013 |
• |
||||
Royal Melbourne Hospital Foundation Ltd |
C |
✔ |
13 Aug 2013 |
• |
||||
Mercy Public Hospitals Inc |
• |
✔ |
3 Sep 2013 |
• |
||||
Monash Health |
• |
✔ |
30 Aug 2013 |
• |
||||
Kitaya Holdings Pty Ltd |
C |
✔ |
30 Aug 2013 |
• |
||||
Northern Health |
• |
✔ |
30 Aug 2013 |
• |
||||
Northern Health Research, Training and Equipment Foundation Limited |
C |
✔ |
22 Aug 2013 |
• |
||||
Northern Health Research, Training and Equipment Foundation Trust |
• |
✔ |
22 Aug 2013 |
• |
||||
Peninsula Health |
• |
✔ |
2 Sep 2013 |
• |
||||
Peter MacCallum Cancer Centre |
• |
✔ |
26 Sep 2013 |
• |
||||
Cell Therapies Pty Ltd |
C |
✔ |
13 Aug 2013 |
• |
||||
Peter MacCallum Cancer Foundation |
• |
✔ |
6 Sep 2013 |
• |
||||
Peter MacCallum Cancer Foundation Ltd |
C |
✔ |
6 Sep 2013 |
• |
||||
Queen Elizabeth Centre |
• |
✔ |
4 Sep 2013 |
• |
||||
Royal Children's Hospital |
• |
✔ |
29 Aug 2013 |
• |
||||
Communities That Care Limited |
C |
✔ |
21 Aug 2013 |
• |
||||
Royal Children's Hospital Education Institute Ltd |
C |
✔ |
16 Aug 2013 |
• |
||||
Royal Children's Hospital Foundation Trust Funds |
• |
✔ |
3 Sep 2013 |
• |
||||
Royal Victoria Eye and Ear Hospital |
• |
✔ |
27 Aug 2013 |
• |
||||
Royal Women's Hospital |
• |
✔ |
6 Sep 2013 |
• |
||||
Royal Women's Hospital Foundation Limited |
C |
✔ |
6 Sep 2013 |
• |
||||
Royal Women's Hospital Foundation Trust Fund |
• |
✔ |
6 Sep 2013 |
• |
||||
St. Vincent's Hospital (Melbourne) Limited |
C |
✔ |
28 Aug 2013 |
• |
||||
Equity Health Pty Ltd |
C |
✔ |
26 Sep 2013 |
• |
||||
Tweddle Child and Family Health Services |
• |
✔ |
13 Sep 2013 |
• |
||||
Victoria Comprehensive Cancer Centre |
• |
✔ |
10 Sep 2013 |
• |
||||
Victoria Comprehensive Cancer Centre Ltd |
C |
✔ |
10 Sep 2013 |
• |
||||
Western Health |
• |
✔ |
30 Aug 2013 |
• |
||||
Western Health Foundation Limited |
C |
✔ |
18 Oct 2013 |
• |
||||
2012–13 Total number of entities = 35 |
21 |
14 |
34 |
1 |
||||
Per cent |
97 |
3 |
||||||
2011–12 Total number of entities = 36 |
21 |
15 |
34 |
2 |
||||
Per cent |
94 |
6 |
||||||
Note: Non-FMA
audit types: C – Corporations Act 2001
and O – other reporting framework.
Source: Victorian
Auditor-General's Office.
Regional hospitals and associated entities
Audit type |
Financial report |
Finalised within statutory time frame |
||||||
|---|---|---|---|---|---|---|---|---|
Entity |
FMA |
Non-FMA |
Clear opinion issued |
Auditor-General's report signed |
Met |
Not met |
||
COMPLETED AUDITS WITHIN 30 JUNE 2013 BALANCE DATES |
||||||||
Albury Wodonga Health |
• |
✔ |
12 Sep 2013 |
• |
||||
Bairnsdale Regional Health Service |
• |
✔ |
28 Aug 2013 |
• |
||||
Ballarat Health Services |
• |
✔ |
27 Aug 2013 |
• |
||||
Barwon Health |
• |
✔ |
27 Aug 2013 |
• |
||||
Bendigo Health Care Group |
• |
✔ |
29 Aug 2013 |
• |
||||
Central Gippsland Health Service |
• |
✔ |
29 Aug 2013 |
• |
||||
Echuca Regional Health |
• |
✔ |
9 Sep 2013 |
• |
||||
Echuca Regional Health Foundation Trust Fund |
• |
✔ |
5 Sep 2013 |
• |
||||
Echuca Regional Health Foundation Limited |
C |
✔ |
5 Sep 2013 |
• |
||||
Goulburn Valley Health |
• |
✔ |
28 Aug 2013 |
• |
||||
Latrobe Regional Hospital |
• |
✔ |
3 Sep 2013 |
• |
||||
Northeast Health Wangaratta |
• |
✔ |
28 Aug 2013 |
• |
||||
South West Healthcare |
• |
✔ |
4 Sep 2013 |
• |
||||
Swan Hill District Hospital |
• |
✔ |
28 Aug 2013 |
• |
||||
West Wimmera Health Service |
• |
✔ |
6 Sep 2013 |
• |
||||
Western District Health Service |
• |
✔ |
27 Aug 2013 |
• |
||||
Wimmera Health Care Group |
• |
✔ |
4 Sep 2013 |
• |
||||
2012–13 Total number of entities = 17 |
16 |
1 |
17 |
0 |
||||
Per cent |
100 |
0 |
||||||
2011–12 Total number of entities = 17 |
16 |
1 |
17 |
0 |
||||
Per cent |
100 |
0 |
||||||
Note: Non-FMA
audit types: C – Corporations Act 2001
and O – other reporting framework.
Source: Victorian
Auditor-General's Office.
Rural hospitals and associated entities
Audit type |
Financial report |
Finalised within statutory time frame |
||||||
|---|---|---|---|---|---|---|---|---|
Entity |
FMA |
Non-FMA |
Clear opinion issued |
Auditor-General's report signed |
Met |
Not met |
||
COMPLETED AUDITS WITHIN 30 JUNE 2013 BALANCE DATES |
||||||||
Alexandra District Hospital |
• |
✔ |
29 Aug 2013 |
• |
||||
Alpine Health |
• |
✔ |
2 Sep 2013 |
• |
||||
Bass Coast Regional Health |
• |
✔ |
13 Sep 2013 |
• |
||||
Beaufort and Skipton Health Services |
• |
✔ |
3 Sep 2013 |
• |
||||
Beaufort and Skipton Health Services Foundation Ltd |
C |
✔ |
3 Sep 2013 |
• |
||||
Beechworth Health Service |
• |
✔ |
28 Aug 2013 |
• |
||||
Benalla and District Memorial Health |
• |
✔ |
27 Aug 2013 |
• |
||||
Boort District Hospital |
• |
✔ |
27 Aug 2013 |
• |
||||
Casterton Memorial Hospital |
• |
✔ |
28 Aug 2013 |
• |
||||
Castlemaine Health |
• |
✔ |
30 Aug 2013 |
• |
||||
Cobram District Hospital |
• |
✔ |
30 Aug 2013 |
• |
||||
Cohuna District Hospital |
• |
✔ |
23 Aug 2013 |
• |
||||
Cohuna Community Nursing Home Inc. |
O |
✔ |
23 Aug 2013 |
• |
||||
Colac Area Health |
• |
✔ |
10 Sep 2013 |
• |
||||
Djerriwarrh Health Services |
• |
✔ |
29 Aug 2013 |
• |
||||
Dunmunkle Health Service |
• |
✔ |
3 Sep 2013 |
• |
||||
East Grampian Health Service |
• |
✔ |
29 Aug 2013 |
• |
||||
East Grampians Health Building for the Future Foundation |
• |
✔ |
28 Aug 2013 |
• |
||||
East Wimmera Health Service |
• |
✔ |
27 Aug 2013 |
• |
||||
Edenhope and District Hospital |
• |
✔ |
27 Aug 2013 |
• |
||||
Gippsland Southern Health Service |
• |
✔ |
3 Sep 2013 |
• |
||||
Heathcote Health |
• |
✔ |
10 Sep 2013 |
• |
||||
Hepburn Health Service |
• |
✔ |
26 Aug 2013 |
• |
||||
Hesse Rural Health Service |
• |
✔ |
2 Sep 2013 |
• |
||||
Winchelsea Hostel and Nursing Home Society |
• |
✔ |
30 Aug 2013 |
• |
||||
Heywood Rural Health |
• |
✔ |
27 Aug 2013 |
• |
||||
Inglewood and Districts Health Service |
• |
✔ |
28 Aug 2013 |
• |
||||
Kerang District Health |
• |
✔ |
28 Aug2013 |
• |
||||
Kilmore and District Hospital |
• |
✔ |
4 Sep 2013 |
• |
||||
Kooweerup Regional Health Service |
• |
✔ |
13 Sep 2013 |
• |
||||
Kyabram and District Health Service |
• |
✔ |
27 Aug 2013 |
• |
||||
Kyneton District Health Service |
• |
✔ |
11 Sep 2013 |
• |
||||
LMHA Network Ltd |
C |
✔ |
8 Oct2013 |
• |
||||
Lorne Community Hospital |
• |
✔ |
4 Sep 2013 |
• |
||||
Maldon Hospital |
• |
✔ |
28 Aug 2013 |
• |
||||
Mallee Track Health and Community Services |
• |
✔ |
6 Sep 2013 |
• |
||||
Mansfield District Hospital |
• |
✔ |
28 Aug 2013 |
• |
||||
Maryborough District Health Service |
• |
✔ |
4 Sep 2013 |
• |
||||
Moyne Health Services |
• |
✔ |
27 Aug 2013 |
• |
||||
Nathalia District Hospital |
• |
✔ |
27 Aug 2013 |
• |
||||
Numurkah District Health Service |
• |
✔ |
4 Sep 2013 |
• |
||||
Omeo District Hospital |
• |
✔ |
20 Aug 2013 |
• |
||||
Orbost Regional Health |
• |
✔ |
4 Sep 2013 |
• |
||||
Otway Health & Community Services |
• |
✔ |
28 Aug 2013 |
• |
||||
Portland District Health |
• |
✔ |
3 Sep 2013 |
• |
||||
Robinvale District Health Service |
• |
✔ |
27 Aug 2013 |
• |
||||
Rochester and Elmore District Health Service |
• |
✔ |
27 Aug 2013 |
• |
||||
Rural Northwest Health |
• |
✔ |
6 Sep 2013 |
• |
||||
Seymore District Memorial Hospital |
• |
✔ |
28 Aug 2013 |
• |
||||
South Gippsland Hospital |
• |
✔ |
10 Sep 2013 |
• |
||||
Stawell Regional Health |
• |
✔ |
4 Sep 2013 |
• |
||||
Stawell Regional Health Foundation |
• |
✔ |
4 Sep 2013 |
• |
||||
Tallangatta Health Service |
• |
✔ |
9 Sep 2013 |
• |
||||
Terang and Mortlake Health Service |
• |
✔ |
27 Aug 2013 |
• |
||||
Timboon and District Healthcare Service |
• |
✔ |
27 Aug 2013 |
• |
||||
Upper Murray Health and Community Services |
• |
✔ |
9 Sep 2013 |
• |
||||
West Gippsland Healthcare Group |
• |
✔ |
30 Aug 2013 |
• |
||||
Yarram and District Health Service |
• |
✔ |
5 Sep 2013 |
• |
||||
Yarrawonga District Health Service |
• |
✔ |
28 Aug 2013 |
• |
||||
Yea and District Memorial Hospital |
• |
✔ |
29 Aug 2013 |
• |
||||
2012–13 Total number of entities = 60 |
57 |
3 |
59 |
1 |
||||
Per cent |
98 |
2 |
||||||
2011–12 Total number of entities = 60 |
57 |
3 |
60 |
0 |
||||
Per cent |
100 |
0 |
||||||
Note: Non-FMA
audit types: A – Associations
Incorporation Act 1981, C – Corporations
Act 2001 and O – other reporting framework.
Source: Victorian
Auditor-General's Office.
Appendix C. Financial audit frameworks
Financial reporting framework
The principal legislation governing financial reporting by public hospitals are the Financial Management Act 1994 and the Corporations Act 2001.
Figure C1 sets out the legislative framework for each type of entity within the public hospital sector.
Figure C1
Legislative framework for public hospitals and associated entities
|
Legislative framework |
Public hospitals |
Entities controlled by public hospitals |
Other associated entities |
Total |
|---|---|---|---|---|
|
Financial Management Act 1994 |
85 |
8 |
1 |
94 |
|
Corporations Act 2001 |
2 |
12 |
2 |
16 |
|
No applicable legislative framework |
– |
2 |
– |
2 |
|
Total |
87 |
22 |
3 |
112 |
Source: Victorian Auditor-General's Office.
Internal control framework
Figure C2 identifies the main components of an effective internal control framework.
Figure C2
Components of an internal control framework
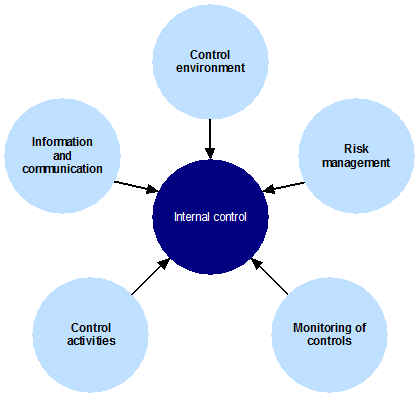
Source: Victorian Auditor-General's Office.
In the diagram:
- the control environment provides the fundamental discipline and structure for the controls and includes governance and management functions and the attitudes, awareness, and actions of those charged with governance and management of an entity
- risk management involves identifying, analysing and mitigating risks
- monitoring of controls involves observing the internal controls in practice and assessing their effectiveness
- control activities are policies, procedures and practices prescribed by management to help meet an entity's objectives
- information and communication involves communicating control responsibilities throughout the entity and providing information in a form and time frame that allows officers to discharge their responsibilities.
Financial report preparation
Our assessment of hospital financial report preparation against better practice was based on criteria outlined in Figure C3.
Figure C3
Financial report preparation better practice
|
Key area |
Better practice |
|---|---|
|
Financial report preparation plan |
Establish a plan that outlines the processes, resources, milestones, oversight, and quality assurance practices required in preparing the financial report. |
|
Preparation of shell statements |
Prepare a shell financial report and provide it to the auditors early to enable early identification of amendments, minimising the need for significant disclosure changes at year-end. |
|
Materiality assessment |
Assess materiality, including quantitative and qualitative thresholds, at the planning phase in consultation with the audit committee. The assessment assists preparers to identify potential errors in the financial report. |
|
Monthly financial reporting |
Adopt full accrual monthly reporting to assist in preparing the annual financial report. This allows the year-end process to be an extension of the month-end process. |
|
Quality control and assurance procedures |
Require rigorous review of the supporting documentation, data and the financial report itself by an appropriately experienced and independent officer prior to providing it to the auditors. |
|
Supporting documentation |
Prepare high-standard documentation to support and validate the financial report and provide a management trail. |
|
Analytical reviews |
Undertake rigorous and objective analytical review during the financial report preparation process to help to improve the accuracy of the report. |
|
Reviews of controls/ self-assessment |
Establish sufficiently robust quality control and assurance processes to provide assurance to the audit committee on the accuracy and completeness of the financial report. |
|
Competency of staff |
The preparers of the financial report have a good understanding of, and experience in, applying relevant accounting standards and legislation. They also have effective project management and interpersonal skills. |
|
Financial compliance reviews |
Undertake periodic compliance reviews to identify areas of noncompliance or changes to legislation that impact the financial report. |
|
Adequate security |
Protect and safeguard sensitive information throughout the process to prevent inappropriate public disclosure. |
Source: Victorian Auditor-General's Office, and Australian National Audit Office Better Practice Guide: Preparation of Financial Statements, June 2009.
Appendix D. Financial sustainability indicators and criteria
Indicators of financial sustainability
This Appendix sets out the financial indicators used in this report. The indicators should be considered collectively and are more useful when assessed over time, as part of a trend analysis. The indicators have been applied to the published financial information of the 87 public hospitals for the five-year period 2008–09 to 2012–13.
The analysis of financial sustainability in this report reflects on the position of each individual hospital, the sector as a whole and on the basis of the three categories of public hospital—metropolitan, regional and rural.
The financial sustainability indicators are outlined below.
Figure D1
Financial sustainability indicators
|
Indicator |
Formula |
Description |
|---|---|---|
Underlying result (%) |
Adjusted net result / Total underlying revenue |
A positive result indicates a surplus, and the larger the percentage, the stronger the result. A negative result indicates a deficit. Operating deficits cannot be sustained in the long term. Underlying revenue does not take into account one‑off or non-recurring transactions. Net result and total underlying revenue is obtained from the comprehensive operating statement. |
Liquidity (ratio) |
Current assets / Current liabilities |
This measures the ability to pay existing liabilities in the next 12 months. A ratio of one or more means there are more cash and liquid assets than short-term liabilities. Current liabilities exclude long-term employee provisions and revenue in advance. |
Average number of days cash available (days) |
Unrestricted cash / (Total annual operating cash outflows / 365) |
This measures the number of days of operating expenses that a hospital could pay with its current cash available. Unrestricted cash available includes cash equivalents that can be easily converted to cash and excludes cash held where the use has been restricted—such as patient money held in trust or cash required to be used for a specific purpose. |
Self-financing (%) |
Net operating cash flows / Total underlying revenue |
This measures the ability to replace assets using cash generated by the entity's operations. The higher the percentage the more effectively this can be done. Net operating cash flows are obtained from the cash flow statement. |
Capital replacement (ratio) |
Cash outflows for property, plant and equipment / Depreciation |
Comparison of the rate of spending on infrastructure with an entity's depreciation. Ratios higher than 1:1 indicate that spending is greater than the depreciating rate. This is a long-term indicator, as capital expenditure can be deferred in the short term if there are insufficient funds available from operations, and borrowing is not an option. Cash outflows for infrastructure are taken from the cash flow statement. Depreciation is taken from the comprehensive operating statement. |
Source: Victorian Auditor-General's Office.
Financial sustainability risk assessment criteria
The financial sustainability of public hospitals has been assessed using the risk assessment criteria outlined in Figure D2.
Figure D2
Financial sustainability indicators—risk assessment criteria
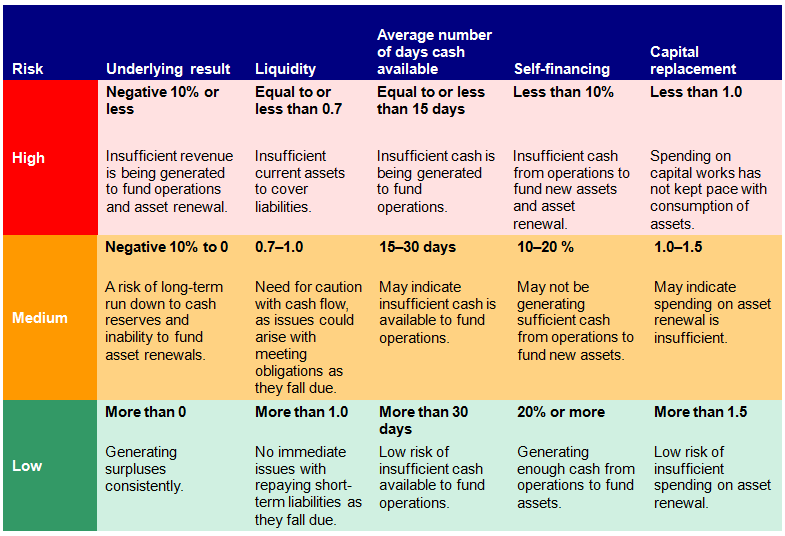
Source: Victorian Auditor-General's Office.
The overall financial sustainability risk assessment is calculated using the ratings determined for each indicator as outlined in Figure D3. The assessment is performed at the sector level, at the metropolitan, regional and rural category level and at the individual hospital level.
Figure D3
Overall financial sustainability risk assessment
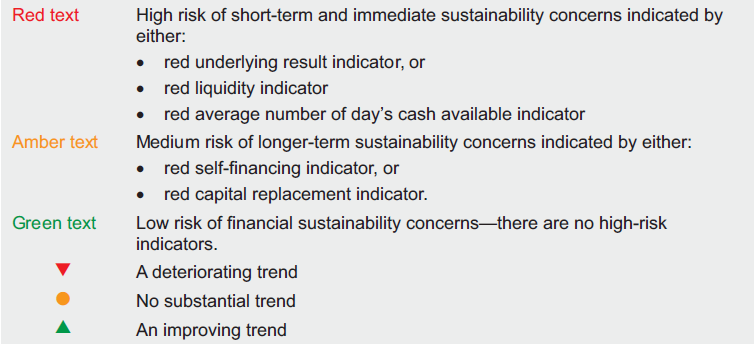
Source:Victorian Auditor-General's Office.
To be financially sustainable, hospitals must be able to meet their short-term financial obligations, and maintain some excess capacity to finance future capital and infrastructure development. As detailed in Figure D3, shorter-term and immediate sustainability concerns are assessed as high risk, and longer-term sustainability concerns are assessed as medium risk.
Metropolitan hospitals
Figure D4
Underlying result, 2009–13
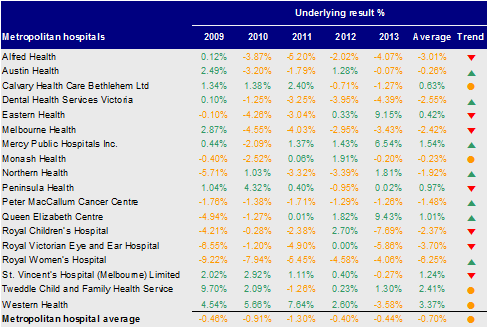
Source: Victorian Auditor-General's Office.
Figure D5
Liquidity, 2009–13
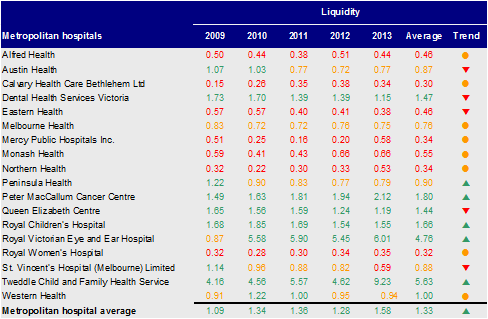
Source: Victorian Auditor-General's Office.
Figure D6
Average number of days cash available, 2009–13
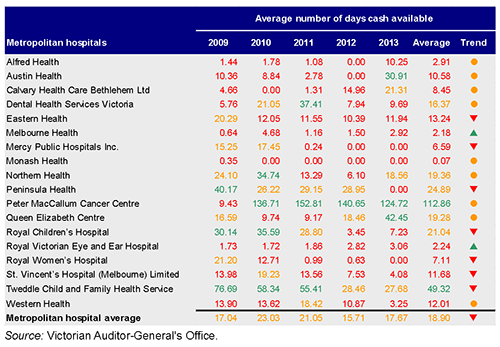
Source: Victorian Auditor-General's Office.
Figure D7
Self-financing, 2009–13
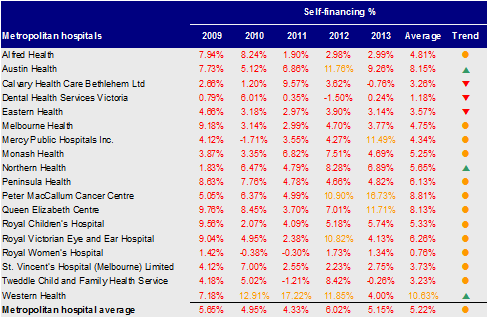
Source: Victorian Auditor-General's Office.
Figure D8
Capital replacement, 2009–13
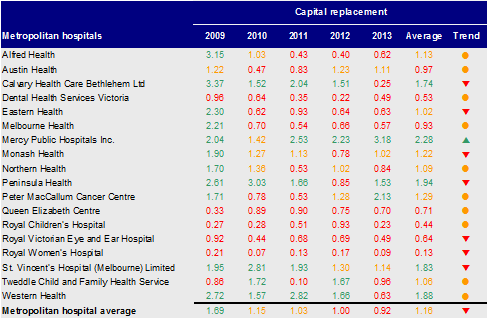
Source: Victorian Auditor-General's Office.
Regional hospitals
Figure D9
Underlying result, 2009–13
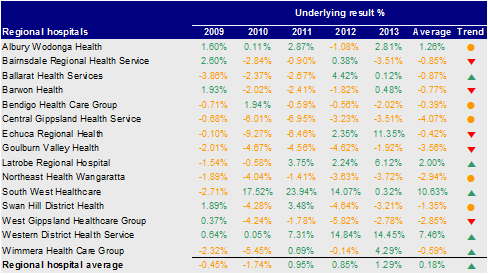
Source: Victorian Auditor-General's Office.
Figure D10
Liquidity, 2009–13
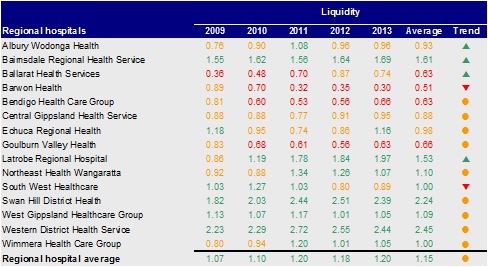
Source: Victorian Auditor-General's Office.
Figure D11
Average number of days cash available, 2009–13
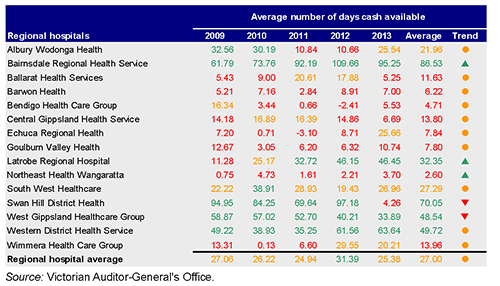
Source: Victorian Auditor-General's Office.
Figure D12
Self-financing, 2009–13
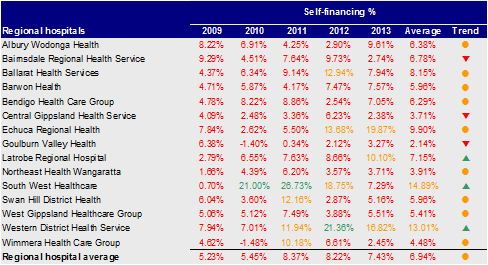
Source: Victorian Auditor-General's Office.
Figure D13
Capital replacement, 2009–13
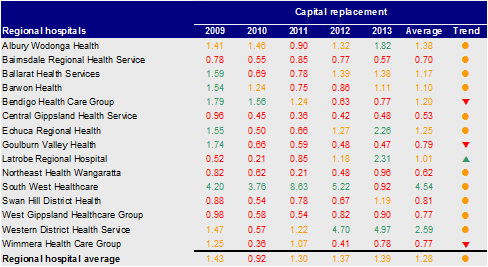
Source: Victorian Auditor-General's Office.
Rural hospitals
Figure D14
Underlying result, 2009–13
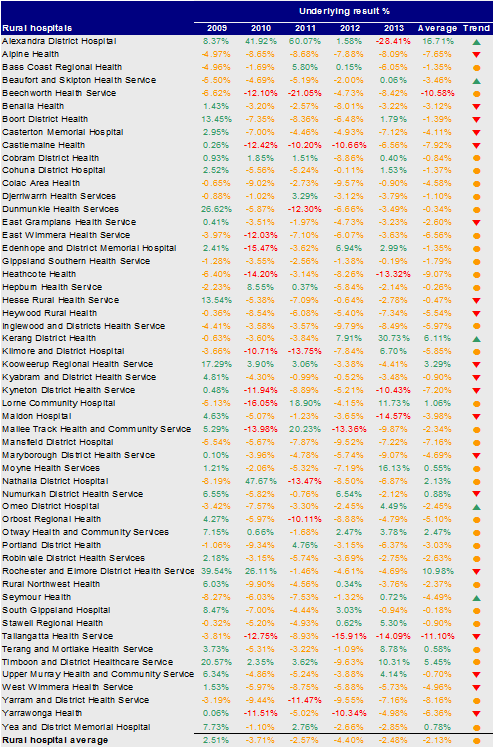
Source: Victorian Auditor-General's Office.
Figure D15
Liquidity, 2009–13
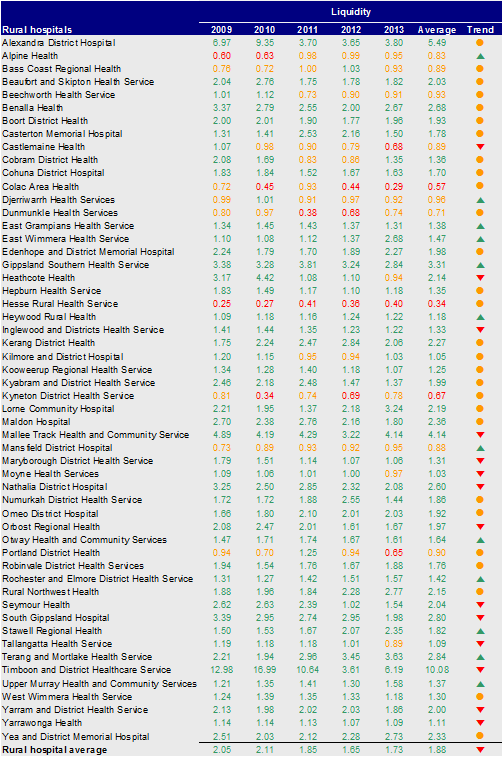
Source: Victorian Auditor-General's Office.
Figure D16
Average number of days cash available, 2009–13
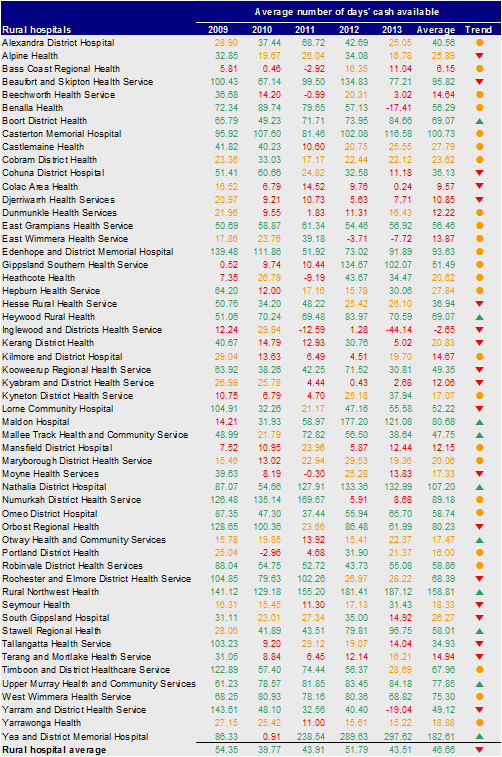
Source: Victorian Auditor-General's Office.
Figure D17
Self-financing, 2009–13
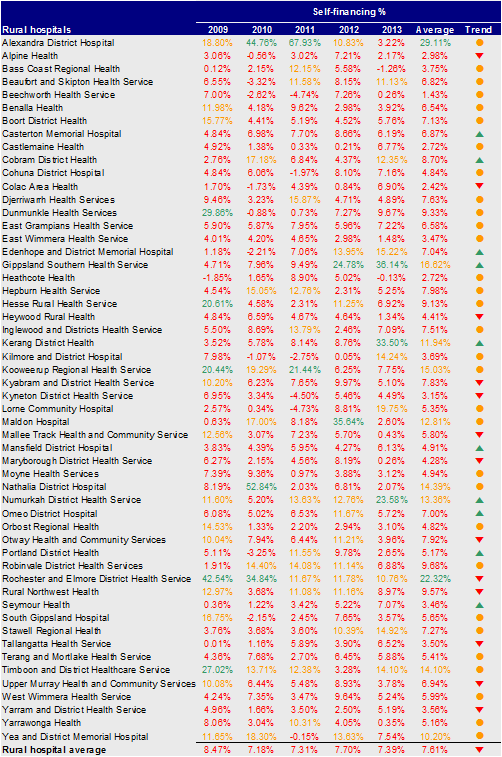
Source: Victorian Auditor-General's Office.
Figure D18
Capital replacement, 2009–13
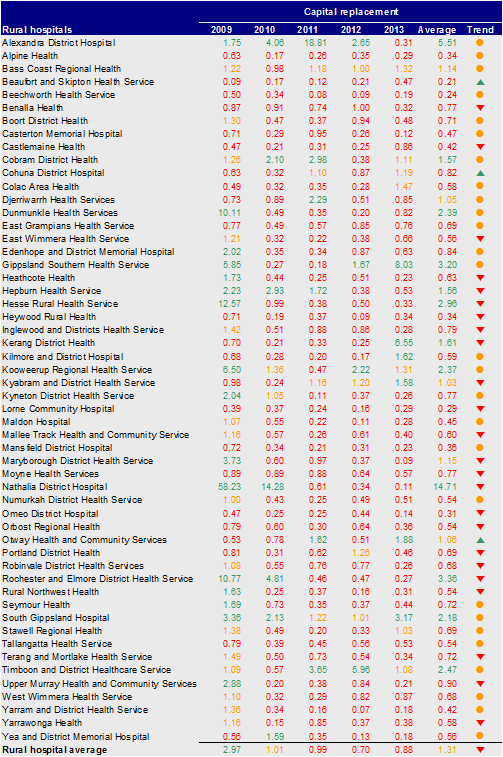
Source: Victorian Auditor-General's Office.
Appendix E. Glossary
Accountability
Responsibility of public sector entities to achieve their objectives, with regard to reliability of financial reporting, effectiveness and efficiency of operations, compliance with applicable laws, and reporting to interested parties.
Asset useful life
The period over which an asset is expected to provide the entity with economic benefits. Depending on the nature of the asset, the useful life can be expressed in terms of time or output.
Asset valuation
The fair value of a non-current asset on a particular date.
Asset
A resource controlled by an entity as a result of past events, and from which future economic benefits are expected to flow to the entity.
Audit Act 1994
An Act of the State of Victoria that establishes the:
- operating powers and responsibilities of the Auditor-General
- the operation of his office—the Victorian Auditor-General's Office (VAGO)
- nature and scope of audits conducted by VAGO
- relationship of the Auditor-General with the Public Accounts and Estimates Committee as the representative body of Parliament
- Auditor-General's accountability to Parliament for discharge of the position's responsibilities.
Capital expenditure
Amount capitalised to the balance sheet for contributions by a public sector entity to major assets owned by the entity, including expenditure on:
- capital renewal of existing assets that returns the service potential or the life of the asset to that which it had originally
- capital expansion which extends an existing asset at the same standard to a new group of users.
Capital grant
Government funding given to an agency for the purpose of acquisition of capital assets such as buildings, land or equipment.
Clear audit opinion
A positive written expression provided when the financial report has been prepared and presents fairly the transactions and balances for the reporting period in accordance with the requirements of the relevant legislation and Australian accounting standards.
Also referred to as an unqualified audit opinion.
Clearly trivial item
Matters that are clearly inconsequential, whether taken individually or in aggregate and whether judged by any criteria of size, nature or circumstances. The accumulation of such amounts clearly would not have a material effect on the financial report.
Corporations Act 2001
An Act of the Commonwealth of Australia that sets out the laws dealing with business entities in Australia at federal and interstate levels. It focuses primarily on companies, although it also covers some laws relating to other entities such as partnerships and managed investment schemes.
Deficit
Total expenditure exceeds total revenue resulting in a loss.
Depreciation
The systematic allocation of a fixed asset's capital value as an expense over its expected useful life to take account of normal usage, obsolescence, or the passage of time.
Entity
A body whether corporate or unincorporated that has a public function to exercise on behalf of the state or is wholly owned by the state, including: departments, statutory authorities, statutory corporations and government business enterprises.
Expense
Outflows or other depletions of economic benefits in the form of incurrence of liabilities or depletion of assets of the entity, other than those relating to contributions by owners, that results in a decrease in equity during the reporting period.
Financial asset
Any asset that is:
- cash
- an equity instrument of another entity
- a contractual right:
- to receive cash or another financial asset from another entity, or
- to exchange financial assets or financial liabilities with another entity under conditions that are potentially favourable to the entity
- a contract that will or may be settled in the entity's own equity instruments and is:
- a non derivative for which the entity is or may be obliged to receive a variable number of the entity's own equity instruments, or
- a derivative that will or may be settled other than by the exchange of a fixed amount of cash or another financial asset for a fixed number of the entity's own equity instruments.
Financial instrument
A contract that gives rise to a financial asset of one entity and a financial liability or equity instrument of another entity.
Financial Management Act 1994
An Act of the State of Victoria that establishes the financial administration and accountability of the public sector, as well as annual reporting to the Parliament by all departments and public sector entities.
Financial report
Structured representation of the financial information, which usually includes accompanying notes, derived from accounting records and intended to communicate an entity's economic resources or obligations at a point in time or the changes therein for a period in accordance with a financial reporting framework.
Financial sustainability
An entity's ability to manage financial resources so it can meet spending commitments, both at present and into the future.
Financial year
The period of 12 months for which a financial report (and performance report) is prepared.
Going concern
An entity which is expected to be able to pay its debts as and when they fall due, and continue in operation without any intention or necessity to liquidate or otherwise wind up its operations.
Governance
The control arrangements in place that are used to govern and monitor an entity's activities, in order to achieve its strategic and operational goals.
Internal audit
A function of an entity's governance framework that examines and reports to management on the effectiveness of risk management, control and governance processes.
Internal control
Processes affected by an entity's structure, work and authority flows, people and management information systems, designed to assist the entity accomplish specific goals and objectives. Internal controls are a means by which an entity's resources are directed, monitored and measured. It plays an important role in preventing and detecting error and fraud and protecting the entity's resources.
Investment
The expenditure of funds intended to result in medium to long-term service and/or financial benefits arising from the development and/or use of infrastructure assets by either the public or private sectors.
Liability
A present obligation of the entity arising from past events, the settlement of which is expected to result in an outflow of resources from the entity.
Masterfile
A database of records pertaining to one of the main subjects of an information system, such as customers, employees, and vendors. Masterfiles contain descriptive data that does not often change, such as name and address and bank account details.
Material error
An error which may result in the omission or misstatement of information that could influence the economic decision of users taken on the basis of the financial statements. Materiality depends on the size and nature of the omission or misstatement judged in the surrounding circumstances.
Net assets
Residual interest in the assets of the entity after deduction of its liabilities.
Net result
Calculated by subtracting an entity's total expenses from its total revenue, to show what the entity has earned or lost in a given period of time.
Public private partnership
A public private partnership (PPP) is a long-term contract between the public and private sectors where government pays the private sector to deliver infrastructure and related services on behalf, or in support, of government's broader service responsibilities. PPPs typically make the private sector parties who build infrastructure responsible for its condition and performance on a whole-of-life basis.
Revaluation
Recognising a reassessment of values for non-current assets at a particular point in time.
Revenue
Inflows of funds or other enhancements or savings in outflows of service potential, or future economic benefits in the form of increases in assets or reductions in liabilities of the entity, other than those relating to contributions by owners which result in an increase in equity during the reporting period.
Risk
The chance of a negative impact on the objectives, outputs or outcomes of the entity.
Stakeholder
A person, group, or organisation that has direct or indirect stake in an organisation because it can affect or be affected by the organisation's actions, objectives and policies.
Surplus
Total revenue exceeds total expenditure resulting in a profit.
Appendix F. Audit Act 1994 section 16—submissions and comments
Introduction
In accordance with section 16A and 16(3) of the Audit Act 1994, a copy of this report, or relevant extracts from the report, was provided to the Department of Health and named hospitals with a request for submissions or comments.
The submission and comments provided are not subject to audit nor the evidentiary standards required to reach an audit conclusion. Responsibility for the accuracy, fairness and balance of those comments rests solely with the agency head.
Responses were received as follows:
RESPONSE provided by the Secretary, Department of Health
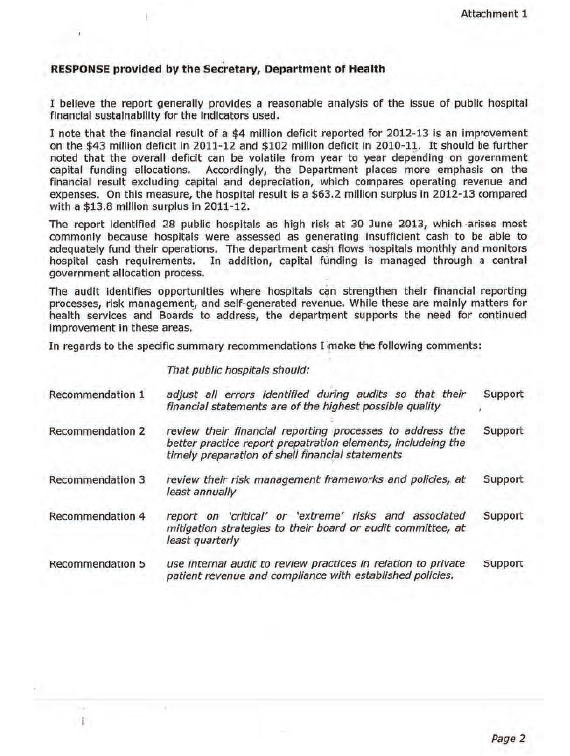
RESPONSE provided by the Chief Executive, Yarram + District Health Service

RESPONSE provided by the Chief Executive, Western Health
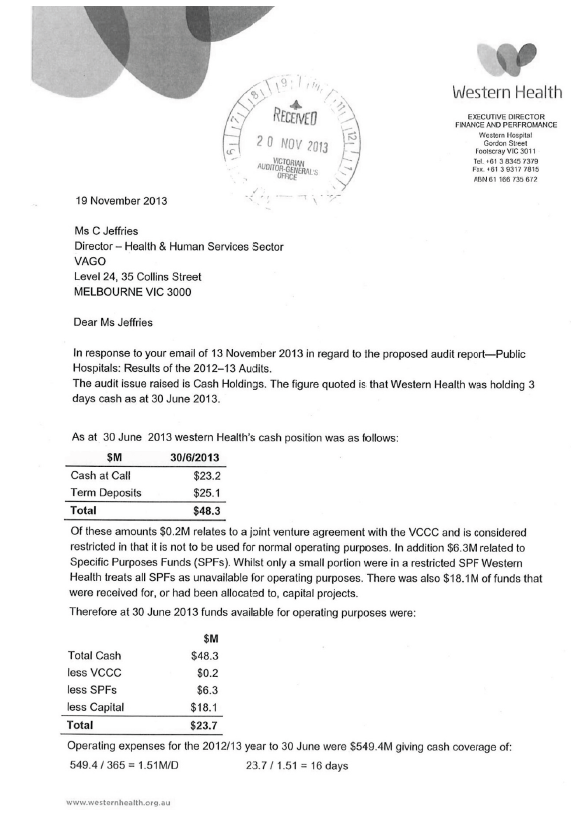
RESPONSE provided by the Chief Executive, Alfred Health