Public Hospitals: Results of the 2013–14 Audits
Overview
This report covers the results of the financial audits of 110 entities within the public hospital sector, comprising 87 public hospitals and the 23 associated entities. It informs Parliament about significant issues arising from the 2013–14 financial audits and complements the assurance provided through audit opinions included in the entities’ annual reports. The report also looks at public hospital financial results, financial sustainability and targeted areas of internal controls related to internal audit and asset maintenance functions.
Parliament can have confidence in the 2013–14 financial statements of the 87 public hospitals, and their 23 associated entities, as all were given unmodified audit opinions.
Public hospitals continue to face challenges in delivering quality health services to the public due to increasing demand, an ageing population, and limited funding streams. Our overall assessment of public hospitals at 30 June 2014 indicated that many had significant financial sustainability risks that need addressing.
These financial sustainability risks have been highlighted in previous reports from this office on public hospitals, which have consistently shown that the current funding model has resulted in a clear mismatch between public hospital boards' responsibilities for the sustainable management and provision of services, and the boards' ability to control the funding they receive to enable them to do this.
Public Hospitals: Results of the 2013–14 Audits: Message
Ordered to be published
VICTORIAN GOVERNMENT PRINTER February 2015
PP No 7, Session 2014–15
President
Legislative Council
Parliament House
Melbourne
Speaker
Legislative Assembly
Parliament House
Melbourne
Dear Presiding Officers
Under the provisions of section 16AB of the Audit Act 1994, I transmit my report on Public Hospitals: Results of the 2013–14 Audits.
This report summarises the results of the financial audits of 87 Victorian public hospitals and 23 associated entities at 30 June 2014.
It informs Parliament about significant issues identified during our audits and complements the assurance provided through individual audit opinions included in the entities' annual reports.
The report highlights the sector's financial sustainability risks and financial results. It also found that public hospitals can improve their asset management and internal audit arrangements.
Yours faithfully

John Doyle
Auditor-General
25 February 2015
Auditor-General's comments
 John Doyle Auditor-General |
Audit team Charlotte Jeffries—Sector Director Helen Grube—Team Leader Peter Georgiou, Janelle Birch, Patricia Duong, Siu Fa Lau and Anh Ha—Team members Engagement Quality Control Reviewer Craig Burke |
Public hospitals are responsible for the management and delivery of essential public health services across the metropolitan, regional and rural sectors of the state. Parliament can have confidence in the 2013–14 financial statements of the 87 public hospitals, and their 23 associated entities, as all were given unmodified audit opinions. It is pleasing to note that financial reporting by public hospitals was generally more timely and accurate in 2013–14 than the prior year.
However, public hospital management teams had not resolved 30 per cent of the 358 internal control weaknesses identified and reported to their boards by my audit teams during the 2012–13 audits, or earlier. This lack of timely resolution means that the control frameworks in place at these entities are not as effective as they should be. Management should seek to address all issues raised by my office on a timely basis.
Public hospitals continue to face challenges in delivering quality health services to the public due to increasing demand, an ageing population, and limited funding streams. To be financially sustainable, hospitals need to be able to meet their current and future expenditure requirements as they fall due, and to maintain and replace their assets as required.
Our assessment of public hospitals at 30 June 2014 indicated that many had significant financial sustainability risks. These risks in part arise from the tight cash position in which many public hospitals operate. This is illustrated by 12 public hospitals only holding enough cash at 30 June 2014 to fund their operations for seven days or less. If these hospitals did not receive a grant payment within this period they would be required to access other funding sources, which include seeking a recallable grant from the department.
The financial sustainability risks of public hospitals have been highlighted in previous reports from this office. These reports have consistently shown that the current funding model has resulted in a mismatch between public hospital boards' responsibilities for the sustainable management and provision of health services—and the boards' limited ability to control the funding they receive, particularly from the department, to enable them to do this. This mismatch needs to be addressed as it blurs accountability for the financial performance of public hospitals.
John Doyle
Auditor-General
February 2015
Audit Summary
This report presents the outcomes and observations from the financial audits of the 87 public hospitals and 23 associated entities for the financial year ended 30 June 2014. These entities are responsible for the delivery of public health services across metropolitan, regional and rural Victoria.
The report summarises the results of the financial audits of the 110 entities and provides an analysis of the timeliness and accuracy of financial reporting by these entities. It also assesses the financial sustainability risks that the 110 entities face, and informs Parliament about issues identified during our review of internal audit and asset maintenance functions at the 87 public hospitals.
Over the 2013–14 financial year, the 87 public hospitals were collectively responsible for $12.6 billion of expenditure in delivering public health care services, and delivered an overall, but marginal, surplus for the sector of $235 million.
Conclusions
Parliament can have confidence in the financial reports of the 87 public hospitals and 23 associated entities, as all financial reports were given unmodified audit opinions. The financial reports prepared by public hospitals and their associated entities were also generally timely and accurate.
However, there are still concerns regarding the financial sustainability risks of hospitals, with 32 hospitals—including some major metropolitan hospitals—requiring a letter of financial support from the former Department of Health, in order to be able to report as a going concern as at 30 June 2014. Further, 12 public hospitals held cash at 30 June 2014 that could only fund seven or less days of operating activity.
The current funding model has resulted in a mismatch between public hospital boards' responsibilities for the sustainable management and provision of health services; and the boards' limited ability to control the funding they receive, particularly from the department, to enable them to do this.
Seventy per cent of public hospitals had a poor capital replacement risk result as at 30 June 2014. This means that many hospitals, particularly in rural areas, are not renewing or replacing fixed assets at the pace at which they are consuming them. This means that services may be at risk in the future due to assets becoming obsolete.
Findings
Quality of reporting
Clear opinions were issued for all of the financial reports of the 87 public hospitals and 23 associated entities for the 2013–14 financial year. All 110 entities met their legislative reporting time frames, with public hospitals finalising their statements within an average of 7.3 weeks. This was an improvement of two weeks compared to the 30 June 2013 reporting period, due to efforts by management to complete the required work within the shortened timetable issued by the Department of Treasury and Finance.
The improvement in the timeliness of reporting was complemented by an improvement in the accuracy of the draft statements provided to audit, with only 51 material adjustments arising across the 110 entities, compared to 81 in the prior year. All material errors were adjusted prior to the audit opinion being signed.
Common reasons for the adjustments included errors in disclosures relating to the new Australian Accounting Standard AASB13 Fair Value Disclosures, and the updated Australian Accounting Standard AASB119 Employee Benefits.
General internal controls
Internal controls at public hospitals and associated entities were adequate for maintaining the reliability of external financial reporting.
Where weaknesses in internal controls are identified through our audits, these are reported to the board, audit committee and management through formal management letters. Across the 110 entities, however, a number of common weaknesses were identified. These included the need to improve the timely review of key reconciliations, and the need to ensure that there is always appropriate authorisation of supplier payments.
As part of our audit process, we followed up issues reported in our prior year management letters to confirm that management had sought to mitigate the risks regarding the control weaknesses identified. In our 2012–13 and earlier management letters, 358 items were raised across the 87 public hospitals. Of these, 106 items (30 per cent) had not been resolved by the time of our 2013–14 audit visit.
Financial sustainability risks
The 110 entities covered in this report are responsible for managing their finances so that they can deliver quality health care services to the state, while maintaining and renewing their fixed assets. To be financially sustainable, entities need to be able to meet their current and future expenditure requirements as they fall due.
This is particularly challenging as the 87 public hospitals and 23 associated entities are funded through a combination of government and other revenue. Over the 2013–14 financial year, these entities were collectively responsible for $12.6 billion of expenditure in delivering public health care services, and delivered a surplus for the sector of $235 million. Our overall financial sustainability assessment for the sector at 30 June 2014 is 'medium', which is consistent with our assessment last year. This indicates that there are concerns regarding the financial sustainability risks of many public hospitals.
Despite the overall financial results achieved by the sector in 2013–14, 32 public hospitals (28 in 2012–13) showed signs of financial stress, with a material uncertainty about their ability to continue as a going concern for financial reporting purposes. This means they are considered to be at risk of not being able to meet all their financial obligations over the next 12 months.
To mitigate this risk, the former Department of Health provided letters of financial support to these 32 public hospitals. The letters provide an undertaking by the department to provide adequate cash flows to the named hospital to enable them to meet their current and future financial obligations up to September 2015, if required. While this does not provide additional funding, it does mean that potential assistance is available if the public hospital faces financial difficulties.
Another concern is the tight cash environment in which public hospitals operate, with 12 public hospitals having cash at 30 June 2014 that could only fund seven or less days of operating activity. While this is an improvement on the prior year result of 23 public hospitals being in this position, it means that public hospitals are still at a significant risk of not being able to fund operating activities. Further, if these hospitals did not receive a grant payment during that 7 day period, they would be required to access other funding sources, which include seeking a recallable grant from the department.
In particular, we noted that 70 per cent of public hospitals have a poor capital replacement risk result. This means that many hospitals, particularly in rural areas, are not renewing fixed assets as they use them—as measured through depreciation. Where this is the case, public hospitals need to work with the Department of Health and Human Services to ensure that the quality of these assets—including buildings and medical equipment—does not degenerate to a point where the provision of services is put at risk.
As sector-wide asset revaluations occur every five years—and occurred in 2013–14—we expect an increase to the depreciation costs that will need to be met by public hospitals at 30 June 2015. The public hospitals' funding model does not progressively provide funding to public hospitals to match the depreciation of their assets.
The current funding model has resulted in a mismatch between public hospital boards' responsibilities for the sustainable management and provision of health services; and the boards' limited ability to control the funding they receive, particularly from the department, to enable them to do this.
Internal audit
Internal audit is a key mechanism available to the board of a public hospital to support the discharge of its governance and oversight responsibilities. During 2013–14, public hospitals collectively spent $4 million on their internal audit functions, this represented 0.03 per cent of overall expenditure in the sector. We reviewed the operations of internal audit in public hospitals during 2013–14.
Two public hospitals do not have an internal audit function—this is a breach of the Standing Directions of the Minister for Finance under the Financial Management Act 1994, and a significant shortcoming in internal control.
Of the remaining 85 public hospitals, the internal audit functions generally operate effectively and are able to provide independent, objective advice and assurance to audit committees, boards and management.
However, some areas for improvement were noted. In particular, public hospitals need to ensure that they have a policy to mitigate any potential or actual conflicts of interest that may arise, which could impact the independence of internal auditors. This policy guidance could be provided through the implementation of better practice internal audit charters.
Public hospitals should also work with their internal auditors to set audit plans that assist in providing assurance regarding all key risks that the entity faces. Our review noted that while detailed and approved audit plans were in place at many public hospitals, they did not align well with the risk registers of these entities. This means internal audit may be less effective at highlighting potential control weaknesses or poor processes in those areas of greatest risk.
The following key business activities have not been reviewed by internal audit across all public hospitals over the last three years:
- controls over cash management not reviewed at 34 public hospitals
- data security not reviewed at 34 public hospitals
- data quality not reviewed at 37 public hospitals
- controls over asset management not reviewed at 44 public hospitals.
Public hospital boards should ensure they have adequate assurance over the control frameworks in these areas.
Asset maintenance
As at 30 June 2014, public hospitals operated $11.9 billion of assets, which require ongoing maintenance. In 2013–14, public hospitals spent $232 million maintaining these assets ($212 million in 2012–13).
Overall, we found that public hospitals can make improvements to their asset maintenance strategies, procedures and oversight to enable them to make better informed decisions regarding the level and type of asset maintenance required.
We found that 48 public hospitals did not have a policy or strategy in place that addressed asset maintenance. Of these 48 public hospitals, the majority do not have regular or detailed internal reporting that addresses the adequacy of maintenance spending, risk management, funding plans or life cycle maintenance and costing.
Rural hospitals spend a significantly smaller proportion of their net asset base on asset maintenance, compared to the larger regional and metropolitan hospitals. Inadequate maintenance of assets means a public hospital is at risk of not being able to efficiently provide services.
Public hospitals need to implement adequate asset management policies to provide a framework for asset maintenance decisions, and should also undertake comprehensive asset condition assessments to fully inform asset maintenance plans.
Recommendations
That public hospital boards and management:
- review their financial reporting processes to address the better practice report preparation elements, including the timely preparation of shell financial statements
- address all issues raised in audit management letters on a timely basis, including ongoing concerns regarding the need to improve controls around key account reconciliations, the authorisation of supplier payments, and the regular review of financial and information technology policies
- through audit committees, implement appropriate monitoring mechanisms to ensure audit findings are resolved by management on a timely basis
- maintain good cash management processes to ensure that they are able to meet their financial obligations as they fall due, particularly for those public hospitals assessed as having a high liquidity risk
- work with the Department of Health and Human Services to ensure they are able to renew ageing assets as required to prevent any loss of services provided to the public.
That Dunmunkle Health Service and Casterton Memorial Hospital:
- establish and maintain an internal audit function.
That public hospital boards and management:
- have in place stand-alone internal audit charters that provide a clear framework for the selection, operation and oversight of the internal audit function.
- establish a process for the identification, communication, assessment and mitigation of conflicts of interest between internal audit and the public hospital
- work with their internal audit function to develop and implement a three-year audit plan that is approved by the audit committee, and which aligns with the risks identified in the hospital's risk register
- review their internal audit plan to ensure that the internal audit function is providing the level of assurance required
- undertake annual performance reviews of the internal audit function to ensure it continues to operate in line with the internal audit charter
- implement better practice asset management strategies to provide a framework for asset maintenance decisions
- undertake comprehensive asset condition assessments to enable individual asset maintenance plans to be created and actioned
- maintain comprehensive and appropriate information regarding asset maintenance requirements to assist in strategic asset management planning.
Submissions and comments received
In addition to progressive engagement during the course of the audit, in accordance with section 16(3) of the Audit Act 1994, a copy of this report, or relevant extracts from the report, was provided to the Department of Health and Human Services and named agencies with a request for submissions or comments.
We have considered those views in reaching our audit conclusions and have represented them to the extent relevant and warranted. Their full section 16(3) submissions and comments are included in Appendix F.
1 Background
1.1 Introduction
Public hospitals provide a range of services across metropolitan, regional and rural areas. Metropolitan and regional public hospitals typically provide acute health services, as well as a mix of mental health, sub-acute, community health services and aged care programs. Rural public hospitals generally offer a higher proportion of aged care and community health services.
This report summarises the results of the financial audits of 110 entities, comprising 87 public hospitals and their 23 associated entities. It is one of a suite of Parliamentary reports on the results of the 2013–14 financial audits conducted by VAGO. The full list of reports can be found in Appendix A of this report.
A breakdown of the 110 entities commented on in this report is set out in Figure 1A.
Figure 1A
Public hospitals and associated entities
|
Hospital category |
2014 |
2013 |
|---|---|---|
| Metropolitan | ||
|
Public hospitals |
18 |
18 |
|
Entities controlled by public hospitals |
15 |
15 |
|
Other associated entities(a) |
2 |
2 |
|
Subtotal |
35 |
35 |
| Regional | ||
|
Public hospitals |
15 |
15 |
|
Entities controlled by public hospitals |
0 |
2 |
|
Subtotal |
15 |
17 |
| Rural | ||
|
Public hospitals |
54 |
54 |
|
Entities controlled by public hospitals |
5 |
5 |
|
Other associated entities(a) |
1 |
1 |
|
Subtotal |
60 |
60 |
|
Total |
110 |
112 |
(a) Other associated entities are not directly controlled by a public hospital and generally comprise joint ventures or stand-alone associated not-for-profit entities, such as hospital foundations.
Source: Victorian Auditor-General's Office.
The reduction of two entities is due to the operations of the Echuca Trust and the Echuca Foundation being subsumed into Echuca Regional Health. Appendix B contains a list of the entities audited by VAGO.
1.2 Structure of this report
This report informs Parliament about the findings arising from the audits of Victorian public hospitals, and adds to the assurance provided through audit opinions on the financial statements included in the respective entities' annual reports.
The structure of this report and details covered in each Part are set out in Figure 1B.
Figure 1B
Report structure
|
Part |
Description |
|---|---|
|
Part 2: Quality of reporting |
Covers the results of the audits of the 2013–14 financial reports of the 87 public hospitals and 23 associated entities. It comments on the timeliness and quality of financial reporting against better practice. It also provides the results of our assessment of certain general internal controls at these entities. |
|
Part 3: Financial results |
Summarises and analyses the financial results of the 87 public hospitals, including financial performance for 2013–14. It also provides insight into the financial sustainability risks of the 87 public hospitals, based on trends in financial sustainability indicators over a five-year period. |
|
Part 4: Internal audit |
Assesses the internal audit function in each of the 87 public hospitals against a better practice framework. |
|
Part 5: Asset maintenance |
Assesses the policies, management practices, and governance and oversight arrangements in place at the 87 public hospitals against better practice. |
1.3 Audit of financial reports
An annual financial audit has two aims:
- to give an opinion consistent with section 9 of the Audit Act 1994, on whether the financial report is presented fairly in accordance with the relevant financial reporting framework
- to consider whether there has been wastage of public resources or a lack of probity or financial prudence in the management or application of public resources, consistent with section 3A(2) of the Audit Act 1994.
The financial audit framework applied in the conduct of the audits is set out in Appendix C.
1.3.1 Audit of internal controls relevant to the preparation of the financial report
Integral to the annual financial audit is an assessment of the adequacy of the internal control framework, and the governance processes related to an entity's financial reporting. In making this assessment, consideration is given to the internal controls relevant to the entity's preparation and fair presentation of the financial report, but this assessment is not used for the purpose of expressing an opinion on the effectiveness of the entity's internal control.
Internal controls are systems, policies and procedures that help an entity reliably and cost effectively meet its objectives. Sound internal controls enable the delivery of reliable, accurate and timely internal and external reporting.
An explanation of the internal control framework, and its main components, are set out in Appendix C. An entity's governing body is responsible for developing and maintaining its internal control framework.
Internal control weaknesses we identify during an audit do not usually result in a modified audit opinion because often an entity will have compensating controls in place that mitigate the risk of a material error in the financial report. Alternatively, additional audit procedures will also be conducted to mitigate any risks to the financial report identified as a result of the weakness.
Weaknesses in internal controls found during the audit of an entity are reported to its board, chief executive officer and audit committee in a management letter.
Our reports to Parliament raise systemic or common weaknesses identified during our assessments of internal controls over financial reporting, across a sector.
1.4 Public hospitals' funding framework
Prior to the 2012–13 financial year, Commonwealth grants for healthcare were made to the states and territories as National Healthcare Specific Purpose Payments (SPP). During 2012–13, reforms to the national health funding arrangements came into operation. The National Health Reform Agreement was introduced with an aim to give greater control over funding of public hospitals to the Commonwealth Government. The implementation of a nationally consistent approach to funding acute admitted services, emergency department services and non-admitted patient services began on 1 July 2012, and for the remaining non-admitted services, mental health and subacute services, on 1 July 2013. The funding basis used is an Activity Based Funding (ABF) approach which is equivalent to the SPP, and from 1 July 2014, will also include various forms of 'efficient growth' funding. This means that funding will not only be linked to the growth in hospital activity, but that Commonwealth funding will be indexed by the Consumer Price Index (CPI) and population growth each year.
Under this arrangement, ABF, which is provided through the pool account, involves the setting of a unit price for each type of medical or clinical activity, and agreement about the quantity of units to be provided by each of the hospitals. This forms the basis for calculating the funding to be provided under the health services' agreement (HSA) which is agreed to by each hospital and the respective state Minister for Health.
Block funding is also provided by the Victorian Minister for Health where appropriate, and is also set out in the annual HSA. Block funding is provided to hospitals when it is not technically possible to use ABF, or where there is an absence of economies of scale that mean some services would not be financially viable under ABF—this is mainly for regional and rural hospitals.
In 2012–13 and 2013–14, Commonwealth contributions to public hospitals in each state and territory were equivalent to the amount that would otherwise have been payable through the previous arrangements—these years were known as the transition years. From July 2014 to June 2017, funding will be linked to the level of services delivered by public hospitals. Each state's and territory's entitlement will be directly linked to the growth in public hospital activity provided in that jurisdiction. From 1 July 2017, the Commonwealth will also index its public hospitals' funding by CPI and population growth.
The National Health Funding Pool
Under these funding arrangements, state and territory governments remain responsible for the performance of public hospitals in their jurisdictions. However, Commonwealth and state ABF monies, as well as Commonwealth block funding, are paid into a bank account established for each state or territory—but controlled by the Commonwealth. The Victorian bank account is known as the National Health Funding Pool—Victorian State Pool Account.
ABF payments are made directly from the Pool to hospitals, circumventing the previous role of the state and territory health departments. Payments can only be made from the Pool following instruction from the relevant state or territory Minister for Health.
An independent administrator is required to manage each of the Commonwealth's, states' and territories' Pool accounts. The Administrator is required to oversee the payments made out of the Pool account, maintain the associated records, and prepare annual financial statements, which are to be audited and tabled in the Parliament of each relevant jurisdiction.
At the time of preparing this report, an administrator for Victoria had still not been appointed. The former Victorian Minister for Health had continued to temporarily grant—on a yearly basis—authority to the Chief Finance Officer of the former Department of Health to make payments out of the Pool account to Victorian hospitals.
The 2014–15 Commonwealth Budget states that the Commonwealth is planning to create a new Health and Productivity Commission that will be formed by merging the Australian Commission on Safety and Quality in Health Care, the Australian Institute of Health and Welfare, the Independent Hospital Pricing Authority, the National Health Performance Authority, the National Health Funding Body, and the Administrator of the National Health Funding Pool. The Commonwealth Budget notes that during 2014–15, the government will consider, in consultation with the states, further rationalisation of government bodies, including the potential merging of these six health care bodies to create a Health Productivity and Performance Commission. The Victorian Auditor‑General is responsible for the audit of the financial statements of the National Health Funding Pool—Victorian State Pool Account. However, as the Pool does not form part of the operations of the Victorian public hospital sector, its financial results are not included in this report.
1.5 Conduct of public hospital financial audits
The audits of the 87 public hospitals and 23 associated entities were undertaken in accordance with Australian Auditing Standards.
Pursuant to section 20(3) of the Audit Act 1994, unless otherwise indicated any persons named in this report are not the subject of adverse comment or opinion.
The total cost of this report was $205 000.
2 Quality of reporting
At a glance
Background
This Part covers the results of the 2013–14 audits of the 87 public hospitals and 23 associated entities. It compares the financial reporting practices in 2013–14 against better practice, and presents the results of our assessment of general internal controls across these entities.
Conclusion
Parliament can have confidence in the financial reports of public hospitals as all financial reports were given unmodified audit opinions.
Findings
- The average time taken to finalise public hospital financial reports reduced from 9.1 to 7.3 weeks in 2013–14 due to the efforts of management in preparing and finalising drafts of their financial statements earlier. This is well within the legislated time frame of 12 weeks.
- Financial report preparation by public hospitals could be further improved with the preparation of shell financial statements. This will enable early identification and resolution of financial reporting issues, thereby reducing the risk of delays and any associated additional costs. Around a third of public hospitals did not prepare shell financial statements during the 2013–14 financial year.
- Other areas of potential improvement relating to internal controls include timely reviews of key account reconciliations, timely authorisation of supplier payments and regular review of financial and information technology policies.
Recommendations
That public hospital boards and management:
- review their financial reporting processes to address the better practice report preparation elements, including the timely preparation of shell financial statements
- address all issues raised in audit management letters on a timely basis, including ongoing concerns regarding the need to improve controls around key account reconciliations and the authorisation of supplier payments.
2.1 Introduction
This Part covers the results of the audits of the 2013–14 financial statements of public hospitals and their associated entities.
In our annual audits we focus on the internal controls relating to financial reporting and assess whether entities have managed the risk that their financial statements may not be complete and accurate. Poor internal controls diminish management's ability to achieve their entity's objectives and comply with relevant legislation. They also increase the risk of fraud and error.
The board and management of each public hospital are responsible for developing and maintaining adequate systems of internal control that enable:
- preparation of accurate financial records and other supporting information
- timely and reliable external and internal reporting
- appropriate safeguarding of public assets
- prevention or detection of fraud, errors and other irregularities.
Integral to the annual financial audit is an assessment of the adequacy of the internal control framework, as it relates to financial reporting, and the governance processes. In making this assessment, consideration is given to the internal controls relevant to the entity's preparation and fair presentation of the financial report in order to design audit procedures that are appropriate in the circumstances, but not for the purpose of expressing an opinion on the effectiveness of the entity's internal control.
In this Part we report on aspects of the general internal controls of Victoria's public hospitals and associated entities.
2.2 Audit opinions issued
Independent audit opinions add credibility to financial reports by providing reasonable assurance that the information reported is reliable and accurate. An unmodified or 'clear' audit opinion confirms that the financial statements present fairly the transactions and balances for the reporting period, in accordance with the requirements of relevant Australian Accounting Standards and applicable legislation.
A modified audit opinion means that the financial report is materially different to the requirements of the relevant reporting framework, and is therefore less reliable and useful as an accountability document.
For 2013–14, unmodified audit opinions were issued on the financial statements of all 87 public hospitals and 23 associated entities. This positive result is consistent with 2012–13, when all 112 public hospitals and associated entities received unmodified audit opinions.
In certain circumstances an audit opinion may draw attention to, or emphasise, a matter relevant to the users of an entity's financial report but does not warrant a modification. No public hospital or associated entities' audit opinion included an emphasis of matter paragraph for 2013–14, consistent with 2012–13.
2.3 Quality of individual hospital financial reporting
The quality of an entity's financial reporting can be measured in part by the timeliness and accuracy of the preparation and finalisation of its financial report, as well as against better practice criteria.
Appendix C details the legislative and reporting framework for each of the 110 entities.
2.3.1 Accuracy
The frequency and size of errors in financial statements are direct measures of the quality of the draft financial statements submitted to audit. Ideally, there should be no errors or adjustments required as a result of an audit.
The public is entitled to expect that any financial reports that bear the Auditor‑General's opinion are accurate and of the highest possible quality. Therefore our expectation is that all entities will adjust any errors identified during an audit, other than those that are clearly trivial or clearly inconsequential to the financial report, as defined under the Australian Auditing Standards.
Material audit adjustments
Material errors need to be corrected before an unmodified audit opinion can be issued. While all material errors were adjusted prior to the completion of the financial reports, it is noted that 51 material audit adjustments were made during the 2013–14 audits. This compares to 81 material audit adjustments in 2012–13. Rural hospitals continue to account for just over half (53 per cent) of the material adjustments made each year.
The nature of material financial balance and disclosure adjustments identified during the 2013–14 audits were:
- property, plant and equipment disclosures—the introduction of Australian Accounting Standard AASB13 Fair Value Disclosuresrequired all entities to disclose significantly more information regarding the nature of assets held, and the factors used in determining their valuations in their 2013–14 financial statements than in prior years. Across the 110 entities in this report, material adjustments were made as a result of the audit of these disclosures
- financial statement and accounting policy disclosures—adjustments to financial statements to bring overall disclosures into line with the sector's model financial report, and therefore the requirements of the financial reporting framework, and specific adjustments relating to accounting policy disclosures, particularly related to Australian Accounting Standards AASB13 Fair Value Measurementand AASB119 Employee Benefits
- depreciation—adjustments to depreciation costs recognised in the financial statements, where entities had incorrectly calculated depreciation costs as part of the asset revaluation process
- cash and investments—incorrect reclassification of cash balances to investments for deposits held with maturity terms in excess of 90 days. All material errors were adjusted prior to the completion of the financial reports.
Adjustment of other misstatements
Other errors should also be corrected before the financial report is finalised. While some errors may appear immaterial in isolation, in aggregate, a series of small errors may have a significant impact on the statements or an entity's operating result.
During the 2013–14 audits, a number of misstatements above clearly trivial thresholds were identified. The majority of these were subsequently adjusted in entities' financial statements. However, some were not adjusted because they were identified late in the audit, or could not be processed in a timely manner without raising the risk of creating further errors. In these instances the misstatement was raised with management and will be rectified during 2014–15.
2.3.2 Timeliness
Timely financial reporting is key to providing accountability to stakeholders and enables well‑timed and informed decision-making by users of financial reports. The later the reports are produced and published after year end, the less useful they are.
Public hospitals are required to finalise their audited financial reports within 12 weeks of the end of the financial year, and they are to be tabled in Parliament within four months of the end of the financial year. The need to consolidate the results of controlled entities into their financial report means that the financial statements of controlled entities, that sometimes operate under the Corporations Act 2001, are also required to report within 12 weeks of the end of financial year.
All public hospitals met their legislative time frames for the production and audit of financial statements, as was the case in 2012–13. All associated entities met their time frames in 2013–14, an improvement on 2012–13, when two entities missed their legislative reporting requirements.
The average time taken to finalise financial statements decreased to 7.3 weeks in 2013–14 from 9.1 weeks in 2012–13. This reduction was due to the efforts of management in preparing and finalising drafts of their financial statements earlier, which was in response to the reduced reporting time lines imposed by the Department of Treasury and Finance and improved timing of the completion of the National Health Funding Pool—Victorian State Pool Account (the Pool) financial statements—which enabled earlier finalisation of individual hospital financial statements, to ensure that funds distributed from the Pool were accurately reflected in hospital statements.
2.3.3 Better practice
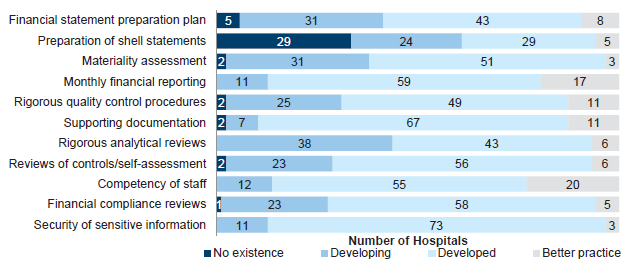
An assessment of the quality of financial reporting processes was conducted against better practice criteria, detailed in Appendix C, using the following scale:
- no existence—function not conducted by the entity
- developing—partially encompassed in the entity's financial reporting process
- developed—entity has implemented the process, however, it is not fully effective
- better practice—entity has implemented effective and efficient processes.
The results are summarised in Figure 2A.
Figure 2A
Results of assessment of report preparation processes against better practice elements
Source: Victorian Auditor-General's Office.
While most elements were developing or developed, and some hospitals had achieved better practice, the most significant element to be addressed across the sector is the preparation of shell financial statements. Preparing shell financial statements before year end enables format, presentation and disclosure issues within the financial statements to be identified and resolved early. Conversely, not preparing shell financial statements in advance of year end can cause significant delays and additional costs in the finalisation of the financial statements—potentially jeopardising the ability to meet legislated time lines and causing unnecessary cost increases.
Assessments against better practice elements have been reported over a number of years. Nevertheless, some public hospitals have not sufficiently developed some better practice elements which are designed to improve the efficiency and effectiveness of their financial report preparation.
2.4 General internal controls
Internal controls at public hospitals and their associated entities were adequate for maintaining the reliability of external financial reporting. Nevertheless, the following areas were commonly identified as requiring improvement:
- timely review of key account reconciliations—reported in the prior year
- review and documentation of master file standing data changes—reported in the prior year
- authorising supplier payments
- review of financial and information technology policies
- resolution of prior year issues.
The issues regarding review of key account reconciliations and review of master file standing data changes were reported in previous years, and while there has been progressive improvement by the hospital sector as a whole, further improvement is required by some public hospitals to ensure strong controls over financial reporting.
The control weaknesses were brought to the attention of boards, hospital management, and audit committees by way of our management letters.
2.4.1 Preparing and reviewing key account reconciliations
A financial report is prepared from information captured in an entity's general ledger, with key general ledger balances supported by information in subsidiary ledgers such as accounts payable, fixed assets and payroll. Periodic reconciliation of the general ledger with subsidiary ledger balances confirms the completeness and accuracy of data.
Timely and independent reviews of reconciliations decreases the risk that errors may go undetected or may not be resolved in a timely manner. Poor controls can adversely affect the accuracy of financial reporting.
Nine (10 per cent) of the 87 public hospitals (12 hospitals, or 14 per cent in 2012–13) had deficiencies in the preparation and review of key reconciliations. While these nine hospitals prepare reconciliations regularly, independent reviews of the reconciliations either did not occur, or were not documented in a timely manner. This issue was reported last year and while improvement has been observed, further improvement is required, predominantly in rural hospitals.
2.4.2 Review and documentation of master file standing data changes
Financial systems, such as accounts payable and payroll systems rely on the maintenance of master files holding standing data to enable reliable processing of individual payments. The standing data can include important details such as names, addresses, pay rates and bank account details.
It is important that all changes to master file standing data are independently checked for completeness, accuracy and legitimacy. Without checks, processing errors can be repeated many times over, reducing data integrity. An independent review of master file standing data changes is important for the detection and timely correction of unintentional or fraudulent changes, and to guard against payments to fictitious parties.
Five (6 per cent) of the 87 public hospitals (11 hospitals, or 13 per cent in 2012–13) had weaknesses in maintaining key system master files, including a lack of an independent review of changes made, and inadequate documentation to support them. This issue was most prevalent in metropolitan hospitals, with Dental Health Services Victoria in particular, failing to improve its review of payroll master file changes over the last few years.
2.4.3 Authorising supplier payments
The implementation and maintenance of an effective internal control framework over expenditure processing is required. The regular review of financial delegations and user access to online banking is necessary to reduce the risk of inappropriate transactions.
Nine (10 per cent) of the 87 public hospitals (five hospitals, or 6 per cent, in 2012–13) had weaknesses identified within their expenditure transaction process during 2013–14. These related to:
- approvals not being made within established financial delegations
- lack of review of financial delegations
- inappropriate user access to online banking.
2.4.4 Review of financial and information technology policies
Policies provide a frame of reference for staff, and communicate management's expectations in relation to particular activities. They set out requirements for the processing of authorised transactions. In the absence of documented policies, the opportunity for fraud risk and likelihood of error increases.
Public hospitals generally had policies in place to address their key financial processes. However, there were 11 out of the 87 hospitals where policies were out of date and not being regularly reviewed. This included policies relating to asset maintenance, fraud and information technology. Eight of these 11 hospitals were rural.
2.4.5 Resolution of prior year issues
Internal control weaknesses reported to an entity's board, management and audit committee should be actioned and resolved in a timely manner.
Across the 87 public hospitals, 106 of the 358 (30 per cent) internal control weaknesses identified and reported to the hospital boards by VAGO during the 2012–13 audits, or earlier, had not been resolved by management at the time of the 2013–14 audits. This lack of timely resolution means that the control frameworks in place at these entities are not as effective as they should be, and management should seek to address all issues raised on a timely basis.
Recommendations
That public hospital boards and management:
- review their financial reporting processes to address the better practice report preparation elements, including the timely preparation of shell financial statements
- address all issues raised in audit management letters on a timely basis, including ongoing concerns regarding the need to improve controls around key account reconciliations, the authorisation of supplier payments, and the regular review of financial and information technology policies
- through audit committees, implement appropriate monitoring mechanisms to ensure audit findings are resolved by management on a timely basis.
3 Financial results
At a glance
Background
This Part provides an insight into the financial results and financial sustainability risks of the 87 public hospitals based on an analysis of key financial indicators.
Conclusion
The overall financial sustainability risk for the public hospital sector at 30 June 2014 has been rated as medium, consistent with the prior year.
Findings
- The financial reports of 32 public hospitals (28 for 30 June 2013), including some major metropolitan hospitals, were supported by a letter from the former Department of Health. The letter stated the department would provide financial support to enable these public hospitals to meet their financial obligations, if required. Without this support, these 32 public hospitals would have been unable to report as a going concern at 30 June 2014.
- Twelve public hospitals at 30 June 2014 (23 at 30 June 2013) had cash on hand at balance date sufficient to fund only one week or less of operations.
- The current funding model has resulted in a mismatch between public hospital boards' responsibilities for the sustainable management and provision of health services and the boards' limited ability to control the funding they receive—particularly from the department—to enable them to do this.
Recommendations
That public hospital boards and management:
- maintain good cash management processes to ensure that they are able to meet their financial obligations as they fall due, particularly for those public hospitals assessed as having a high liquidity risk
- work with the Department of Health and Human Services to ensure they are able to renew ageing assets as required to prevent any loss of services provided to the public.
3.1 Financial results of public hospitals
3.1.1 Operating result
Public hospitals, as an essential public service, should manage their finances so that they are financially sustainable. The sector's net result for 2013–14 was a surplus of $235 million, which against total revenue of some $13 billion for all entities in the sector is tantamount to a break even position.
Total public hospital revenue increased by 7 per cent in 2013–14 to $12.8 billion, and expenditure increased by a corresponding 5 per cent. The composition of what makes up revenue and expenditure for public hospitals has remained basically unchanged over the past five years. Government funding contributes 88 per cent of public hospital revenue, and salaries and wages are the biggest expense—representing 67 per cent of expenditure.
Public hospitals derive and report revenue as either:
- revenue arising from health services agreements (HSA income)—which is largely made up of government funding
- revenue from hospital and community initiatives (non-HSA income).
Non-HSA income is self-generated and is typically derived from additional services such as pharmacy sales, cafeteria sales, diagnostic imaging, private practice fees, car park fees and income on investments.
Rural and regional public hospitals derive 92 per cent of their revenue from HSA income. This means rural and regional hospitals have little self-generated revenue. In contrast, metropolitan public hospitals generate 86 per cent of their revenue from HSA income and therefore have slightly more capacity to fund initiatives and absorb unexpected cost fluctuations.
3.1.2 Financial position
An entity's financial position is generally measured by reference to its net assets—the difference between its total assets and total liabilities. The strategic objectives for public hospitals are aligned to providing key health services to the public, and they hold significant asset balances to do this—including buildings, medical equipment and infrastructure.
The total assets of the sector were $14.6 billion at 30 June 2014 ($12.0 billion at 30 June 2013). Net assets at 30 June 2014 were $9.8 billion ($7.5 billion at 30 June 2013). This positive net asset position improved during 2013–14 as large scale capital projects progressed—such as the new Victorian Comprehensive Cancer Centre—and other smaller capital projects were completed. Corresponding liabilities for some of these capital projects were recognised. Furthermore, the revaluation of property, plant, and equipment undertaken in line with the Australian Accounting Standard AASB 13 Fair Value Measurement and Financial Reporting Direction 103E Non-Financial Physical Assets (FRD 103E) contributed to the improved net asset position in 2013–14.
3.2 Financial sustainability risks of public hospitals
3.2.1 Introduction
To be financially sustainable, entities need to be able to meet their current and future expenditure requirements as they fall due. They also need to absorb foreseeable changes and financial risks that materialise. The assessment of financial sustainability risks assists in identifying trends that either warrant attention or highlight positive results.
Financial sustainability should be viewed from both short- and long-term perspectives. Short-term indicators show the ability of an entity to maintain positive operating cash flows in the near future, or to generate an operating surplus in the next financial year. Long-term indicators focus on strategic issues, such as the ability to fund ongoing asset maintenance programs or reduce long-term debt.
In this Part, insight is provided into the financial sustainability risks of public hospitals through analysis of key financial sustainability indicators as at 30 June 2014, and trends in these indicators over the past five years. Appendix D describes the sustainability indicators and their significance, as well as the risk assessment criteria and rating scales used in this Part.
The analysis addresses the financial position of the sector as a whole, of the three categories of hospitals—metropolitan, regional and rural—and of individual public hospitals.
To form a definitive view of any entity's financial sustainability, a holistic analysis that moves beyond, but includes, financial indicators would be required, including an assessment of the entity's operations and the regulatory environment in which the entity operates. These additional considerations are not examined in this report.
3.2.2 Overall assessment
The overall financial sustainability risk for the public hospital sector for 2013–14 was assessed as medium, consistent with the 2012–13 result. This assessment means there are concerns relating to the financial sustainability risks of many public hospitals.
Figure 3A presents the indicators by hospital category for 2013–14.
Figure 3A
Financial sustainability risk, 2013–14
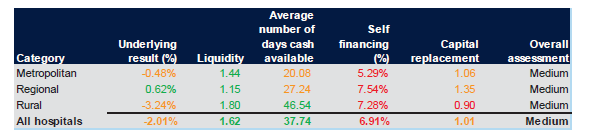
Note: Red identifies high risk, while amber indicates longer-term sustainability risks and green indicates no significant risks.
Source: Victorian Auditor-General's Office.
The results of our sustainability risk assessments for each hospital category and each public hospital can be found in Appendix D. Comments on the results for each of the indicators follow in this Part.
Impacts of the funding model on sustainability
The funding arrangements directly impact the financial sustainability risks of public hospitals. For public hospitals to continue to provide an adequate and sustainable level of service, their assets need to be maintained and replaced when necessary. However, the funding model does not progressively provide funding to public hospitals to match the depreciation of their assets. Capital grants, which may be provided for asset renewal and replacement, are allocated by the Department of Health and Human Services—the former Department of Health (DH)—strategically across the sector.
The impact on public hospitals is demonstrated as follows:
- sixty-nine public hospitals (79per cent) had a high self-financing risk in 2013–14 (70 hospitals in 2012–13)
- sixteen public hospitals (18 per cent) had a high liquidity risk in 2013–14 (15 hospitals in 2012–13)
- twelve public hospitals (14 per cent) held cash at 30 June 2014 that could only fund seven or less days of operating activity (23 hospitals in 2012–13)
- in 2013–14, 33 public hospitals (38 per cent) received capital grants of less than 20 per cent of their depreciation expense for the year. This means the funding received for replacing their assets was significantly less than the value of assets they consumed, as measured by the depreciation expense.
Under section 33 of the Health Services Act 1988 (the Act), the functions of a public hospital's board are to oversee and manage the hospital, and to ensure that services provided comply with the requirements of the Act and the hospital's objectives. Section 65 of the Act requires the boards to develop plans to ensure the 'long term financial viability of the public health service'.
Nevertheless, under the funding model managed by DH, hospital management and boards have limited control over pricing and funding models—which are determined by DH—whilst remaining accountable for the impacts of ageing infrastructure and associated expenditure. The mismatch between the governance and funding models blurs accountability for the financial performance of individual hospitals.
3.2.3 Net result
Net result is calculated by subtracting an entity's total expenses from its total revenue, to show what was earned or lost in a given period of time. A positive result is known as a surplus, while a negative result is known as a deficit.
Figure 3B shows the average net result for each public hospital category, and overall, from 2009–10 to 2013–14.
Figure 3B
Net result by hospital category and overall
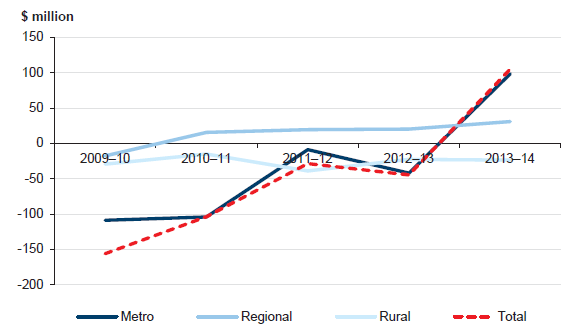
Source: Victorian Auditor-General's Office.
The net results by category have fluctuated significantly over the five-year period and continue to improve towards an average surplus position in 2013–14. All categories have achieved some recovery since the large losses delivered in 2009–10, which were largely due to significantly increased depreciation costs following from the sector-wide asset revaluations performed in 2008–09. Under the funding model, DH does not fund public hospitals directly for depreciation, and it is expected that public hospitals will record operating deficits as they incur increased depreciation charges in the financial year following asset revaluations. As per FRD 103E, the sector wide asset revaluations operate on a five year cycle. The public hospital valuations—occurred during the 2013–14 year—so we expect this pattern of an increase in depreciation costs to repeat in our analysis of the 30 June 2015 hospital financial statements.
Overall, metropolitan hospitals have achieved a surplus in the current year, the majority of which have been driven by significant state government capital grants isolated to a small number of hospitals.
Regional hospitals have continued to sustain average surpluses in recent times. These averages are impacted by consistently strong results from a number of hospitals due to their increasing emphasis on cost containment measures, which has subsequently increased the average result of the category as a whole.
3.2.4 Liquidity
Liquidity is a measure of current assets against current liabilities. This measures the ability of an entity to pay existing liabilities in the next 12 months. A ratio of one or more means there are more current assets than current liabilities.
At 30 June 2014, 33 of 87 public hospitals had fewer current assets than current liabilities (33 in 2012–13). This means they face potential challenges of not being able to pay liabilities as and when they fall due. Low liquidity highlights the pressure on public hospitals to meet short-term liabilities.
Figure 3C shows that the average liquidity ratio by hospital category has remained relatively stable over the past five years.
Figure 3C
Average liquidity ratio, by hospital category
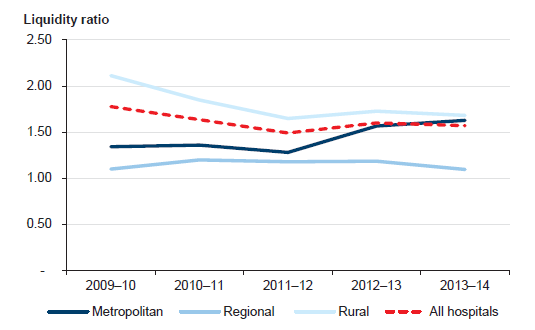
Source: Victorian Auditor-General's Office.
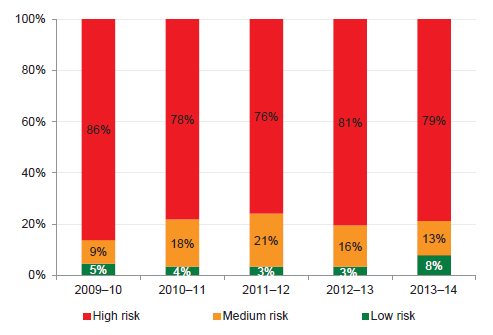
Average liquidity ratios and the number of public hospitals with significant liquidity risks have generally remained stable, but are increasing for some hospitals. Figure 3D shows the risk profile over the past five years, with the number of public hospitals in the high- and medium-risk categories growing slightly over prior periods.
Figure 3D
Public hospital liquidity risk
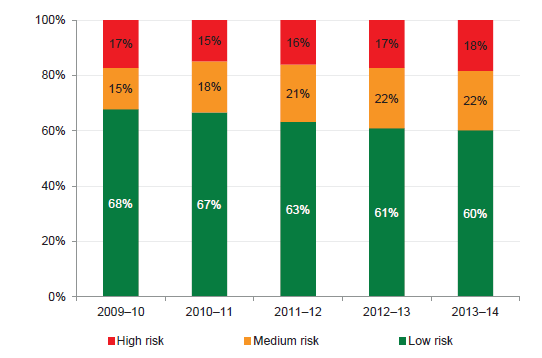
Source: Victorian Auditor-General's Office.
These liquidity issues are largely driven by the funding model that governs hospital operations, which restricts the ability of public hospitals to be financially self-sufficient. Public hospitals are funded on a monthly basis for the costs they are expected to incur over the next month.
This is a change from recent years where funding was provided on a fortnightly basis. This model requires detailed cash management practices to be implemented by public hospitals to ensure they are able to pay their debts as they fall due. Given their heavy reliance on government funding to maintain operations and service levels, public hospitals must closely manage their cash flow budgets.
DH also monitors the liquidity and cash flows of hospitals at an overall level to ensure funds are appropriately deployed.
Average number of days cash available
The 'average number of days cash available' indicator measures the number of days of operating expenses that a hospital could pay with its current, unrestricted, cash balance. Under the Australian Accounting Standards certain assets, such as term deposits with original maturities of more than 90 days, are specifically excluded from cash. For the purposes of accuracy and consistency across all public hospitals, this indicator therefore excludes these particular assets.
The calculation of unrestricted cash also excludes amounts held by a public hospital where the use of these amounts has been restricted—such as patient money held in trust or cash set aside for capital purposes. These amounts are excluded from this indicator, as they cannot be used by the public hospital to cover their day-to-day operating costs.
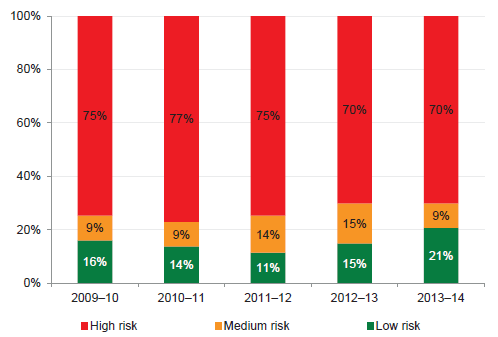
At 30 June 2014, 48 of 87 public hospitals (57 of 87 at 30 June 2013)—including most major metropolitan and regional hospitals—had cash holdings equivalent to 30 days or less of their operating cash outflows. Figure 3E shows the risk profile over the past five years, with the number of public hospitals in the high- and medium-risk categories reducing in 2013–14.
Figure 3E
Public hospital average number of days cash available risk assessment
Source: Victorian Auditor-General's Office.
Figure 3F shows that the average number of days of cash available at year end increased at the whole-of-sector level, and remained greater than one month's operating cash flows as at 30 June 2014. This improvement has been largely attributed to improved cash on hand at year end, driven primarily by improved cash management strategies employed by hospitals to reduce potential liquidity challenges at year end.
This has led to a greater cash balance being held by individual public hospitals as at the 30 June 2014 balance date compared to the prior year, which is also illustrated by the more favourable risk profile in figure 3E.
Figure 3F
Average number of days cash available, by hospital category
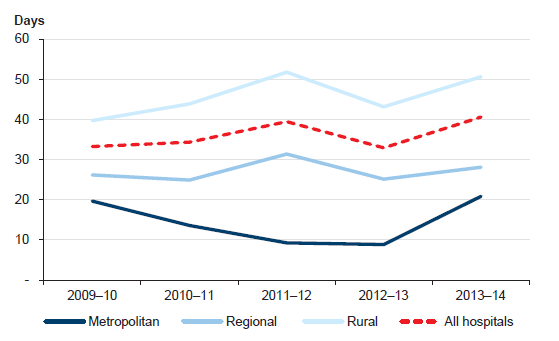
Note: Funds held in trust, unspent capital grants and restricted special purpose funds are excluded from this analysis as their use is restricted.
Note: Holdings in short-term investments, such as such as term deposits, are also excluded from this analysis, in accordance with Australian Accounting Standards.
Source: Victorian Auditor-General's Office.
Twelve public hospitals (23 in 2012–13) held unrestricted cash equivalent to seven days or less than seven days of operating expenditure at 30 June 2014. The 12 hospitals are listed in Figure 3G.
This means that these hospitals could potentially only continue to operate for up to a week if they did not receive further funding at the start of July 2014. While this is an improvement on the prior year result of 23 public hospitals being in this position, it means that public hospitals are still at a significant risk of not being able to fund operating activities. Further, if these hospitals did not receive a grant payment during that seven day period, they would be required to access other funding sources, which may include seeking a recallable grant from the department.
Ultimately, holding a low cash on hand balance could put at risk the ability of these hospitals to respond in the event of unexpected costs, which may result in money being diverted from other services to meet any new obligations.
Figure 3G
Public hospitals with cash holdings of seven days or less operating cash outflow, 30 June 2014
|
Hospital |
Days cash available |
|---|---|
|
Alfred Health |
0 |
|
Melbourne Health |
0 |
|
Mercy Public Hospitals Inc. |
0 |
|
Colac Area Health |
2 |
|
Northeast Health Wangaratta |
3 |
|
Benalla Health |
3 |
|
Portland District Health |
3 |
|
Northern Health |
4 |
|
East Wimmera Health Service |
6 |
|
Central Gippsland Health Service |
7 |
|
Barwon Health |
7 |
|
St Vincent's Hospital (Melbourne) Limited |
7 |
Note: Where a hospital's unrestricted cash balance is less than zero, it has been rounded to zero days cover.
Note: Funds held in trust, unspent capital grants, restricted special purpose funds and holdings in short-term investments, such as such as term deposits, are excluded from this analysis.
Source: Victorian Auditor-General's Office.
It should be noted that none of these hospitals ceased to operate after 30 June 2014 within the number of days specified in Figure 3G. However, by operating in this tightened fiscal environment, these hospitals are reducing their ability to quickly respond to any unexpected changes in circumstances. All public hospitals need to operate good cash management services to address this risk.
Going concern
Notwithstanding the overall financial results achieved by the sector in 2013–14, 32 public hospitals (28 in 2012–13) showed signs of financial stress, with a material uncertainty about their ability to continue as a going concern for financial reporting purposes. This means that they are considered to be at risk of not being able to meet all their obligations—such as creditors, borrowing repayments and other expenses—over the next 12 months.
To counteract this possibility, DH provided letters of financial support to these 32 hospitals (28 in 2012–13). These letters provide an undertaking by DH to provide adequate cash flows to enable them to meet their current and future obligations, as and when they fall due, for a period of 12 months up to September 2015, should it be required.
While these letters do not provide for additional funding, they mitigate the risk that the 32 hospitals will be unable to meet all of their financial obligations as they fall due during 2014–15.
Figure 3H shows the public hospitals that received a letter of support related to their 2013–14 financial reports. By providing a letter of support, DH has assisted these public hospitals in meeting the requirements of Australian Accounting Standard AASB 101 Presentation of Financial Statements for the entity to report as a going concern. This means that the hospitals are able to meet their financial obligations for the next 12 months after the financial statements were signed.
Figure 3H
Public hospitals with letters of support, 2013–14
|
Metropolitan |
Regional |
Rural |
|---|---|---|
|
Alfred Health Austin Health Eastern Health Melbourne Health Monash Health Northern Health Peter MacCallum Cancer Centre Royal Children's Hospital The Royal Women's Hospital |
Albury Wodonga Health Ballarat Health Services Bendigo Health Care Group Central Gippsland Health Service Cohuna District Hospital Colac Area Health Northeast Health Wangaratta Swan Hill District Hospital Wimmera Health Care Group |
Alexandra District Hospital Bass Coast Regional Health Beechworth Health Service Castlemaine Health Djerriwarrh Health Services Dunmunkle Health Services East Wimmera Health Service Kilmore and District Hospital Kyneton District Health Service Maryborough District Health Service Portland District Health Rural Northwest Health Tallangatta Health Service West Wimmera Health Service |
Source: Victorian Auditor-General's Office.
As noted earlier, hospitals will need to continue to monitor their cash management practices carefully to ensure they are able to continue to provide services to the public, while still meeting their financial obligations.
3.2.5 Self-financing
The self-financing indicator measures the ability of an entity to replace assets using cash generated by its own operations. The higher the percentage, the more effectively this can be done. This is a longer-term indicator.
Across the sector, the average self-financing ratio remained low, highlighting the sector's ongoing reliance on government funding to maintain service levels and to maintain and replace assets. In 2013–14, metropolitan hospitals continued the trend of the past four years, with lower self-financing ratios than regional and rural hospitals.
Figure 3I shows the movement in the average self-financing ratio for each of the three hospital categories over the past five years.
Figure 3I
Average self-financing indicator, by hospital category
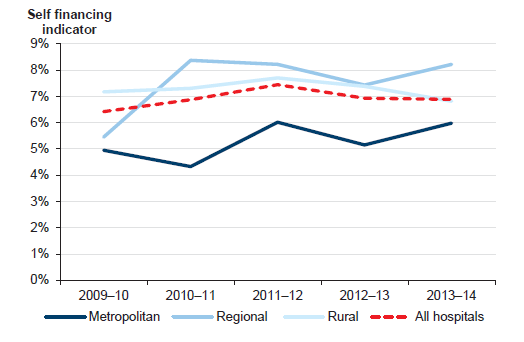
Source: Victorian Auditor-General's Office.
Figure 3J shows that the self-financing risk for 79 per cent of public hospitals was high for 2013–14. This is consistent with results since 2009–10, and is largely due to the funding model.
Figure 3J
Public hospital self-financing risk
Source: Victorian Auditor-General's Office.
These results are reflective of the funding model and the nature of services provided by public hospitals. Changes to this model are outside the responsibility of individual public hospital boards. DH advises the state government on funding of public hospitals.
3.2.6 Capital replacement
The capital replacement indicator compares the rate of spending on infrastructure with an entity's depreciation. Depreciation is a measure of the value of a hospital's infrastructure that has been consumed in the year. Ratios higher than 1:1 indicate that spending on fixed assets is greater than depreciation for the year. This is a long-term indicator, as capital expenditure can be deferred in the short-term if there are insufficient funds available from operations, and borrowing is not an option.
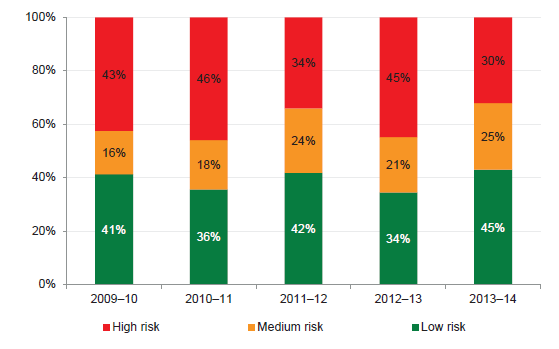
Figure 3K shows that the number of public hospitals with a high capital replacement risk has reduced since 2009–10, but remains very high.
Figure 3K
Public hospital capital replacement risk
Source: Victorian Auditor-General's Office.
The value of assets across the sector increased since 2009–10, due to the 2013–14 revaluation of non-current assets, increasing depreciation charged annually and affecting the capital replacement indicator. The 2013–14 results show that the proportion of public hospitals in the low-risk category has increased moderately.
Figure 3L shows that after 2009–10, the sector's overall capital replacement ratio dropped in 2011–12, and was at its highest in 2013–14.
Figure 3L
Average capital replacement indicator, by hospital category
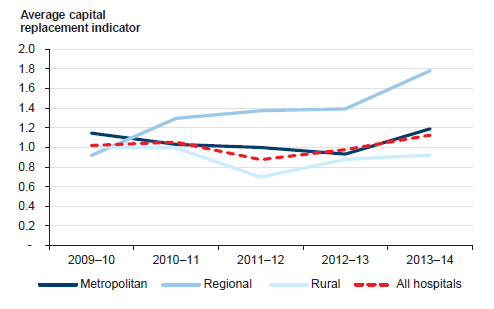
Source: Victorian Auditor-General's Office.
On average, metropolitan and regional public hospitals are spending money on assets at a rate greater than they are being consumed. However, the positive results are based on an analysis that includes expenditure on both renewing assets and new capital projects. This may mean that for public hospitals where new assets are being acquired, existing assets are not being maintained at the rate they are being used—as measured through depreciation.
Where this is the case, there are challenges for the individual public hospitals—and DH—to ensure that fixed assets are not allowed to degenerate to a point where they are obsolete, and cannot be used to provide services to the public.
DH has provided $871 million in capital grants to public hospitals in 2013–14 to assist in the building of new assets. However, emphasising the trend in Figure 3L, these grants have been awarded more towards the metropolitan and regional public hospitals.
As shown in Figure 3L, rural public hospitals are not spending as much on renewing assets or building new assets compared to their consumption of current assets. This poses an even greater risk that these public hospitals may not be able to continue to provide services due to poor or obsolete assets in the medium to long term. These entities should work with DH to ensure assets at risk are renewed in appropriate time frames to prevent any loss of services to the public.
Recommendations
That public hospital boards and management:
- maintain good cash management processes to ensure that they are able to meet their financial obligations as they fall due, particularly for those public hospitals assessed as having a high liquidity risk
- work with the Department of Health and Human Services to ensure they are able to renew ageing assets as required to prevent any loss of services provided to the public.
4 Internal audit
At a glance
Background
Internal audit is a key mechanism available to public hospital boards to support the discharge of their governance and oversight responsibilities. Internal auditors can, among other activities, review core internal controls and identify areas of risk within an entity.
Conclusion
Public hospital internal audit functions generally operate effectively, although two public hospitals do not currently have an internal audit function in place, breaching the Standing Directions of the Minister for Finance under the Financial Management Act 1994.
Areas of improvement to the internal audit functions have been identified to enhance the level of assurance received by public hospitals.
Findings
- Dunmunkle Health Service and Casterton Memorial Hospital do not maintain an internal audit function, breaching the Standing Directions of the Minister for Finance under the Financial Management Act 1994.
- Thirty of the remaining hospitals do not have stand-alone internal audit charters.
- Internal audit plans are established at a majority of public hospitals, but they are not always aligned to the entity's risk register.
Recommendations
That Dunmunkle Health Service and Casterton Memorial Hospital establish and maintain an internal audit function.
That public hospital boards and management:
- have in place stand-alone internal audit charters that provide a clear framework for the selection, operation and oversight of the internal audit function
- review their internal audit plan to ensure that the internal audit function is providing the level of assurance required.
4.1 Introduction
Internal audit is a key mechanism available to public hospital boards to support the discharge of their governance and oversight responsibilities. Internal auditors can, among other activities, review core internal controls and identify areas of risk within an entity, providing assurance to boards, management on the operational effectiveness of key controls.
An effective internal audit function strengthens internal controls, adding credibility to both the financial and non-financial information produced, as well as improving the efficiency of key controls and processes.
This Part reviews the internal audit function in each of the 87 public hospitals against the better practice framework.
4.2 Key elements of an internal audit framework
The key elements of an effective internal audit function are detailed in Figure 4A. The table draws on the Australian National Audit Office better practice guide Public Sector Internal Audit – An Investment In Assurance and Business Improvement (September 2012).
Figure 4A
Key elements of an effective internal audit function
|
Key area |
Best practice criteria |
|---|---|
|
Policy |
Policy established that requires an effective internal audit function to be in place. Established internal audit charter, which documents:
Compliance with the Financial Management Act 1994 and Standing Directions of the Minister for Finance. Periodic review of the internal audit charter. Policy and charter appropriately reviewed and approved. |
|
Management practices |
Comprehensive audit plan developed for a minimum three-year period that is directly linked to the identified risks of the entity. Internal audit plan should:
Internal audit plan should be available to all stakeholders and staff. Ensure the head of internal audit is sufficiently senior to be an accepted element of the portfolio department's governance arrangements. Communication between internal audit and external audit is adequate. Regular reporting to the audit committee and the secretary. |
|
Governance and oversight |
Charter reviewed by the audit committee, and approved by the Secretary. Annual review of internal audit performance by the audit committee. Regular reporting to the audit committee on:
Action taken to address issues identified by internal audit is monitored by the audit committee and senior management including the secretary. |
Source: Victorian Auditor-General's Office based on the Australian National Audit Office better practice guide Public Sector Internal Audit – An Investment In Assurance and Business Improvement (September 2012).
These elements were considered in our assessment of the internal audit function in each of the 87 public hospitals.
Conclusion
Public hospital internal audit functions generally operate effectively, although two hospitals—Dunmunkle Health Service and Casterton Memorial Hospital—currently do not have an internal audit function in place, breaching the Standing Directions of the Minister for Finance under the Financial Management Act 1994.
Areas of improvement to internal audit functions have been identified to enhance the level of assurance received by public hospitals.
4.3 Internal audit functions
Eighty-five of the 87 public hospitals maintained an internal audit function during the financial year.
Having an internal audit function is a specific requirement of Standing Direction 2.5, issued by the Minister of Finance (the Standing Direction), which is applicable to public hospitals. The two hospitals without an internal audit function had not obtained exemption from the Standing Direction. Dunmunkle Health Service cited financial pressures for not having an internal audit function, and Casterton Memorial Hospital noted that they relied on work completed by internal management in place of a specific internal audit function.
The remainder of this analysis focuses on the 85 hospitals that did maintain an internal audit function.
Outsourced or internally staffed functions
Seventy-eight (92 per cent) of public hospitals outsourced the provision of their internal audit function to private accounting or specialised consulting firms. These outsourced contracts typically run for a three-year period. The remaining public hospitals employed suitably experienced and qualified staff to conduct their internal audit work.
Twenty-five of the 78 public hospitals that outsourced their internal audit function engaged their internal auditors to perform additional consultancy or review work outside the scope of normal internal audits. Engaging an outsourced internal audit provider to conduct additional work, beyond the scope of the internal audit, can potentially be perceived to be a conflict of interest and, therefore, could undermine the objectivity of the provider. In each of these 25 cases, the nature and amount of the additional work did not appear to pose a conflict of interest.
4.3.1 Policies
The Standing Direction requires public sector entities to have an internal audit charter in place that is approved by the audit committee. The charter should outline the functions and responsibilities of internal audit, including the need for internal audit to be independent, to have direct reporting lines to both senior management and the audit committee chair, and for the function to have unhindered access to staff and records at the entity.
Thirty public hospitals (35 per cent) did not have a stand-alone internal audit charter, although a third of these had included some of the requirements of the document in the audit committee charter instead. It is recommended that all public hospitals develop a separate internal audit charter that can enable the public hospital to operate an effective and efficient internal audit function.
For those hospitals with an internal audit charter in place, the documents typically contained the elements of better practice outlined in Figure 4A, including:
- details of roles and responsibilities
- clear reporting lines to management and the audit committee
- need for operational independence
- requirement for a periodic review of the charter.
However, the following better practice elements were not generally addressed:
- outline of the process for selecting the internal audit service provider
- arrangements for reporting conflicts of interest of internal auditors
- arrangements for review of the policies and charters.
Most concerning is the lack of arrangements for the reporting of potential conflicts of interest relating to the internal audit function. Details relating to this process were included in the charter for only 19 public hospitals.
A key aspect of the internal audit function is its independence from the entity's management, staff and functions, which enables it to provide objective advice and assurance to the audit committee, board and senior management. The internal audit charter should outline processes to ensure the audit committee is made aware of, and assesses any potential perceived or actual conflict of interests. The charter should outline actions to be taken to mitigate the conflict if required.
4.3.2 Management practices
An internal audit plan outlines the audits that will be undertaken at an entity by internal audit. It is better practice for the plan to cover a three-year period, and for it to demonstrate how the proposed audits align to an entity's risk register. It should be developed by internal audit, in consultation with management. These plans are normally supplemented with a more detailed document outlining the scope, cost and timing of each upcoming internal audit for the next financial year. In line with the Standing Direction, the internal audit plan must be approved by the entity's audit committee.
Internal audit plans
Of the 85 public hospitals with an internal audit function, 80 had an internal audit plan covering the 2013–14 financial year.
Our review noted that these internal audit plans did not align well with individual public hospitals' risk registers. By linking the plan to an established risk register, the audit committee and management are able to use the internal audit function to mitigate areas of risk specific to their entity and operating framework. By not doing so, the internal audit function will be less effective at highlighting ineffective or inefficient processes within the public hospital that relate to the higher risks faced by the hospital.
Approval and oversight of the plan
Seventy-nine of the 80 public hospitals with an internal audit plan had their plan approved by the audit committee. By not having the audit committee approve the plan, East Wimmera Health Service is not complying with the Standing Direction, and is reducing the independence of the plan by allowing management to approve the document.
For these 80 public hospitals, regular updates are provided to the audit committee regarding the status of the internal audit plan as it is actioned during the financial year. These updates allow the audit committee to assess if the plan is on track, however, while these updates focus on the progress of the plan, they do not always include changes in the scope of audits, or details of cost deviations from the plan. By including this additional information, audit committees can make more informed decisions about potential amendments to the plan to make sure they continue to receive the level of assurance they require.
Recent internal audits of key business areas
Whilst internal audit plans should be tailored to target the key risks of an individual public hospital, we identified eight key business activities that pose common risks to all 87 public hospitals, which are listed below. Public hospitals were assessed as to whether or not these activities had been subject to internal audit scrutiny over the past three years.
During the past three years, internal audit functions have reviewed and reported on the following key business activities common to most public hospitals:
- compliance with regulatory requirements at 67 (77 per cent) public hospitals
- controls over payroll at 61 (70 per cent) public hospitals
- controls over revenue at 58 (67 per cent) public hospitals
- controls over cash management at 43 (49 per cent) public hospitals
- data security at 43 (49 per cent) public hospitals
- data quality at 40 (46 per cent) public hospitals
- controls over asset management at 33 (38 per cent) public hospitals
- controls over patient coding at 31 (36 per cent) public hospitals.
The reports on payroll, revenue and data-related audits typically identified high-risk related findings for management to action. Boards of public hospitals should make sure they have appropriate levels of assurance—through internal audit or other appropriate sources—that controls in these areas are operating effectively.
The comparatively lower coverage of cash management is concerning given that cash is highly susceptible to theft and also given the extent of liquidity risks at many public hospitals. Cash management is of critical importance to the ongoing management of hospital operations. Internal audit reviews may help improve controls in this area.
Patient coding, which identifies and categorises the treatments being provided by a hospital to a patient, is a key source of information used by a hospital in calculating and requesting funding from the Department of Health and Human Services—the former Department of Health (DH). Patient coding has been reviewed by internal audit less than any other operational area. However, rather than being an area for concern, this is reflective of the high level of assurance reviews of this area by other sources. These reviews include regular, independent audits of public hospital coding practices by DH, and regular internal management reviews of this area by hospitals themselves.
4.3.3 Governance and oversight
Reporting to the audit committee
In line with better practice, public hospital audit committees receive and review internal audit reports of the audits identified in the plan.
It is a requirement of the Standing Direction that audit committees monitor actions taken by management to follow up and resolve issues raised by internal audit through these audits. Only 78 (92 per cent) of public hospitals with an internal audit function undertake this process.
As well as not complying with the Standing Direction, the seven hospitals who do not have procedures in place to allow the audit committee to undertake this review are reducing the level of assurance that the committee can have regarding risks arising from the internal audit findings being mitigated.
Periodic review of internal audit arrangements
Seventy (82 per cent) of the 85 public hospitals with an internal function review the performance of the function annually. These reviews are against set performance criteria—such as performance indicators included in a contract—and through direct feedback from management and auditees regarding the processes and outcomes of individual audits. Such reviews are used to check that the internal audit function is operating within the requirements of the internal audit charter, and enable the audit committee to identify and resolve any issues in a timely manner.
4.3.4 Cost
The 85 public hospitals collectively spent around $4 million on internal audit functions in both the 2012–13 and 2013–14 financial years. In 2013–14, this represented 0.03 per cent of overall expenditure in the sector, which is significantly less than the 0.13 per cent spent by portfolio departments on their internal audit functions in the same period. More than 60 per cent of this expenditure was at metropolitan hospitals.
The average annual expenditure on internal audit by an individual public hospital is shown in Figure 4B.
Figure 4B
Average expenditure on internal audit
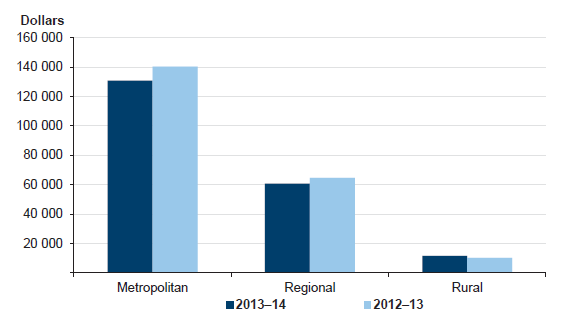
Source: Victorian Auditor-General's Office.
Figure 4B highlights the significant variation in expenditure across the sector. Metropolitan hospitals spend an average of almost $150 000 per annum on internal audits, while rural hospitals spend approximately $10 000. While this variation is largely due to differences in scale and operational risks between the larger 'flagship' metropolitan hospitals, and the smaller community-based rural hospitals, it also highlights the potential inability of rural hospitals to conduct sufficient internal audit work given their average expenditure. A lack of appropriate investment in the internal audit function by these entities may mean that their boards and audit committees are not getting the level of assurance they need to ensure that key controls are operating effectively.
Recommendations
- That Dunmunkle Health Service and Casterton Memorial Hospital establish and maintain an internal audit function.
That public hospital boards and management:
- have in place stand-alone internal audit charters that provide a clear framework for the selection, operation and oversight of the internal audit function
- establish a process for the identification, communication, assessment and mitigation of conflicts of interest between internal audit and the public hospital
- work with their internal audit function to develop and implement a three-year audit plan that is approved by the audit committee, and which aligns with the risks identified in the hospital's risk register
- review their internal audit plan to ensure that the internal audit function is providing the level of assurance required
- undertake annual performance reviews of the internal audit function to ensure it continues to operate in line with the internal audit charter.
5 Asset maintenance
At a glance
Background
To provide quality services at an efficient cost, public hospitals need to ensure their assets are maintained to an appropriate state of repair. At 30 June 2014, public hospitals operated assets valued at $11.9 billion ($9.6 billion at 30 June 2013) that require ongoing maintenance. In the 2013–14 financial year, public hospitals spent $232 million maintaining these assets ($212 million in 2012–13).
Conclusion
Rural public hospitals are spending a significantly smaller proportion of the value of their asset base on asset maintenance, compared to the larger regional and metropolitan hospitals. Under-maintaining assets means a public hospital is at risk of not being able to efficiently provide a service.
The public hospitals' funding model does not progressively provide funding to public hospitals to match the depreciation of their assets.
Overall, public hospitals can make improvements to their asset maintenance strategies, procedures and oversight to enable them to make better informed decisions regarding the level and type of asset maintenance required to provide services.
Findings
- Spending on asset maintenance as a portion of public hospitals' net asset base fell in 2013–14 compared to the prior year.
- Forty-eight public hospitals did not have a policy or strategy in place that addresses asset maintenance.
Recommendations
That public hospital boards and management:
- implement better practice asset management strategies to provide a framework for asset maintenance decisions
- maintain comprehensive and appropriate information regarding asset maintenance requirements to assist in strategic asset management planning.
5.1 Introduction
Public hospitals are required to efficiently and effectively deliver health services to their communities across Victoria. To provide these services, they have to ensure their assets are maintained to a suitable level of repair. Poor asset maintenance could result in the inability of a public hospital to efficiently and effectively provide a service to the public.
At 30 June 2014, public hospitals operated assets valued at $11.9 billion ($9.6 billion at 30 June 2013) that require ongoing maintenance—such as buildings, medical equipment and operational equipment, including patient beds and information technology equipment.
In the 2013–14 financial year, public hospitals spent $232 million maintaining these assets ($212 million in 2012–13).
Asset maintenance is a cycle of continuous monitoring of the condition of an asset, and having a regular plan of action to ensure the asset remains at a particular standard of operation, or in a particular state of repair.
To do this, public hospitals must develop appropriate strategic plans to set the benchmarks for asset conditions—based on each type of asset—and clear guidelines regarding the expected level of maintenance needed for these assets to maintain services to the public through the use of those assets. The strategic plan should be linked to the capital works plan, so that public hospitals can make informed decisions regarding the life of an asset and its potential replacement date.
Inadequate asset maintenance can present significant risks for public hospitals, particularly in the long term, as they may have difficulty meeting a growing demand for services and increasing expectations of quality. These risks must be appropriately recognised and managed to ensure service delivery objectives are effectively and efficiently realised.
5.2 Key elements of asset maintenance
Public hospitals are encouraged to refer to the government's Sustaining Our Assets policy, and the accompanying guidance for implementing asset management policies and practices.
The key elements of effective asset maintenance procedures are detailed in Figure 5A. The table draws on the Sustaining Our Assets policy, the Department for Victorian Communities' 2004 Guidelines for Developing an Asset Management Policy, Strategy and Plan and the Australian National Audit Office's 2010 Better Practice Guide on the Strategic and Operational Management of Assets by Public Sector Entities. These documents assist public hospitals in assessing the adequacy of their internal asset management policies and practices.
Figure 5A
Key elements of effective asset maintenance
|
Component |
Key elements |
|---|---|
|
Asset management policies and strategies |
Asset maintenance strategy is in place that aligns with business strategy. Comprehensive asset management strategy, comprising of:
Policy should cover:
|
|
Management practices |
Maintenance of an asset register. Adherence to asset maintenance policies and relevant legislative requirements. Appropriate segregation of duties over the authorisation of asset maintenance. Evaluation of asset performance, through assessment of physical condition, utilisation, functionality and financial performance. Periodic management review of policies, practices and processes. Comprehensive review of assets held, condition of significant assets, and the replacement cycle. Ranking and evaluation of acquisition proposals to determine most effective use of limited capital funding. Comprehensive reporting to the board and executive. |
|
Governance and oversight |
Monitoring compliance with policy requirements. Review and approval of the asset management strategy. Assessing risks associated with inadequate asset maintenance. Engaging internal audit to review policy compliance and practices. Periodic review of asset maintenance policies and practices. |
Source: Victorian Auditor-General's Office.
These elements were considered in our assessment of the asset maintenance function in each of the public hospitals.
Conclusion
Rural public hospitals are spending a significantly smaller proportion of the value of their asset base on asset maintenance, compared to the larger regional and metropolitan hospitals. Under-maintaining assets means a public hospital is at risk of not being able to efficiently and effectively provide a service, or may have to find funding to replace an asset earlier than expected—potentially diverting money from other services.
This is particularly worrying at rural public hospitals due to their community-based nature, as there is often no local alternative for users to access health services if the hospital is unable to provide it.
Public hospitals should have strong asset maintenance strategies, procedures and oversight to enable them to make informed decisions regarding the level and type of asset maintenance required to provide the services required. However, only 48 of the 87 public hospitals have an asset maintenance strategy in place. Approximately half of the public hospitals do not provide regular or detailed reports to boards and executive management to enable them to make informed decisions regarding asset maintenance and/or replacement.
5.3 Asset maintenance spending
There is no ideal level of asset maintenance spending at a particular type of entity, as this is heavily dependent on the type of assets held and the condition they need to be maintained at to provide the services or outputs/outcomes required. However, all public hospitals provide similar services based on similar assets, so it is possible to ascertain any differences in asset maintenance spending across the sector.
The amount of spending on asset maintenance across these public hospitals during the financial years 2009–10 to 2013–14 is detailed in Figure 5B.
Figure 5B
Asset maintenance spending per public hospital category 2009–10 to 2013–14 ($ million)
|
Category of public hospital |
2009–10 |
2010–11 |
2011–12 |
2012–13 |
2013–14 |
|---|---|---|---|---|---|
|
Metropolitan |
125.2 |
135.5 |
141.2 |
152.9 |
169.8 |
|
Regional |
37.9 |
40.6 |
39.8 |
41.7 |
45.0 |
|
Rural |
16.0 |
17.0 |
18.6 |
17.6 |
17.7 |
|
Total |
179.1 |
193.1 |
199.6 |
212.2 |
232.5 |
Source: Victorian Auditor-General's Office.
Overall, public hospitals have spent the equivalent of 2.0 per cent of their asset base on asset maintenance in 2013–14 (2.2 per cent in 2012–13).
Figure 5C shows the percentage of spending on asset maintenance against the asset base across the public hospital categories of metropolitan, regional and rural during the financial years 2009–10 to 2013–14.
Figure 5C
Percentage of net asset base spent on asset maintenance per public hospital category 2009–10 to 2013–14
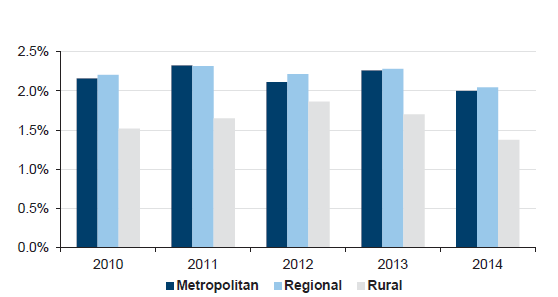
Note: In line with the financial reporting direction FRD103E Non-Financial Physical Assets, a sector-wide revaluation of assets occurs every five years. For the hospital sector, the most recent valuation occurred on 30 June 2014.
Source: Victorian Auditor-General's Office.
Rural public hospitals
Rural public hospitals are spending a significantly smaller portion of their maintainable net asset base on maintenance than the larger regional and metropolitan public hospitals. This is partly reflective of the nature of the assets held by rural public hospitals. For example, the larger metropolitan public hospitals have to maintain more specialised buildings and equipment.
However, this is a worrying trend as the rural public hospitals are often the only entity providing health services to a local community. If these public hospitals were unable to offer a particular service due to poor asset maintenance, the community would be severely disadvantaged due to the lack of alternative options. This is less of a risk in the areas serviced by the regional and metropolitan public hospitals due to the greater number of hospitals in these areas, providing alternative options for the provision of a service.
As shown in Figure 5C, the trend of lower spending at rural public hospitals has been consistent over the past five financial years. There is a risk that continual low maintenance of assets may build up longer-term problems for these hospitals, including the need to replace assets earlier than expected. Replacing assets will require government funding as rural public hospitals do not have the same ability as other hospital cohorts to generate self-funded revenue through other services, and this raises potential risks for these rural public hospitals.
Reduced spending across the sector
Figure 5C also illustrates that spending on asset maintenance across all three categories of public hospitals has decreased as a percentage of the asset base in 2013–14 compared to the prior financial year.
While this is reflective of the increasing value of assets and the tightening fiscal environment in which public hospitals must operate—including the impact of the 2 per cent efficiency savings imposed on the Health Sector by the 2013–14 State Budget—public hospitals must ensure that current lower levels of asset maintenance spending does not create longer-term problems, such as the need to fund the replacement of assets earlier than expected.
By having strong asset maintenance strategies, practices and oversight mechanisms in place, public hospitals will better maintain their assets to the required levels within their tight financial environment, and will be able to make more informed financial decisions regarding longer-term capital plans.
5.4 Asset maintenance functions
5.4.1 Policies
Fifty-five per cent of public hospitals (48 of the 87) had no high-level asset maintenance strategy in place.
Forty-five per cent of public hospitals (39 of the 87) had a policy in place that addressed asset maintenance in some way. These policies or strategies contained some or all of the better practice elements outlined in Figure 5A. Of these hospitals, the following better practice elements were commonly incorporated:
- roles and responsibilities
- approach to asset maintenance and replacement
- maintenance of an asset register
- systems and procedures for measurement of asset performance
- maintenance plan
- regular reviews and reporting.
However, the following better practice elements were not addressed by a number of public hospitals:
- adequacy of maintenance spending
- life cycle maintenance and costing—including future requirements
- contingency plans for maintenance of assets after natural disasters
- funding plan and requirements
- risk management plan.
Public hospitals need to have a comprehensive framework in place that provides clear guidance on the assessment of the condition of fixed assets held, the minimum—and ideal—level of maintenance required to keep an asset at an acceptable condition, and the priorities to be applied to asset maintenance schedules. This is particularly important for assets that are essential for the hospital to be able to provide critical services.
Without this, ultimately, assets may deteriorate to a level where service delivery is impacted and/or replacements are required that may take funding away from other areas of service delivery.
Review of policy and charter
Thirty-five of the 39 public hospitals (90 per cent) that had asset maintenance policies had reviewed them in the past three years.
5.4.2 Management practices
Management at 84 public hospitals (97 per cent) had developed a maintenance plan outlining levels of work to be achieved, and regularly reported to the audit committee or board.
Management practices typically addressed the following better practice elements:
- maintenance of an asset register
- periodic management review
- comprehensive reporting to the executive and board
- assessing risk associated with inadequate asset maintenance.
Management practices could be improved to:
- ensure adherence to asset maintenance policies
- review assets held, condition of significant assets and the replacement cycle
- monitor, evaluate and report on asset performance.
The consistent lack of condition assessments of assets held by a public hospital is concerning, as without this information a hospital cannot set an appropriate maintenance plan to keep the asset at an accepted standard of repair. This may mean that assets are 'over maintained'—costing money that could be redirected elsewhere—or 'under maintained' resulting in the need to replace the asset earlier than expected.
Ongoing condition assessments of current assets used by public hospitals also provide a key source of information to assist with the strategic planning and oversight of the hospital. This ranges from ensuring the right financial information is reported to the board regarding assets in the annual financial statements to, for example, being able to set the capital works plan to build new, and replace current, assets.
Asset maintenance software
Asset maintenance software provides a useful tool for management and assists public hospitals to manage the maintenance of their critical assets effectively. In particular, it provides a tailored method to monitor, evaluate and report on asset performance to key stakeholders within the public hospital.
Across the sector, only 48 of the 87 public hospitals (55 per cent) used asset maintenance software. The hospitals that used asset maintenance software incorporated the following key elements into the software package:
- frequency of asset maintenance
- maintenance expenditure.
Of those that utilise asset maintenance software, improvements in the asset maintenance software at those hospitals could be made by incorporating the following into the system:
- a condition assessment of high-risk assets
- a ranking of high-risk assets
- a link to the hospital's risk register.
While the software used by public hospitals incorporated key features to assist with effective asset maintenance, only 43 public hospitals (49 per cent) generated reports from their maintenance systems that would allow management and boards to make informed strategic maintenance decisions.
Effective asset maintenance practices by management are essential to delivering the best possible outcomes to patients in public hospitals. Management should ensure that key hospital assets are identified and their condition monitored regularly to best plan for their ongoing maintenance and replacement. This would be best achieved through the use of maintenance software that can both produce insightful reports for management, and link to hospitals' risk registers.
5.4.3 Governance and oversight
The oversight of asset maintenance policies, practices and spending is a key part of ensuring asset performance remains at appropriate levels.
Approximately 50 per cent of public hospitals provide reports to their board and executive management regarding the asset maintenance program. The frequency and detail of these reports varied significantly.
Governance and oversight practices could be improved to:
- monitor compliance with policy requirements
- engage internal audit to review policy compliance and practices
- ensure long-term maintenance requirements are met.
Without adequate and appropriate information, boards and executive management cannot assess how well the asset maintenance strategic plan for the hospital is operating, and they cannot use this information in preparing their capital works/spending plans regarding the replacement of assets. Detailed information will help to ensure that assets are replaced at the right time, and to enable the best level of services to be maintained. Only 40 per cent of public hospitals sought to incorporate their asset maintenance plan into their strategic planning.
Another key tool for the oversight of the asset maintenance policy and practices is an internal audit review. This review would inform senior management and the board of any potential weaknesses regarding the maintenance of assets at the hospital. These can then be mitigated prior to having an impact on service delivery.
Only 26 of the 87 public hospitals (30 per cent) had engaged their internal auditors to review their asset maintenance strategy or function.
Recommendations
That public hospital boards and management:
- implement better practice asset management strategies to provide a framework for asset maintenance decisions
- undertake comprehensive asset condition assessments to enable individual asset maintenance plans to be created and actioned
- maintain comprehensive and appropriate information regarding asset maintenance requirements to assist in strategic asset management planning.
Appendix A. VAGO reports on the results of financial audits
This report is part of a suite of reports presented to Parliament covering the results of our audits of public sector financial reports. The reports are outlined in Figure A1.
Figure A1
VAGO reports on the results of the 2013–14 financial audits
|
Report |
Description |
|---|---|
|
Information and Communication Technology Controls Report 2013–14 |
The report provides an analysis of common themes relating to IT audit findings and the maturity of IT controls across selected entities and highlights key and emerging issues observed as part of the IT audits. Tabled in Parliament in October 2014. |
|
Auditor-General's Report on the Annual Financial Report of the State of Victoria, 2013–14 |
The report provides the result of the audit of the state's annual financial report. It addresses the quality and timing of financial reporting and explains significant financial results for the state. Tabled in Parliament in November 2014. |
|
Water Entities: Results of the 2013–14 Audits |
The report provides the results of the audits of 20 entities in the water sector. The report addresses their financial and performance reporting and financial sustainability risks. It also addresses governance arrangements relating to gifts, benefits and hospitality, and audit committees. Tabled in Parliament in February 2015. |
|
Portfolio Departments and Associated Entities: Results of the 2013–14 Audits |
The report provides the results of the audits of 210 entities and comments on their timeliness and accuracy. The report also considers the financial sustainability risks of self-funded agencies, the internal audit function at portfolio departments, controls relating to infringement notices, the state's insurance agencies' compliance with the Prudential Insurance Standards and developments of significant projects and Private Public Partnerships during 2013–14. Tabled in Parliament in February 2015. |
|
Public Hospitals: Results of the 2013–14 Audits |
The report provides the results of the audits of approximately 110 entities in the public hospital sector. The report addresses their financial performance and financial sustainability risks, their internal audit functions, and their management of asset maintenance. This report. |
|
Local Government: Results of the 2013–14 Audits |
The report provides the results of the audits of 103 entities in the local government sector. The report will address their financial and performance reporting, financial sustainability risks, oversight arrangements for grants, and creditor management practices and governance. To be tabled in Parliament in February 2015. |
|
Universities: Results of the 2014 Audits |
The report provides the results of the audits of 64 entities in the university sector. The report will address their financial reporting and financial sustainability risk, and internal controls relating to travel and accommodation expenditure. To be tabled in Parliament in May 2015. |
|
Technical and Further Education Institutes: Results of the 2014 Audits |
The report provides the results of the audits of 25 entities in the technical and further education institutes sector. The report will address their financial reporting and financial sustainability risks, and internal controls relating to risk management practices. To be tabled in Parliament in May 2015. |
Source: Victorian Auditor-General's Office.
Appendix B. Completed audit listing
Metropolitan hospitals and associated entities
|
Audit type |
Financial report |
Finalised within statutory time frame |
||||
|---|---|---|---|---|---|---|
|
Entity |
FMA |
Non-FMA |
Clear opinion issued |
Auditor-General's report signed |
Met |
Not met |
| COMPLETED AUDITS WITHIN 30 JUNE 2014 BALANCE DATES | ||||||
|
Alfred Health |
● |
✔ |
15 Aug 2014 |
● |
||
|
Whole Time Medical Specialists Private Practice Trust |
O |
✔ |
30 Sept 2014 |
● |
||
|
Austin Health |
● |
✔ |
15 Aug 2014 |
● |
||
|
Calvary Health Care Bethlehem Ltd |
O |
✔ |
22 Aug 2014 |
● |
||
|
Dental Health Services Victoria |
● |
✔ |
15 Aug 2014 |
● |
||
|
Eastern Health |
● |
✔ |
11 Aug 2014 |
● |
||
|
Melbourne Health |
● |
✔ |
13 Aug 2014 |
● |
||
|
Royal Melbourne Hospital Foundation Ltd |
O |
✔ |
21 Aug 2014 |
● |
||
|
Mercy Public Hospitals Inc |
● |
✔ |
15 Aug 2014 |
● |
||
|
Monash Health |
● |
✔ |
22 Aug 2014 |
● |
||
|
Kitaya Holdings Pty Ltd |
C |
✔ |
22 Aug 2014 |
● |
||
|
Northern Health |
● |
✔ |
19 Aug 2014 |
● |
||
|
Northern Health Research, Training and Equipment Foundation Limited |
O |
✔ |
19 Aug 2014 |
● |
||
|
Northern Health Research, Training and Equipment Trust |
O |
✔ |
19 Aug 2014 |
● |
||
|
Peninsula Health |
● |
✔ |
20 Aug 2014 |
● |
||
|
Peter MacCallum Cancer Centre |
● |
✔ |
18 Aug 2014 |
● |
||
|
Cell Therapies Pty Ltd |
C |
✔ |
7 Aug 2014 |
● |
||
|
Cellularity Pty Ltd |
C |
✔ |
7 Aug 2014 |
● |
||
|
Peter MacCallum Cancer Foundation |
O |
✔ |
14 Aug 2014 |
● |
||
|
Peter MacCallum Cancer Foundation Ltd |
O |
✔ |
14 Aug 2014 |
● |
||
|
Queen Elizabeth Centre |
● |
✔ |
28 Aug 2014 |
● |
||
|
Royal Children's Hospital |
● |
✔ |
18 Aug 2014 |
● |
||
|
Communities That Care Limited |
O |
✔ |
5 Sep 2014 |
● |
||
|
Royal Children's Hospital Education Institute Ltd |
O |
✔ |
15 Aug 2014 |
● |
||
|
Royal Children's Hospital Foundation Trust Funds |
O |
✔ |
18 Aug 2014 |
● |
||
|
Royal Victoria Eye and Ear Hospital |
● |
✔ |
19 Aug 2014 |
● |
||
|
Royal Women's Hospital |
● |
✔ |
22 Aug 2014 |
● |
||
|
Royal Women's Hospital Foundation Limited |
O |
✔ |
29 Aug 2014 |
● |
||
|
Royal Women's Hospital Foundation Trust Fund |
O |
✔ |
29 Aug 2014 |
● |
||
|
St. Vincent's Hospital (Melbourne) Limited |
C |
✔ |
21 Aug 2014 |
● |
||
|
Tweddle Child and Family Health Services |
● |
✔ |
11 Sep 2014 |
● |
||
|
Victoria Comprehensive Cancer Centre Joint Venture |
O |
✔ |
8 Aug 2014 |
● |
||
|
Victoria Comprehensive Cancer Centre Ltd |
O |
✔ |
8 Aug 2014 |
● |
||
|
Western Health |
● |
✔ |
18 Aug 2014 |
● |
||
|
Western Health Foundation Limited |
O |
✔ |
7 Oct 2014 |
● |
||
|
2013–14 Total number of entities = 35 |
16 |
19 |
35 |
0 |
||
|
Per cent |
100 |
0 |
||||
|
2012–13 Total number of entities = 35 |
21 |
14 |
34 |
1 |
||
|
Per cent |
97 |
3 |
||||
Note: Non-FMA audit types: C – Corporations Act 2001 and O – other reporting framework.
Source: Victorian Auditor-General's Office.
Regional hospitals and associated entities
|
Audit type |
Financial report |
Finalised within statutory time frame |
||||
|---|---|---|---|---|---|---|
|
Entity |
FMA |
Non-FMA |
Clear opinion issued |
Auditor-General's report signed |
Met |
Not met |
|
COMPLETED AUDITS WITHIN 30 JUNE 2014 BALANCE DATES |
||||||
|
Albury Wodonga Health |
● |
✔ |
22 Aug 2014 |
● |
||
|
Bairnsdale Regional Health Service |
● |
✔ |
22 Aug 2014 |
● |
||
|
Ballarat Health Services |
● |
✔ |
20 Aug 2014 |
● |
||
|
Barwon Health |
● |
✔ |
1 Aug 2014 |
● |
||
|
Bendigo Health Care Group |
● |
✔ |
22 Aug 2014 |
● |
||
|
Central Gippsland Health Service |
● |
✔ |
20 Aug 2014 |
● |
||
|
Echuca Regional Health |
● |
✔ |
22 Aug 2014 |
● |
||
|
Goulburn Valley Health |
● |
✔ |
8 Aug 2014 |
● |
||
|
Latrobe Regional Hospital |
● |
✔ |
22 Aug 2014 |
● |
||
|
Northeast Health Wangaratta |
● |
✔ |
22 Aug 2014 |
● |
||
|
South West Healthcare |
● |
✔ |
15 Aug 2014 |
● |
||
|
Swan Hill District Hospital |
● |
✔ |
13 Aug 2014 |
● |
||
|
West Wimmera Health Service |
● |
✔ |
18 Aug 2014 |
● |
||
|
Western District Health Service |
● |
✔ |
8 Aug 2014 |
● |
||
|
Wimmera Health Care Group |
● |
✔ |
20 Aug 2014 |
● |
||
|
2013–14 Total number of entities = 15 |
15 |
0 |
15 |
0 |
||
|
|
Per cent |
100 |
0 |
|||
|
2012–13 Total number of entities = 17 |
16 |
1 |
17 |
0 |
||
|
Per cent |
100 |
0 |
||||
Note: Non-FMA audit types: C – Corporations Act 2001 and O – other reporting framework.
Source: Victorian Auditor-General's Office.
Rural hospitals and associated entities
|
Audit type |
Financial report |
Finalised within statutory time frame |
||||
|---|---|---|---|---|---|---|
|
Entity |
FMA |
Non-FMA |
Clear opinion issued |
Auditor-General's report signed |
Met |
Not met |
|
COMPLETED AUDITS WITHIN 30 JUNE 2014 BALANCE DATES |
||||||
|
Alexandra District Hospital |
● |
✔ |
18 Aug 2014 |
● |
||
|
Alpine Health |
• |
✔ |
21 Aug 2014 |
● |
||
|
Bass Coast Regional Health |
● |
✔ |
29 Aug 2014 |
● |
||
|
Beaufort and Skipton Health Service |
● |
✔ |
26 Aug 2014 |
● |
||
|
Beaufort and Skipton Health Service Foundation Ltd |
O |
✔ |
26 Aug 2014 |
● |
||
|
Beechworth Health Service |
● |
✔ |
21 Aug 2014 |
● |
||
|
Benalla and District Memorial Hospital |
● |
✔ |
19 Aug 2014 |
● |
||
|
Boort District Hospital |
● |
✔ |
11 Aug 2014 |
● |
||
|
Casterton Memorial Hospital |
● |
✔ |
15 Aug 2014 |
● |
||
|
Castlemaine Health |
● |
✔ |
22 Aug 2014 |
● |
||
|
Cobram District Hospital |
● |
✔ |
27 Aug 2014 |
● |
||
|
Cohuna District Hospital |
● |
✔ |
22 Aug 2014 |
● |
||
|
Cohuna Community Nursing Home Inc. |
O |
✔ |
22 Aug 2014 |
● |
||
|
Colac Area Health |
● |
✔ |
15 Aug 2014 |
● |
||
|
Djerriwarrh Health Services |
● |
✔ |
18 Aug 2014 |
● |
||
|
Dunmunkle Health Services |
● |
✔ |
20 Aug 2014 |
● |
||
|
East Grampians Health Service |
● |
✔ |
27 Aug 2014 |
● |
||
|
East Grampians Health Building for the Future Foundation |
O |
✔ |
27 Aug 2014 |
● |
||
|
East Wimmera Health Service |
● |
✔ |
18 Aug 2014 |
● |
||
|
Edenhope and District Hospital |
● |
✔ |
13 Aug 2014 |
● |
||
|
Gippsland Southern Health Service |
● |
✔ |
29 Aug 2014 |
● |
||
|
Heathcote Health |
● |
✔ |
21 Aug 2014 |
● |
||
|
Hepburn Health Service |
● |
✔ |
22 Aug 2014 |
● |
||
|
Hesse Rural Health Service |
● |
✔ |
26 Aug 2014 |
● |
||
|
Winchelsea Hostel and Nursing Home Society |
O |
✔ |
5 Sep 2014 |
● |
||
|
Heywood Rural Health |
● |
✔ |
20 Aug 2014 |
● |
||
|
Inglewood and Districts Health Service |
● |
✔ |
22 Aug 2014 |
● |
||
|
Kerang District Health |
● |
✔ |
22 Aug 2014 |
● |
||
|
Kilmore and District Hospital |
● |
✔ |
20 Aug 2014 |
● |
||
|
Kooweerup Regional Health Service |
● |
✔ |
27 Aug 2014 |
● |
||
|
Kyabram and District Health Service |
● |
✔ |
22 Aug 2014 |
● |
||
|
Kyneton District Health Service |
● |
✔ |
27 Aug 2014 |
● |
||
|
LMHA Network Ltd |
C |
✔ |
17 Oct 2014 |
● |
||
|
Lorne Community Hospital |
● |
✔ |
22 Aug 2014 |
● |
|
|
|
Maldon Hospital |
● |
✔ |
22 Aug 2014 |
● |
||
|
Mallee Track Health and Community Services |
● |
✔ |
20 Aug 2014 |
● |
||
|
Mansfield District Hospital |
● |
✔ |
18 Aug 2014 |
● |
||
|
Maryborough District Health Service |
● |
✔ |
29 Aug 2014 |
• |
||
|
Moyne Health Services |
● |
✔ |
12 Aug 2014 |
● |
||
|
Nathalia District Hospital |
● |
✔ |
21 Aug 2014 |
● |
||
|
Numurkah District Health Service |
● |
✔ |
22 Aug 2014 |
● |
||
|
Omeo District Hospital |
● |
✔ |
29 Aug 2014 |
● |
||
|
Orbost Regional Health |
● |
✔ |
29 Aug 2014 |
● |
||
|
Otway Health & Community Services |
● |
✔ |
18 Aug 2014 |
● |
||
|
Portland District Health |
● |
✔ |
15 Aug 2014 |
● |
||
|
Robinvale District Health Service |
● |
✔ |
20 Aug 2014 |
● |
||
|
Rochester and Elmore District Health Service |
● |
✔ |
21 Aug 2014 |
● |
||
|
Rural Northwest Health |
● |
✔ |
22 Aug 2014 |
● |
||
|
Seymour District Memorial Hospital |
● |
✔ |
18 Aug 2014 |
● |
||
|
South Gippsland Hospital |
● |
✔ |
29 Aug 2014 |
● |
||
|
Stawell Regional Health |
● |
✔ |
20 Aug 2014 |
● |
||
|
Stawell Regional Health Foundation |
O |
✔ |
20 Aug 2014 |
● |
||
|
Tallangatta Health Service |
● |
✔ |
22 Aug 2014 |
● |
||
|
Terang and Mortlake Health Service |
● |
✔ |
13 Aug 2014 |
● |
||
|
Timboon and District Healthcare Service |
● |
✔ |
12 Aug 2014 |
● |
||
|
Upper Murray Health and Community Services |
● |
✔ |
22 Aug 2014 |
● |
||
|
West Gippsland Healthcare Group |
● |
✔ |
1 Sep 2014 |
● |
||
|
Yarram and District Health Service |
● |
✔ |
29 Aug 2014 |
● |
||
|
Yarrawonga District Health Service |
● |
✔ |
25 Aug 2014 |
● |
||
|
Yea and District Memorial Hospital |
● |
✔ |
21 Aug 2014 |
● |
||
|
2013–14 Total number of entities = 60 |
54 |
6 |
60 |
0 |
||
|
Per cent |
100 |
0 |
||||
|
2012–13 Total number of entities = 60 |
57 |
3 |
59 |
1 |
||
|
Per cent |
98 |
2 |
||||
Note: Non-FMA audit types: C – Corporations Act 2001 and O – other reporting framework.
Source: Victorian Auditor-General's Office.
Appendix C. Financial audit frameworks
Financial reporting framework
The principal legislation governing financial reporting by public hospitals are the Financial Management Act 1994 and the Corporations Act 2001.
Figure C1 sets out the legislative framework for each type of entity within the public hospital sector.
Figure C1
Legislative framework for public hospitals and associated entities
|
Legislative framework |
Public hospitals |
Entities controlled by public hospitals |
Other associated entities |
Total |
|---|---|---|---|---|
|
Financial Management Act 1994 |
84 |
– |
1 |
85 |
|
Corporations Act 2001 |
1 |
3 |
1 |
5 |
|
Other applicable legislative framework |
2 |
16 |
2 |
20 |
|
Total |
87 |
19 |
4 |
110 |
Source:Victorian Auditor-General's Office.
Financial audit framework
The financial audit framework applied in the conduct of the 2013–14 audits covered by this report is set out in Figure C2.
Figure C2
Financial audit framework
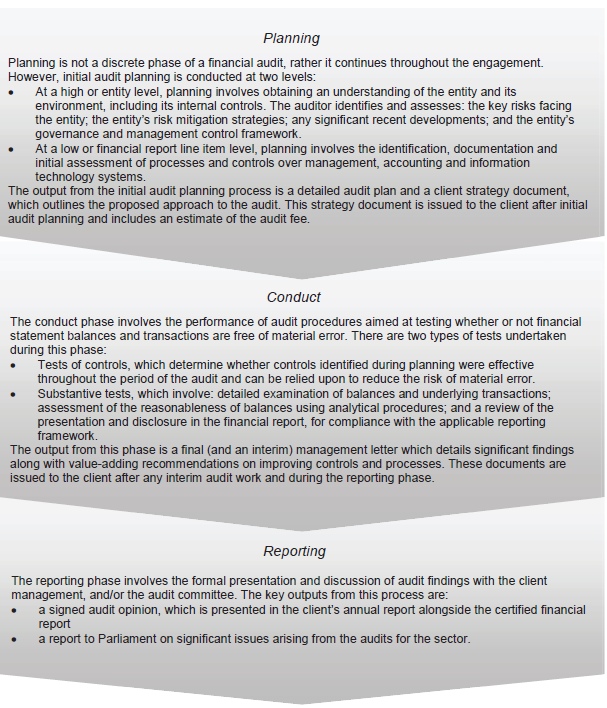
Source: Victorian Auditor-General's Office.
Internal control framework
Figure C3 identifies the main components of an effective internal control framework.
Figure C3
Components of an internal control framework
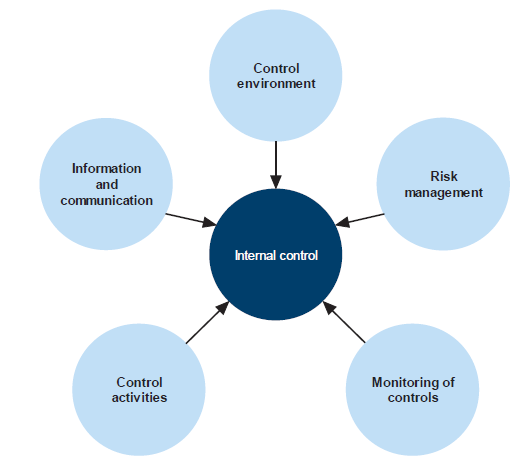
Source: Victorian Auditor-General's Office.
In the diagram:
- the control environment provides the fundamental discipline and structure for the controls and includes governance and management functions and the attitudes, awareness, and actions of those charged with governance and management of an entity
- risk management involves identifying, analysing and mitigating risks
- monitoring of controls involves observing the internal controls in practice and assessing their effectiveness
- control activities are policies, procedures and practices prescribed by management to help meet an entity's objectives
- information and communication involves communicating control responsibilities throughout the entity and providing information in a form and time frame that allows officers to discharge their responsibilities.
Financial report preparation
Our assessment of hospital financial report preparation against better practice was based on criteria outlined in Figure C4.
Figure C4
Financial report preparation better practice
|
Key area |
Better practice |
|---|---|
|
Financial report preparation plan |
Establish a plan that outlines the processes, resources, milestones, oversight, and quality assurance practices required in preparing the financial report. |
|
Preparation of shell statements |
Prepare a shell financial report and provide it to the auditors early to enable early identification of amendments, minimising the need for significant disclosure changes at year end. |
|
Materiality assessment |
Assess materiality, including quantitative and qualitative thresholds, at the planning phase in consultation with the audit committee. The assessment assists preparers to identify potential errors in the financial report. |
|
Monthly financial reporting |
Adopt full accrual monthly reporting to assist in preparing the annual financial report. This allows the year-end process to be an extension of the month-end process. |
|
Quality control and assurance procedures |
Require rigorous review of the supporting documentation, data and the financial report itself by an appropriately experienced and independent officer prior to providing it to the auditors. |
|
Supporting documentation |
Prepare high-standard documentation to support and validate the financial report and provide a management trail. |
|
Analytical reviews |
Undertake rigorous and objective analytical review during the financial report preparation process to help to improve the accuracy of the report. |
|
Reviews of controls/ self-assessment |
Establish sufficiently robust quality control and assurance processes to provide assurance to the audit committee on the accuracy and completeness of the financial report. |
|
Competency of staff |
The preparers of the financial report have a good understanding of, and experience in, applying relevant accounting standards and legislation. They also have effective project management and interpersonal skills. |
|
Financial compliance reviews |
Undertake periodic compliance reviews to identify areas of noncompliance or changes to legislation that impact the financial report. |
|
Adequate security |
Protect and safeguard sensitive information throughout the process to prevent inappropriate public disclosure. |
Source: Victorian Auditor-General's Office, and Australian National Audit Office Better Practice Guide Preparation of Financial Statements, June 2009.
Appendix D. Financial sustainability risk indicators and criteria
Indicators of financial sustainability
This Appendix sets out the financial indicators used in this report. The indicators should be considered collectively and are more useful when assessed over time, as part of a trend analysis. The indicators have been applied to the published financial information of the 87 public hospitals for the five year period 2009–10 to 2013–14.
The analysis of financial sustainability risks in this report reflects on the position of each individual hospital, the sector as a whole and on the basis of the three categories of public hospital—metropolitan, regional and rural.
The financial sustainability risk indicators are outlined below.
Figure D1
Financial sustainability risk indicators
|
Indicator |
Formula |
Description |
|---|---|---|
|
Underlying result (%) |
Adjusted net result / Total underlying revenue |
A positive result indicates a surplus, and the larger the percentage, the stronger the result. A negative result indicates a deficit. Operating deficits cannot be sustained in the long term. Underlying revenue does not take into account one‑off or non-recurring transactions. Net result and total underlying revenue is obtained from the comprehensive operating statement. |
|
Liquidity (ratio) |
Current assets / Current liabilities |
This measures the ability to pay existing liabilities in the next 12 months. A ratio of one or more means there are more cash and liquid assets than short-term liabilities. Current liabilities exclude long-term employee provisions and revenue in advance. |
|
Average number of days cash available (days) |
Unrestricted cash / (Total annual operating cash outflows / 365) |
This measures the number of days of operating expenses that a hospital could pay with its current cash available. Unrestricted cash available includes cash equivalents that can be easily converted to cash and excludes cash held where the use has been restricted—such as patient money held in trust or cash required to be used for a specific purpose. |
|
Self-financing (%) |
Net operating cash flows / Total underlying revenue |
This measures the ability to replace assets using cash generated by the entity's operations. The higher the percentage the more effectively this can be done. Net operating cash flows are obtained from the cash flow statement. |
|
Capital replacement (ratio) |
Cash outflows for property, plant and equipment / Depreciation |
Comparison of the rate of spending on infrastructure with an entity's depreciation. Ratios higher than 1:1 indicate that spending is greater than the depreciating rate. This is a long-term indicator, as capital expenditure can be deferred in the short term if there are insufficient funds available from operations, and borrowing is not an option. Cash outflows for infrastructure are taken from the cash flow statement. Depreciation is taken from the comprehensive operating statement. |
Source: Victorian Auditor-General's Office.
Financial sustainability risk assessment criteria
The financial sustainability of public hospitals has been assessed using the risk assessment criteria outlined in Figure D2.
Figure D2
Financial sustainability indicators—risk assessment criteria
|
Risk |
Underlying result |
Liquidity |
Average number of days cash available |
Self-financing |
Capital replacement |
|---|---|---|---|---|---|
|
High |
Less than negative 10% |
Less than 0.7 |
Less than 15 days |
Less than 10% |
Less than 1.0 |
|
Medium |
Negative 10% to 0 |
0.7–1.0 |
15–30 days |
10–20% |
1.0–1.5 |
|
Low |
More than 0 |
More than 1.0 |
More than 30 days |
20% or more |
More than 1.5 |
Source: Victorian Auditor-General's Office.
The overall financial sustainability risk assessment is calculated using the ratings determined for each indicator as outlined in Figure D3. The assessment is performed at the sector level, at the metropolitan, regional and rural category level and at the individual hospital level.
Figure D3
Overall financial sustainability risk assessment
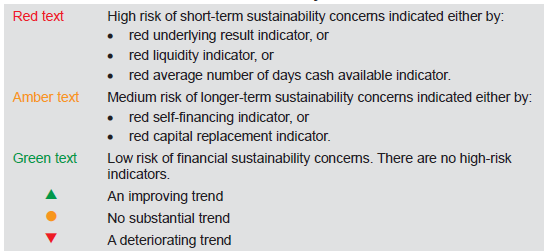
Source: Victorian Auditor-General's Office.
To be financially sustainable, hospitals must be able to meet their short-term financial obligations, and maintain some excess capacity to finance future capital and infrastructure development. As detailed in Figure D3, shorter-term and immediate sustainability concerns are assessed as high risk, and longer-term sustainability concerns are assessed as medium risk.
Metropolitan hospitals
Figure D4
Underlying result, 2010–14
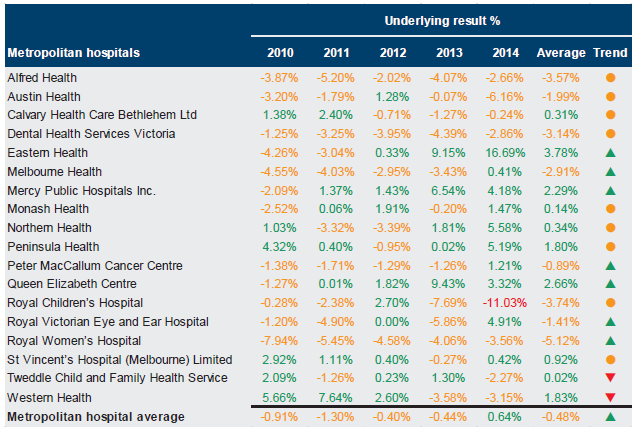
Source: Victorian Auditor-General's Office.
Figure D5
Liquidity, 2010–14
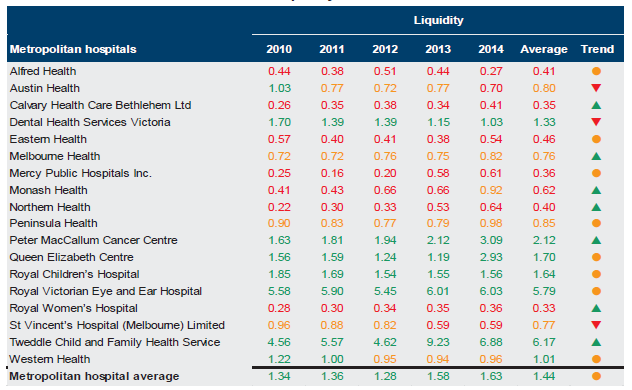
Source: Victorian Auditor-General's Office.
Figure D6
Average number of days cash available, 2010–14
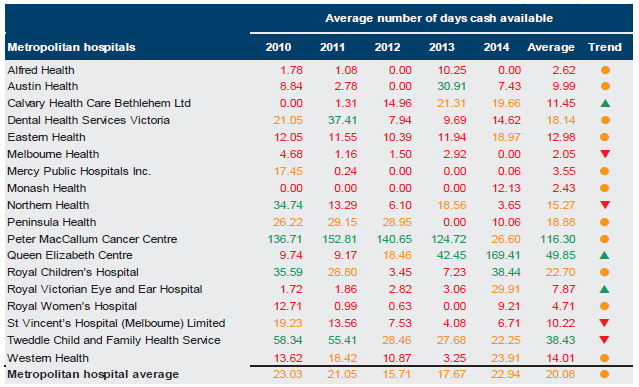
Note: Tweddle Child and Family Health Service advised that its reported balance for Cash at Bank in its 2013–14 financial statements was understated. This has been taken into account in the results for 2013–14.
Source: Victorian Auditor-General's Office.
Figure D7
Self-financing, 2010–14
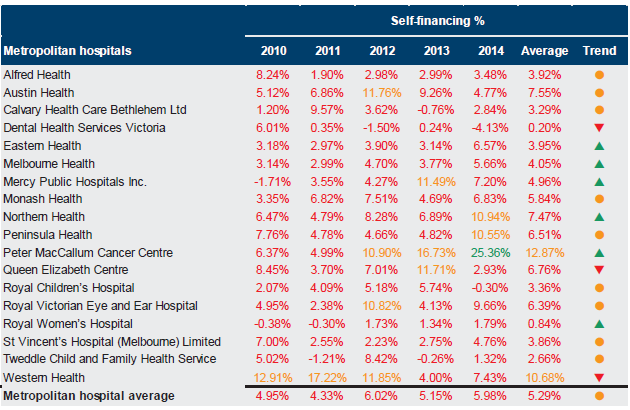
Source: Victorian Auditor-General's Office.
Figure D8
Capital replacement, 2010–14
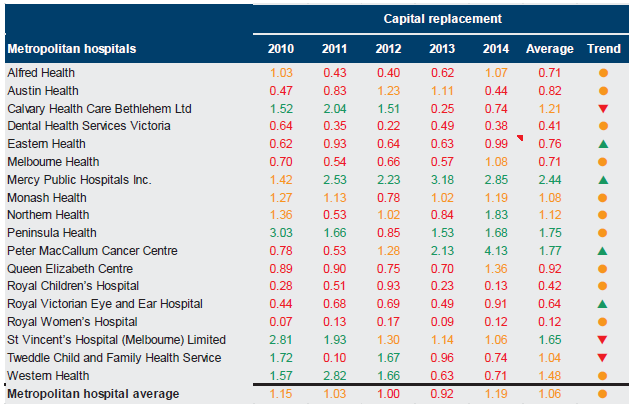
Source: Victorian Auditor-General's Office.
Regional hospitals
Figure D9 Underlying result, 2010–14
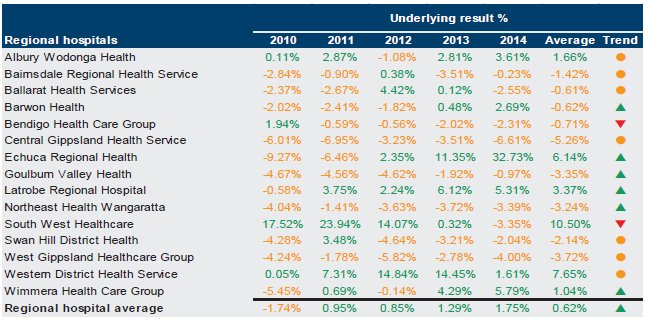
Source: Victorian Auditor-General's Office.
Figure D10
Liquidity, 2010–14
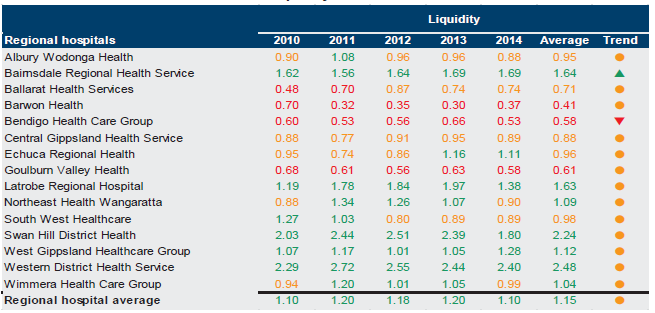
Source: Victorian Auditor-General's Office.
Figure D11
Average number of days cash available, 2010–14
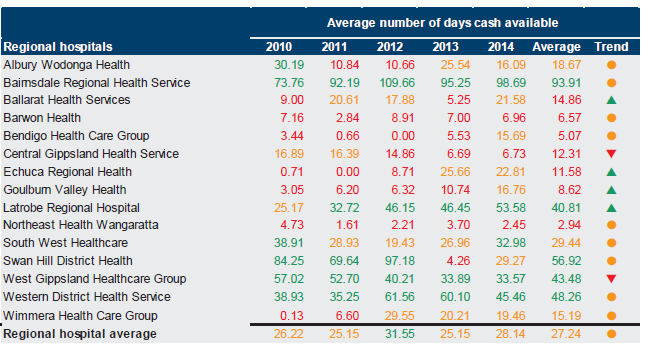
Source: Victorian Auditor-General's Office.
Figure D12
Self-financing, 2010–14
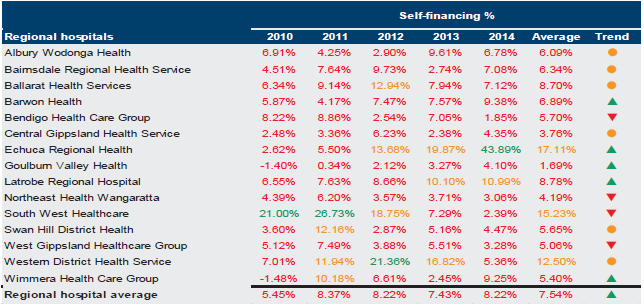
Source: Victorian Auditor-General's Office.
Figure D13
Capital replacement, 2010–14
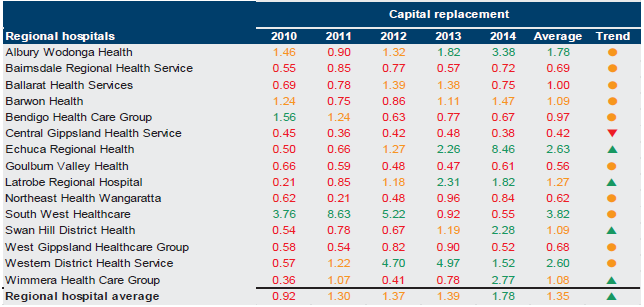
Source: Victorian Auditor-General's Office.
Rural hospitals
Figure D14
Underlying result, 2010–14
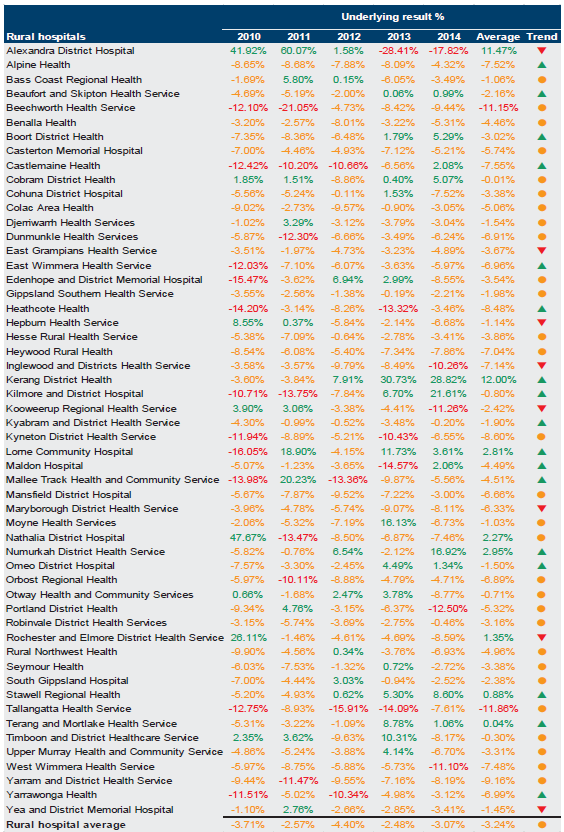
Source: Victorian Auditor-General's Office.
Figure D15
Liquidity, 2010–14
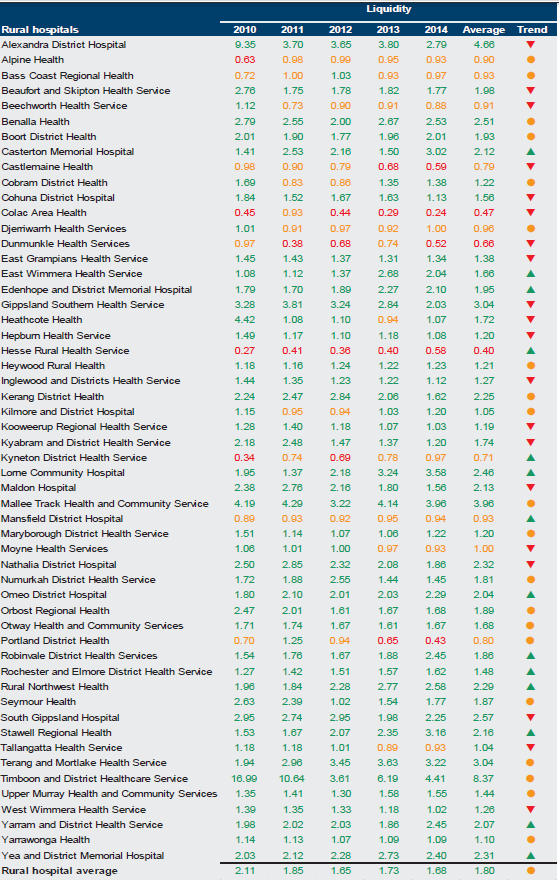
Source: Victorian Auditor-General's Office.
Figure D16
Average number of days cash available, 2010–14
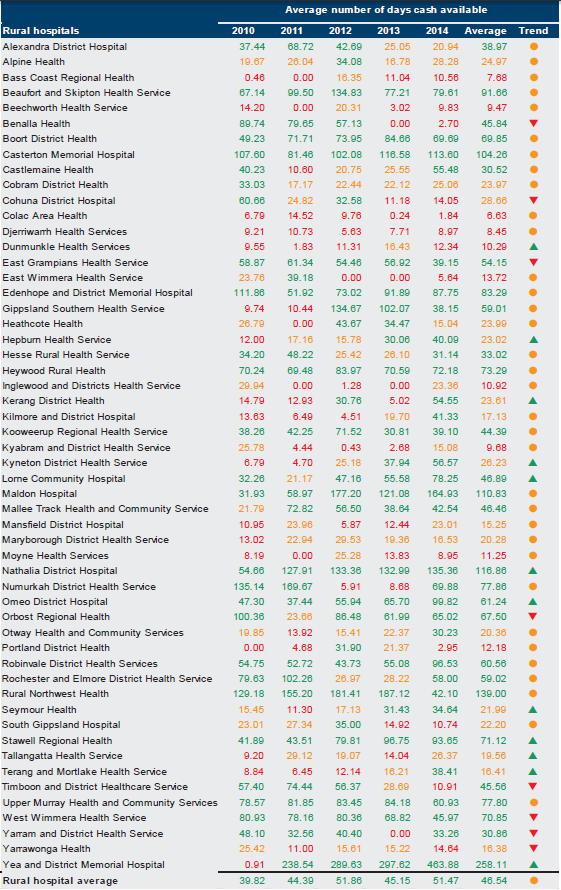
Source: Victorian Auditor-General's Office.
Figure D17
Self-financing, 2010–14
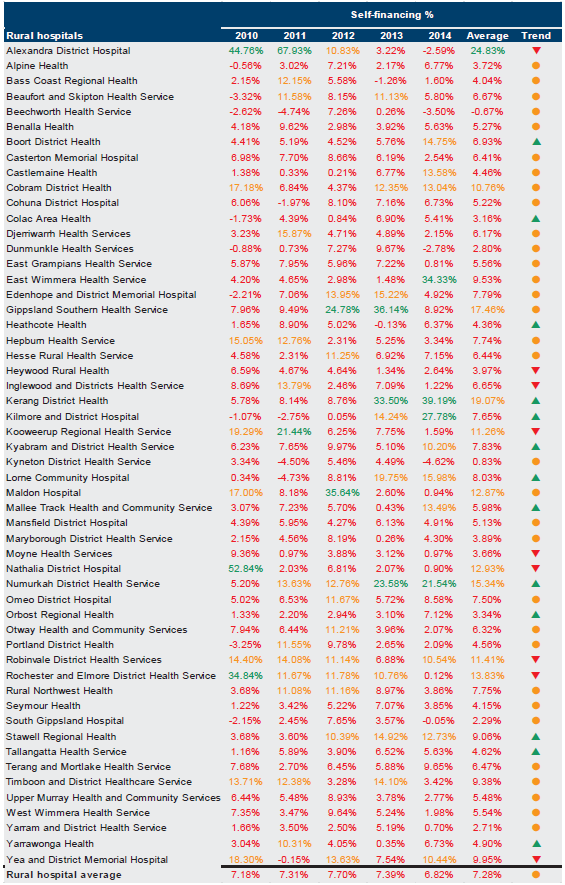
Source: Victorian Auditor-General's Office.
Figure D18
Capital replacement, 2010–14
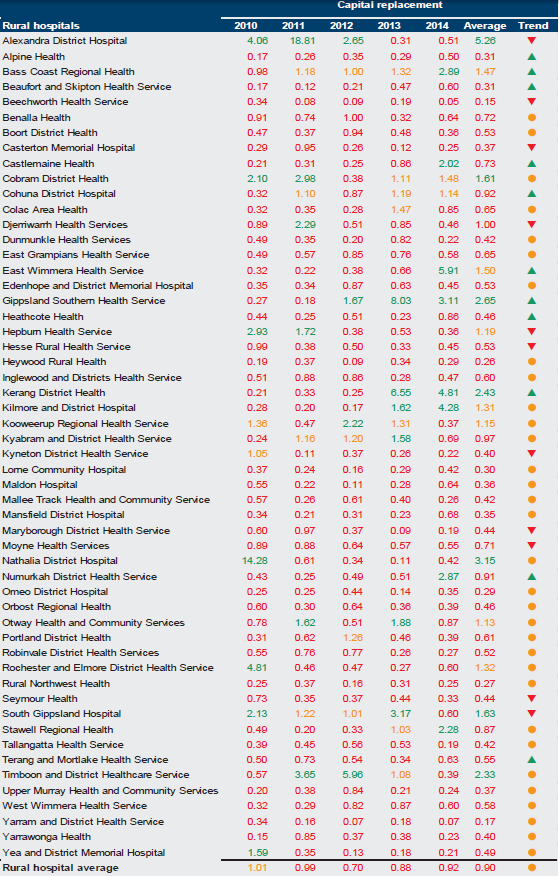
Source:Victorian Auditor-General's Office.
Appendix E. Glossary
Accountability
Responsibility of public sector entities to achieve their objectives, with regard to reliability of financial reporting, effectiveness and efficiency of operations, compliance with applicable laws, and reporting to interested parties.
Activity-based funding
Method of funding allocation based on unit prices for each activity undertaken, and the number of that activity to be performed by an entity.
Acute admitted services
Services in which the intent is to perform surgery, diagnostic or therapeutic procedures in the treatment of illness or injury.
Account reconciliation
An accounting procedure confirming that the balance of one finance system matches an aspect of another financial system. Any variances between the two items require explanation.
Asset useful life
The period over which an asset is expected to provide the entity with economic benefits. Depending on the nature of the asset, the useful life can be expressed in terms of time or output.
Asset valuation
The fair value of a non-current asset on a particular date.
Asset
A resource controlled by an entity as a result of past events, and from which future economic benefits are expected to flow to the entity.
Audit Act 1994
An Act of the State of Victoria that establishes the:
- operating powers and responsibilities of the Auditor-General
- the operation of his office—the Victorian Auditor-General's Office (VAGO)
- nature and scope of audits conducted by VAGO
- relationship of the Auditor-General with the Public Accounts and Estimates Committee as the representative body of Parliament
- Auditor-General's accountability to Parliament for discharge of the position's responsibilities.
Auditor's opinion
Written expression within a specified framework indicating the auditor's overall conclusion on the financial—and performance—reports based on audit evidence obtained.
Block funding
A system of funding public hospital functions and services as a fixed amount based on population and previous funding. Under National Health Reform, block funding will be provided to states and territories to support teaching and research undertaken in public hospitals and for some public hospital services where it is more appropriate, particularly smaller, rural and regional hospitals.
Capital expenditure
Amount capitalised to the balance sheet for contributions by a public sector entity to major assets owned by the entity, including expenditure on:
- capital renewal of existing assets that returns the service potential, or the life of the asset to that which it had originally
- capital expansion that extends an existing asset at the same standard to a new group of users.
Capital grant
Government funding given to an agency for the purpose of acquisition of capital assets such as buildings, land or equipment.
Clear audit opinion
A positive written expression provided when the financial report has been prepared and presents fairly the transactions and balances for the reporting period in accordance with the requirements of the relevant legislation and Australian Accounting Standards.
Also referred to as an unmodified audit opinion.
Clearly trivial item
Matters that are clearly inconsequential, whether taken individually or in aggregate and whether judged by any criteria of size, nature or circumstances. The accumulation of such amounts clearly would not have a material effect on the financial report.
Corporations Act 2001
An Act of the Commonwealth of Australia that sets out the laws dealing with business entities in Australia at federal and interstate levels. It focuses primarily on companies, although it also covers some laws relating to other entities such as partnerships and managed investment schemes.
Contributions from the state
Transactions in which one public sector entity provides goods, services, assets—or extinguishes a liability—or labour to another public sector entity without receiving approximately equal value in return. Grants can either be of a current or capital nature.
Deficit
Total expenditure exceeds total revenue resulting in a loss.
Depreciation
The systematic allocation of a fixed asset's capital value as an expense over its expected useful life to take account of normal usage, obsolescence, or the passage of time.
Emergency department services
Services for people seen in a recognised hospital emergency department.
Entity
A body whether corporate or unincorporated that has a public function to exercise on behalf of the state, or is wholly owned by the state such as departments, statutory authorities, statutory corporations and government business enterprises.
Equity or net assets
Residual interest in the assets of an entity after deduction of its liabilities.
Expense
Outflows or other depletions of economic benefits in the form of incurrence of liabilities or depletion of assets of the entity, other than those relating to contributions by owners, that results in a decrease in equity during the reporting period.
Emphasis of matter
A paragraph included in an audit opinion which draws the readers' attention to a particular aspect of the audited financial report. The inclusion of an emphasis of matter does not mean the audit opinion has been modified.
Financial Management Act 1994
An Act of the State of Victoria that establishes the financial administration and accountability of the public sector, as well as annual reporting to the Parliament by all departments and public sector entities.
Financial report
Structured representation of the financial information, which usually includes accompanying notes, derived from accounting records and intended to communicate an entity's economic resources or obligations at a point in time, or the changes therein for a period in accordance with a financial reporting framework.
Financial reporting direction
A direction issued by the Minister for Finance to achieve consistent application of accounting treatments across the Victorian public sector in compliance with a particular Australian Accounting Standard or Interpretation issued by the Australian Accounting Standards Board. Generally issued when a standard or interpretation provides accounting treatment options.
Financial sustainability
An entity's ability to manage financial resources so it can meet spending commitments, both at present and into the future.
Financial year
The period of 12 months for which a financial report—and performance report—is prepared.
Going concern
An entity that is expected to be able to pay its debts as and when they fall due, and continue in operation without any intention or necessity to liquidate or otherwise wind up its operations.
Governance
The control arrangements in place that are used to govern and monitor an entity's activities in order to achieve its strategic and operational goals.
HSA income
Revenue provided to public hospitals arising from health service agreements. It usually consists of grants from the state and Commonwealth governments.
Internal audit
A function of an entity's governance framework that examines and reports to management on the effectiveness of risk management, control and governance processes.
Independent auditor's report
An expression of the independent auditor's opinion on an entity's financial report.
Internal control
Processes affected by an entity's structure, work and authority flows, people and management information systems, designed to assist the entity accomplish specific goals and objectives. Internal controls are a means by which an entity's resources are directed, monitored and measured. It plays an important role in preventing and detecting error and fraud and protecting the entity's resources.
Investment
The expenditure of funds intended to result in medium- to long-term service and/or financial benefits arising from the development and/or use of infrastructure assets by either the public or private sectors.
Liability
A present obligation of the entity arising from past events, the settlement of which is expected to result in an outflow of resources from the entity.
Master file
A database of records pertaining to one of the main subjects of an information system, such as customers, employees and vendors. Master files contain descriptive data that does not often change, such as name, address and bank account details.
Material error or adjustment
An error that may result in the omission or misstatement of information, which could influence the economic decision of users taken on the basis of the financial statements. Materiality depends on the size and nature of the omission or misstatement judged in the surrounding circumstances.
Modified audit opinion
A qualified or disclaimed audit opinion issued when the auditor cannot be satisfied that the financial report is not free from material misstatement.
National health reform agreement
An agreement entered into by all states, territories and the Commonwealth in August 2011 outlining the funding, governance and performance arrangements for the delivery of public hospital services in Australia.
Net assets or equity
Residual interest in the assets of the entity after deduction of its liabilities.
Net result
Calculated by subtracting an entity's total expenses from its total revenue, to show what the entity has earned or lost in a given period of time.
Non-admitted patient services
Services for patients who require care at a hospital, but who do not require admission. These services are often provided in an outpatient clinic.
Non-HSA income
Revenue generated by public hospitals through their own activities, such as fees and charges applied for particular services.
Public private partnership
A public private partnership (PPP) is a long-term contract between the public and private sectors where government pays the private sector to deliver infrastructure and related services on its behalf, or in support of government's broader service responsibilities. PPPs typically make the private sector parties who build infrastructure responsible for its condition and performance on a whole-of-life basis.
Public sector entity
An body controlled by one or more departments—such as a public hospital, local government or statutory body—or a body controlled by a public sector entity.
Revaluation
Recognising a reassessment of values for non-current assets at a particular point in time.
Revenue
Inflows of funds or other enhancements or savings in outflows of service potential, or future economic benefits in the form of increases in assets or reductions in liabilities of the entity, other than those relating to contributions by owners that result in an increase in equity during the reporting period.
Risk
The chance of a negative impact on the objectives, outputs or outcomes of the entity.
Specific purpose payments
Grant funding provided by the Commonwealth to the state government for a particular area or service.
Surplus
Total revenue exceeds total expenditure resulting in a profit.
Appendix F. Audit Act 1994 section 16—submissions and comments
Introduction
In accordance with section 16A and 16(3) of the Audit Act 1994, a copy of this report, or relevant extracts from the report, was provided to the Department of Health and Human Services and named hospitals with a request for submissions or comments.
The submission and comments provided are not subject to audit nor the evidentiary standards required to reach an audit conclusion. Responsibility for the accuracy, fairness and balance of those comments rests solely with the agency head.
Responses were received as follows:
Department of Health and Human Services
Dental Health Services Victoria
Further audit comment:
Auditor-General's response to the Chief Executive Officer of St Vincent's Hospital
RESPONSE provided by the Secretary, Department of Health and Human Services
RESPONSE provided by the Secretary, Department of Health and Human Services – continued
RESPONSE provided by the Acting CEO/DON Alexandra District Health
RESPONSE provided by the Chief Executive Officer, Dental Health Services Victoria
RESPONSE provided by the Chief Executive Officer, Dental Health Services Victoria – continued
RESPONSE provided by the Executive Director Finance and Logistics, Melbourne Health
RESPONSE provided by the Chief Executive Officer, St Vincent's Hospital
Auditor-General's response to the Chief Executive Officer of St Vincent's Hospital
The Chief Executive Officer has stated that they have invested a percentage of their free cash into short term investments during 2013–14 to improve their investment returns, and at no time had this decision threatened the financial viability of St Vincent's in paying their debts.
However, if the hospital's short-term investments were taken into account in the calculation of the 'average number of days cash available' indicator, the revised calculation would still result in a high financial sustainability risk for this indicator.
Our financial sustainability indicators are based on the published financial statements of the hospital, which exclude these short-term investments from their cash balance, and which have been prepared in accordance with the Australian Accounting Standards. Further, our indicators include ratios that are accepted as valid indicators of financial sustainability risks and should be interpreted as set out in our report.