Results of 2021–22 Audits: Local Government
Data dashboard
View the dashboard full screen
Dashboard data
Click the links below to download CSV copies of the following datasets:
1. Audit outcomes
We gave clear audit opinions for financial reports and performance statements across the local government sector. Parliament and the community can confidently use these reports.
Financial reports and performance statements are reliable
The local government sector
The Victorian local government sector consists of 105 agencies, including 79 councils.
Each council and agency prepares a financial report. Each council also prepares a performance statement.
We audit all of these reports and statements.
See Appendix B for more information about the local government sector, including annual reporting timelines and requirements.
Number of clear audit opinions
To date, we have given 175 clear audit opinions across the sector for 2021–22 (see Figure 1).
Figure 1: Clear audit opinions for 2021–22

Source: VAGO.
This means Parliament and the community can confidently use these reports.
Clear audit opinion
A ‘clear’ or ‘unmodified’ audit opinion means we have reviewed an agency's financial report and performance statement (where applicable) and believe they are reliable and comply with relevant reporting requirements.
Audits in progress
As at 31 January 2023, the following audits for 2021–22 are still in progress:
- one council's financial report and performance statement
- 7 agencies' financial reports.
See Appendix E for more information about these audits.
In this report we have not included these entities in our analysis for 2021–22.
Some councils and agencies did not meet reporting timelines
Councils reporting timelines
Ten of the 79 councils did not finalise their financial report and performance statement by 31 October 2022.
This meant they could not present their annual report at a council meeting open to the public by the legislative date.
A further 9 councils could not present a finalised annual report at a council meeting open to the public during October 2022. This is because their audit opinions were finalised after these meetings.
Regional library corporations reporting timelines
Four of the 10 regional library corporations did not finalise their financial report by 31 October 2022.
This meant they could not give their annual report to the Minister for Local Government by the due date.
Reasons for delays
Annual reporting timelines are challenging to meet in a normal year.
The 2021–22 reporting cycle was more challenging due to the flow-on effects of the COVID-19 pandemic, including:
|
1 |
Scarce resources There was a shortage of finance and accounting professionals across Australia, impacting councils' ability to prepare financial reports and performance statements on time. A shortage of auditors affected the timing and execution of our audits across the sector. |
|
2 |
Higher staff turnover To prepare a financial report or performance statement, finance teams need supporting information and advice from other business units. In 2021–22 all council cohorts experienced higher staff turnover due to greater labour market opportunities. The sector's average staff turnover was 20 per cent in 2021–22. This was up from 14 per cent in 2020–21. The turnover rate in interface, large and small shire councils was slightly higher than the sector average (see Figure 2). Staff turnover affects an entity's ability to prepare financial reports and performance statements because:
|
Figure 2: Average staff turnover by council cohort for 2018–19 to 2021–22
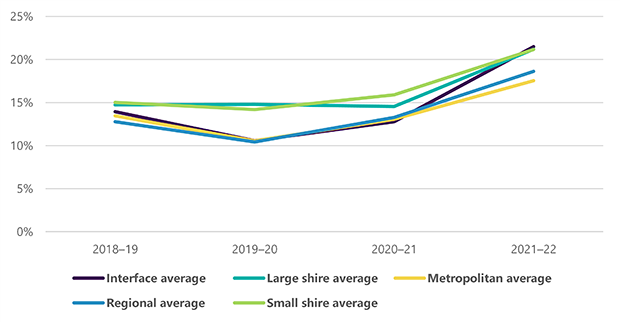
Source: VAGO.
We found more errors in council financial reports
What affects the quality of a financial report
Many factors can affect the quality of a financial report.
To make sure a financial report is high quality, an entity should have an annual reporting plan that outlines:
- its legislative reporting requirements
- a detailed reporting process
- the resources, milestones, key stakeholders, information systems, materiality threshold, oversight and quality assurance practices it needs to help the staff who prepare it.
In 2021–22 a number of factors led to an increase in errors found in financial reports submitted to us for auditing. Of most significance was:
- a disconnect between councils’ finance teams and other teams across the business
- staff changes
- the quality of the local government model report.
Disconnect between finance teams and other internal teams
The finance team should make sure other internal teams and key stakeholders clearly understand their information needs and timelines in the production process of a financial report or performance statement.
At some councils, we saw a disconnect between the finance team and other internal teams. This led to teams not understanding:
- the interdependencies that exist across teams in relation to their respective outputs
- how the finance team uses their information and advice to prepare the council's financial report and performance statement.
As a result, some teams did not always give the finance team timely, complete and accurate information that was based on sound records.
Councils could improve the quality of their financial reports and performance statements by:
- strengthening their internal teams' relationships
- making sure other internal teams understand the finance team's information needs, timelines and outputs.
Staff change
As previously explained, the sector experienced significantly more staff turnover in 2021–22.
This led to:
- finance teams processing more audit adjustments before councils finalised their financial reports
- us reporting more internal control and financial reporting issues to councils' management and audit committee, which we discuss in Section 3.
Staff turnover can affect the quality of a council's financial report because:
- it increases the risk that the council's internal controls may not operate as intended
- new staff may be unfamiliar with the council's legislative reporting obligations, policies and procedures.
A council can reduce these risks by making sure its induction program, mandatory training and refresher training build staff's awareness of its governance arrangements, operations, legislative obligations, policies and procedures.
A council can also use internal audits to make sure its controls are operating as intended.
Quality of the local government model report
Each year Local Government Victoria (LGV) releases a model financial report and performance statement to help councils meet their reporting requirements.
The Local Government (Planning and Reporting) Regulations 2020 require councils to comply with these models.
Over the years, financial reports have become longer and more complex. They also do not always cater to users’ needs. As a result, readers often struggle to find the information they are looking for.
Financial report preparers also find it difficult to decide what information:
- is material, which they must disclose in their financial report
- is not material, which they should not include.
Material
Information is material if misstating or not including it could influence a user’s decision or understanding.
Preparers need to use professional judgement and qualitative and quantitative data to decide if information is material or not.
We continue to find disclosures in financial reports and performance statements that councils’ need to amend prior to their finalisation, or that is not material.
We also found LGV could omit several disclosures in its model financial report because, based on our analysis over the last 5 years, we do not consider the information to be material to the needs of users.
While preparers are responsible for their financial reports and deciding what information is material, LGV could help them by making its model financial report more user-friendly through:
- streamlining its content
- improving the structure and layout of its model performance statement.
See our article on the power of streamlining: Streamlining-public-sector-financial-statements-tips-and-tricks
Errors we found in 2021–22
Councils must fix material errors before we can issue a clear audit opinion.
In 2021–22 we found 149 errors that councils needed to fix. This compares to 130 errors in 2020–21.
In financial reports we continued to find:
- issues with the quality of disclosures that councils needed to amend
- errors with councils’ property, infrastructure, plant and equipment (PIPE) balances.
Figure 3 shows the number of errors we found in the last 2 years by category.
Figure 3: Adjusted errors by category for 2020–21 and 2021–22
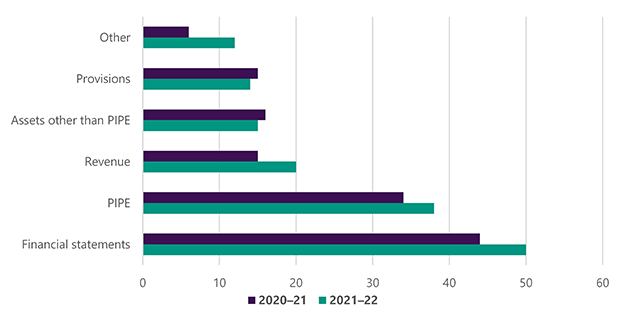
Source: VAGO.
PIPE errors
Figure 4 breaks down PIPE errors by category for the last 2 years.
Section 3 has more information about asset valuation errors.
Figure 4: PIPE errors by type for 2020–21 and 2021–22
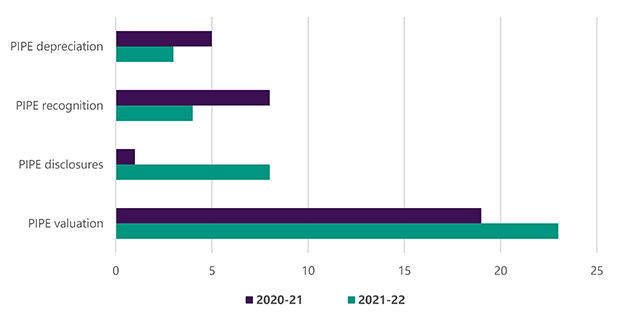
Source: VAGO.
There were less errors in council performance statements
Overall finding
A council’s performance statement has measures to assess:
- how its services are performing
- its sustainability capacity performance
- its financial performance.
In 2021–22 councils made 34 adjustments to council performance statements. This is an improvement compared to 2020–21 when 43 errors were adjusted.
Types of adjustments
It was pleasing to see less calculation errors in 2021–22.
But as Figure 5 shows, councils still need to focus on the quality of their disclosures.
Figure 5: Performance statement adjustments for 2020–21 and 2021–22
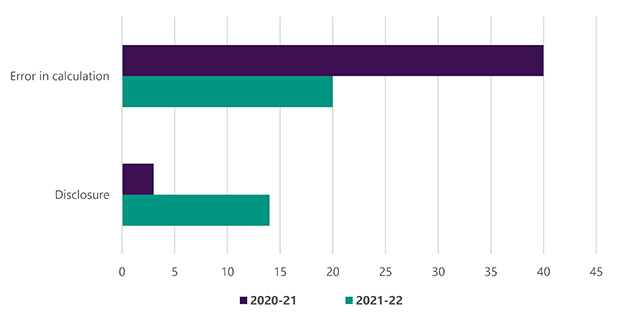
Source: VAGO.
|
A … |
Happens when … |
|---|---|
|
calculation error |
there is an error in:
|
|
disclosure adjustment |
a council's performance statement:
|
Recommendations
All councils
1. We recommend that all councils revisit their annual reporting plan and quality assurance processes for preparing financial reports and performance statements.
2. We recommend that all councils analyse staff departure data to assess if:
- there is an increased risk their internal controls may not be operating as intended across the council as a whole or within a particular business area
- their induction program, mandatory training and refresher sessions are sufficient within the workforce’s current environment
- they need to use their internal audit function in a particular area to make sure key controls are operating as intended.
Local Government Victoria
3. We recommend that Local Government Victoria works with the sector to:
- streamline its local government model financial report
- enhance the structure and layout of its local government model performance statement.
2. Financial analysis
The COVID-19 pandemic continued to affect the sector in 2021–22.
The sector’s financial performance only improved because government funding increased. It would have declined without this financial assistance. The growth in council expenses outpaced the increase in their own source revenue.
Councils’ balance sheets remain relatively strong.
Councils face challenges ahead due to the:
- council rate cap, which constrains their ability to increase rate revenue
- variability in government funding
- rising cost of materials and services, which they need to actively manage.
The sector’s actual capital expenditure for 2021–22 was $3.049 billion. This was 28.9 per cent (or $1.240 billion) less than its budgeted spending. This underspending is consistent with previous years.
Results improved because government funding increased
Net result
Net surplus is councils’ revenue and income from transactions minus their expenses from transactions.
In 2021–22, Victorian councils generated a combined net surplus of $2.243 billion.
This was $0.121 billion, or 5.7 per cent, more than 2020–21. However, the sector's financial performance would have declined had the Australian Government not advanced 75 per cent of the 2022–23 financial assistance grant in 2021–22, up from 50 per cent in 2020–21.
Total revenue increased by 3.4 per cent when you exclude the additional 25 per cent funding received in advance for next financial year.
Total expenses grew by 4.6 per cent, outpacing the increase in own source revenue.
Financial performance snapshot
|
The sector reported … |
Which is a … |
From … |
|---|---|---|
|
$12.501 billion in revenue and income (including the financial assistance grant) |
4.8% increase |
$11.926 billion in 2020–21. |
|
$10.258 billion in expenses |
4.6% increase |
$9.803 billion in 2020–21. |
Revenue and income by category
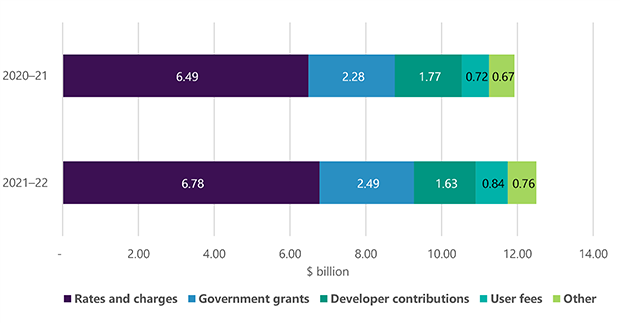
Figure 6 breaks down councils’ revenue and income by category for 2021–22 and 2020–21.
Rates and government grants are still councils’ biggest revenue and income sources.
Figure 6: Breakdown of councils’ revenue and income by category for 2020–21 and 2021–22
Source: VAGO.
Why total revenue and income increased
In particular, councils’:
|
Revenue or income from … |
In 2021–22 … |
Because … |
|---|---|---|
|
rates and charges |
increased by $0.291 billion, or 4%, to $6.779 billion |
|
|
government grants |
increased by $0.214 billion, or 9%, to $2.491 billion |
the Australian Government advanced 75% of its 2022–23 financial assistance grants to councils during 2021–22, compared to 50% in the |
|
developer contributions (monetary and non-monetary) |
decreased by $0.136 billion, or 8%, to $1.631 billion |
the fair value of infrastructure assets constructed by developers and transferred to councils free of charge was $0.153 billion lower due to delays in developers completing new developments. |
|
user fees |
increased by $0.123 billion, or 17%, to $0.842 billion |
council-run facilities were open after the Victorian Government eased COVID-19 restrictions. |
Government grants
Councils get annual funding from the Australian and Victorian governments.
How much they receive and when varies each year depending on the governments’ program initiatives or capital projects.
The Australian Government financial assistance grants are recognised as income when received. Typically, councils get:
- 50 per cent of their current-year grants in the current financial year
- 50 per cent of next year's grants in the current financial year.
The Australian Government advanced 75 per cent of its 2022–23 financial assistance grants to councils in 2021–22.
Unless the Australian Government advances 75 per cent of its 2023–24 grants in 2022–23, councils will get 25 per cent less funding in the coming financial year, which may:
- impact the financial performance and net result of the sector
- cause cash flow challenges for some councils.
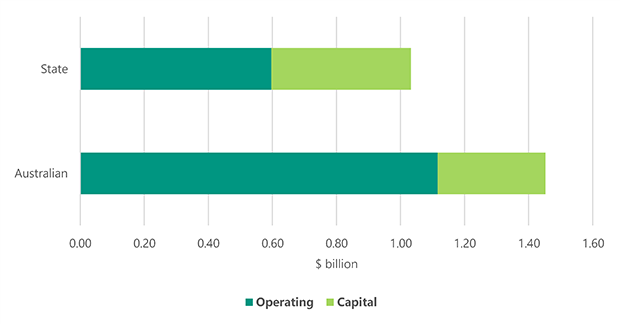
Figure 7 shows the operating and capital grants councils got in 2021–22 from the Australian and Victorian governments.
Figure 7: Government grants by source and type for 2021–22
Source: VAGO
|
Governments give councils … |
To help them fund … |
|---|---|
|
operating grants |
their running costs |
|
capital grants |
the cost of constructing longlasting assets, such as roads. |
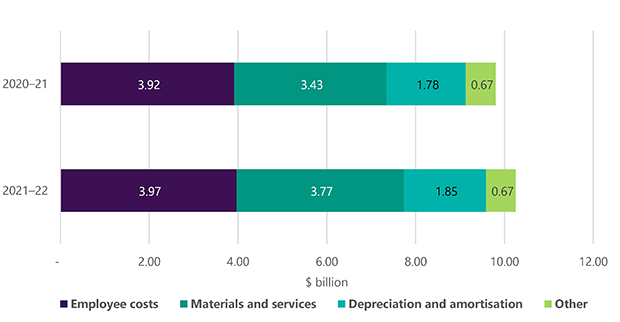
Councils’ expenses by category
As Figure 8 shows, councils continue to spend the most on:
- employee costs
- materials and services.
Figure 8: Breakdown of councils’ expenses by category for 2020–21 and 2021–22
Source: VAGO.
Changes in expenses
In 2021–22 councils’ total expenses grew by 4.6 per cent to $10.258 billion.
This was mainly because the cost of councils’ materials and services increased by 9.8 per cent from 2020–21 due to:
- an increase in contractor costs to fill vacant staff roles
- councils providing more community services after COVID-19 restrictions eased
- inflation pressures.
Councils need to actively manage these costs, especially with rate caps limiting their ability to raise more revenue.
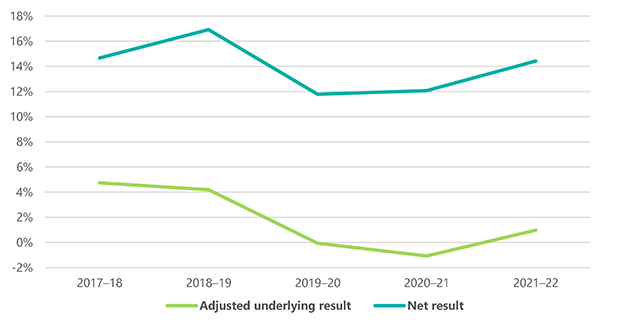
Adjusted underlying result indicator
The adjusted underlying result indicator measures a council’s ability to generate a surplus from its ordinary course of business (excluding capital receipts) to fund its capital spending.
It is important that councils generate enough money to deliver community services. A longer term negative trend in this indicator could force councils to reduce the services they offer their communities.
In 2021–22 the sector’s adjusted underlying result improved to 0.97 per cent compared to negative 1.07 per cent to in 2020–21. However, it is not back to pre-pandemic levels when the adjusted underlying result was greater than 4 per cent (see Figure 9).
Figure 9: Councils’ adjusted underlying results and net results from 2017–18 to 2021–22
Source: VAGO.
Councils’ adjusted underlying result would have been lower in 2021–22 if they did not get 75 per cent of their Australian Government grant funding in advance.
Fluctuations in this funding:
- impact the sector’s underlying net result
- make it difficult for councils to plan ahead and make sure they can continue to deliver community services.
The sector’s financial position remains sound with low debt levels
Financial position snapshot
At 30 June 2022 councils’ net assets totalled $130.085 billion. This is an increase of $11.945 billion, or 10.1 per cent, from 2020–21.
In particular:
|
The sector reported ... |
Which is an increase of …. |
From … |
|---|---|---|
|
$135.239 billion in total assets |
$12.134 billion, or 9.9% |
$123.105 billion at 30 June 2021. |
|
$5.154 billion in total liabilities |
$0.189 billion, or 3.8% |
$4.965 billion at 30 June 2021. |
Increase in net assets
The main reason councils’ net assets increased by $11.945 billion was because the value of their PIPE assets grew by $11.670 billion in 2021–22.
All council cohorts recorded an increase in PIPE value.
|
PIPE value increases were mainly driven by ... |
And were offset by ... |
|---|---|
|
|
Market conditions impacted the value of PIPE assets
At 30 June 2022 the sector’s PIPE were worth $125.725 billion. These assets account for 93 per cent of the sector's total assets.
Councils measure PIPE assets at fair value. This is the amount a council would need to spend to replace an asset with one in a similar condition, in the current market.
Changes in market conditions mean the value of some PIPE assets significantly change. When this happens, councils need to get them revalued.
Councils get land and buildings revalued every one to 3 years. They usually get infrastructure assets revalued every 3 to 5 years.
The rising cost of materials and services over the last 12 to 18 months has increased the cost to replace assets.
As a result, several councils revalued and recorded an increase in the fair value of their infrastructure assets. Councils generally used published industry construction rates to assist in these revaluations.
Cash assets and other financial assets
The sector remained financially liquid in 2021–22.
Councils’ cash and financial assets increased at 30 June 2022 compared to 30 June 2021. This growth is due to:
- councils getting additional government funding, as previously explained
- some councils intentionally delaying or experiencing delays with their capital works programs, leaving surplus funds to be invested.
Figure 10 summarises councils’ cash assets and other financial assets at 30 June 2022 and 30 June 2021.
Figure 10: Summary of councils’ cash assets and other financial assets by year
| Asset category | 30 June 2022 ($ billion) | 30 June 2021 ($ billion) |
|---|---|---|
| Cash assets | 2.236 | 3.160 |
| Other financial assets | 4.922 | 3.735 |
| Total | 7.158 | 6.895 |
Borrowing levels remained stable
In 2021–22 councils could access low-interest-rate loans through the Treasury Corporation of Victoria for:
- key infrastructure projects
- other projects
- general working capital requirements.
The sector estimated $0.768 billion of new borrowings in councils’ budgets for 2021–22.
However, as some councils delayed their capital works programs, new borrowings were lower than expected.
The sector’s borrowing level was $1.08 billion at 30 June 2022, only increasing 1 per cent from $1.07 billion at 30 June 2021.
At 30 June 2022 the sector’s total borrowings represented 0.8 per cent of its total assets, which is down from 0.9 per cent at 30 June 2021.
Liquidity ratio remains positive
The liquidity ratio measures a council's ability to pay its existing short-term liabilities in the next 12 months.
At 30 June 2022 the sector’s average liquidity ratio remained positive at 2.30, which is consistent with the prior year.
This means the sector’s cash and other liquid assets are more than double its short-term liabilities.
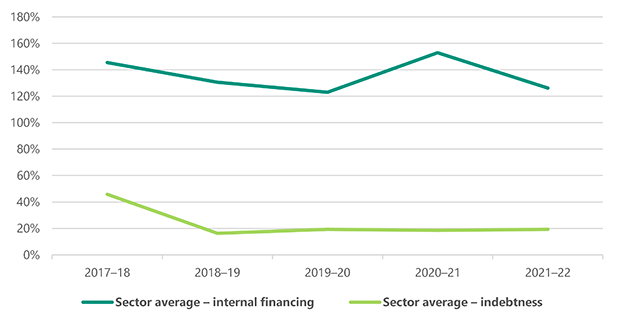
Financing ratios
The internal financing indicator measures a council’s ability to finance capital works from its operating cash flow. The higher the percentage, the greater a council’s ability is to finance capital works from its own funds.
At 30 June 2022 the sector’s internal financing indicator was 126 per cent. This is down from 153 per cent at 30 June 2021. The decline would have been greater had the Australian Government not advanced 75 per cent of the 2022–23 financial assistance grants to councils in 2021–22 compared to 50 per cent in 2020–21.
As Figure 11 shows, this indicator has fluctuated over the last 5 years. It has been as low as 123 per cent to as high as 153 per cent.
The indebtedness indicator assesses if councils can service their debts and meet their repayment obligations using their own-sourced revenue. The lower the percentage, the greater a council’s ability is to repay debt from its own-source revenue.
As Figure 11 shows, the sector’s indebtedness has remained constant at 19 per cent over the last 3 years.
Figure 11: The sector’s internal financing indicator and indebtedness indicator results from 2017–18 to 2021–22
Source: VAGO.
Actual capital expenditure continues to be below budget
Capital expenditure
Each council’s financial report includes a capital works statement. The statement:
- compares the council’s budgeted capital expenditure with its actual capital expenditure
- explains any material variations between its budgeted and actual capital expenditure.
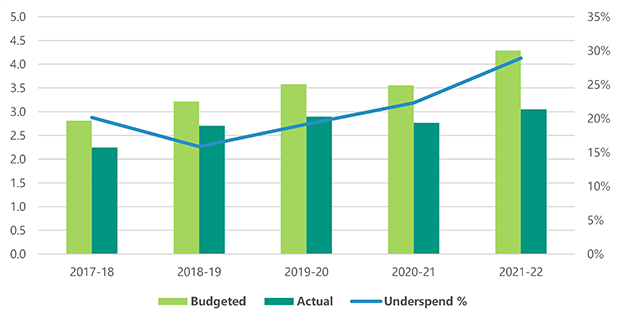
In 2021–22 the sector’s actual capital expenditure was $3.049 billion. This was 28.9 per cent (or $1.240 billion) less than it budgeted partly because of COVID-19 impacts (i.e. government imposed restrictions, supply chain issues, rising costs of materials and a labour shortage) affecting delivery of capital works programs.
Figure 12 compares the sector’s budgeted capital expenditure to its actual capital expenditure for 2017–18 to 2021–22 and reveals a trend of underspend. As shown, this underspend trend existed pre-pandemic and may indicate challenges with effective capital budgeting and ongoing management by the sector. We intend to explore this area further in the future.
Figure 12: Budgeted versus actual capital expenditure ($ billion) and percentage underspend from 2017–18 to 2021–22
Source: VAGO
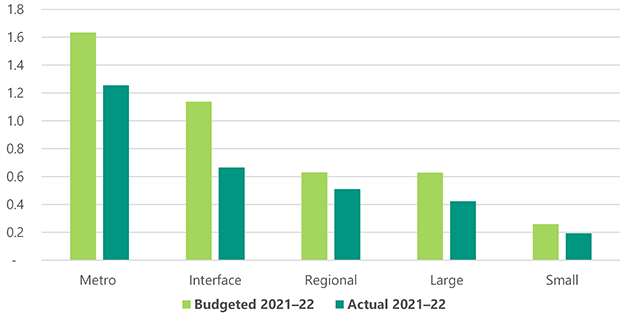
While all cohorts underspent, interface councils, which are in metropolitan growth corridors, had more variation between their actual and planned capital expenditure. Figure 13 shows this.
The interface councils underspend accounted for $0.473 billion, or 38 per cent, of the sector’s total underspend for 2021–22. Seven of the 9 interface councils drove the underspend.
Figure 13: Budgeted versus actual capital expenditure by council cohort for 2021–22 ($ billion)
Source: VAGO.
Councils did not deliver some planned projects
The sector increased its capital spend year-on-year from 2017–18 to 2021–22, except in 2020–21 (see Figure 12). However, the sector spent $3.793 billion less than it budgeted for capital projects over the 5-year period.
The financial data indicates councils:
- failed to deliver all of their planned capital works programs each year
- can improve their budgeting processes for capital projects and how they manage and deliver projects.
We note councils usually:
- approve a capital expenditure budget that is more than the prior year even though there is a trend of underspend and under delivery
- carry undelivered projects forward to the next financial year, which impacts their ability to deliver projects they have planned for that year.
The October 2022 flooding damaged councils’ property and infrastructure assets (particularly road networks). Councils did not know they would need to repair and replace damaged assets. As a result, several councils are unlikely to deliver their approved 2022–23 capital works program.
The volume of work from the flooding may also impact market participants’ capacity to tender for other capital projects councils have planned.
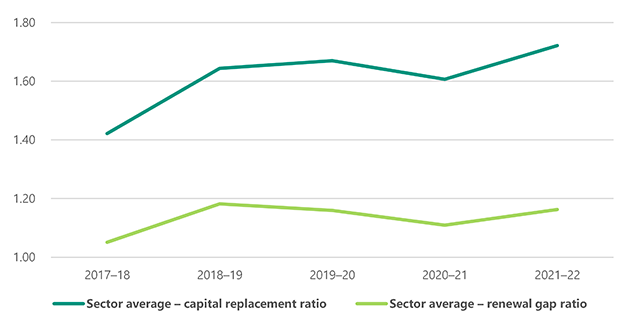
Capital replacement and renewal gap indicators
Capital replacement and renewal gap ratios are longer-term measures that assess the sector’s spending on infrastructure assets compared to depreciation. A result higher than 1 indicates that spending is faster than depreciation rates.
The sector's average capital replacement ratio and renewal gap ratio over the last 5 years remained above 1.
However, this indicator does not consider councils' planned capital expenditure. The underspend that is occurring indicates spending on asset expansion, renewal, upgrade or replacement may not be keeping pace with the needs of the community.
At 30 June 2022 the sector's:
- average capital replacement ratio was 1.72
- average renewal gap ratio was 1.16.
Figure 14: The sector’s capital replacement and renewal gap ratios from 2017–18 to 2021–22
Source: VAGO.
Recommendation
All councils
4. We recommend that all councils:
- undertake a review of their capital expenditure budgeting process in light of past and current underspend to understand why the underspend is occurring
- prior to approving the planned capital spend for the next financial year, consider the impact of:
- carry-forward projects on the proposed capital works program
- current market conditions on project costs and project commencement and completion dates
- understand factors impacting delivery of planned projects and develop strategies to resolve or re-sequence delivery.
3. Internal controls and financial reporting issues
Councils have adequate internal controls for preparing reliable financial reports and performance statements, but there is room for improvement.
Information technology (IT) controls and asset management weaknesses continue to be key areas for improvement across the sector.
Internal control snapshot
Councils must have an effective internal control system to keep proper accounts and records.
We assessed if councils’ internal controls, which include people, systems and processes, allow them to prepare reliable financial reports and performance statements.
We report significant internal control and financial reporting issues to the council's management and its audit committee, which the Australian Auditing Standards requires.
Overall, councils’ internal controls remain adequate for reliable reporting, but there are areas for improvement.
Communicating internal control and financial reporting issues
We alert a council's management and audit committee to any internal control and financial reporting issues we find during an audit. This includes:
- raising new issues
- giving updates on unresolved issues we raised in a prior period.
Councils can strengthen their internal controls and financial reporting processes by promptly responding to the issues we raise.
While councils need to address all weaknesses, they should prioritise higher-risk and unresolved issues.
Increase in new and unresolved internal control and financial reporting issues
New and unresolved issues
As Figure 15 shows:
- new internal control and financial reporting issues increased from 97 in 2020–21 to 125 in 2021–22
- councils’ unresolved issues from previous years increased from 60 in 2020–21 to 78 in 2021–22.
These increases are due to councils having more general IT control weaknesses (see Figure 16).
Of the new and unresolved issues in 2021–22, we rated:
- 5 unresolved and 6 new issues as high risk
- all remaining issues as medium risk.
Figure 15: New and unresolved issues from 2017–18 to 2021–22
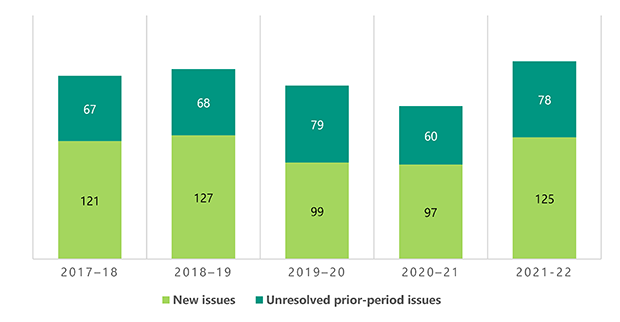
Note: We excluded low-risk issues because we consider these as minor issues or opportunities to improve.
Source: VAGO.
Medium and high-risk findings by category
Figure 16 shows the number of open medium and high-risk issues by category for the last 2 years.
Figure 16: Medium and high-risk issues by category for 2020–21 and 2021–22
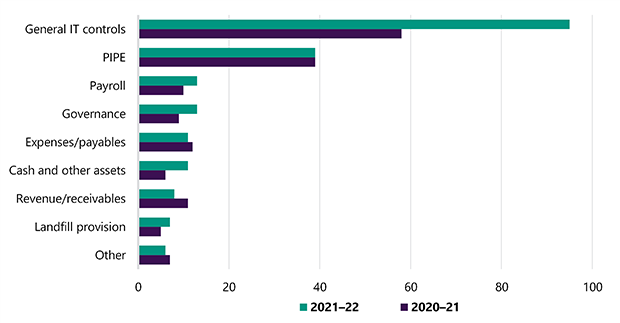
Source: VAGO.
The most significant internal control areas that we continue to see issues in are:
- general IT controls
- asset management, particularly asset valuation.
IT control weaknesses
Importance of IT controls
Effective IT controls reduce the risk of unauthorised people accessing and changing councils’ systems. They also help protect the integrity of councils’ data and support the preparation of reliable financial reports.
Adopting remote and flexible work arrangements has increased the importance of effective IT controls.
Significant rise in IT control weaknesses
Poor IT controls increase the risk of unauthorised access, cyber-attacks, fraud, error, data manipulation and information theft. It is important that management resolve them promptly to ensure systems are secure and financial information is reliable.
We tailor our audits to match the risks that councils face. In 2021–22, we increased our use of system assurance auditors. As a result of this shift in audit approach, we found more IT control weaknesses.
Figure 17 shows, weaknesses in access management, policies and procedures, audit logging and monitoring, and intrusion detection significantly increased in 2021–22.
Figure 17: IT control weaknesses by type for 2020–21 and 2021–22
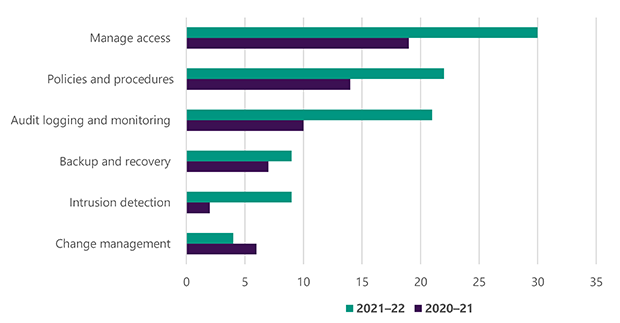
Source: VAGO
We rated all of these issues as medium risk.
A council’s risk of experiencing a major disruption, such as a cyber-attack, increases if it does not fix IT control issues in a timely way.
User-access management and authentication controls reduce the likelihood of unauthorised access to an entity's systems and underlying data.
Audit logging and monitoring controls detect unauthorised access and changes after they occur. Audit logs also ensure that all important changes are captured as part of an entity's change management controls.
Intrusion detection is an application that monitors network traffic and searches for known threats and suspicious or malicious activity.
Essential Eight security framework
No IT security strategies are guaranteed to protect against all cyber threats. But the Australian Cyber Security Centre recommends organisations implement 8 essential mitigation strategies as a baseline.
This baseline, which is known as the Essential Eight, makes it much harder for people to compromise systems.
Complying with the Essential Eight security framework would help councils protect customer and sensitive data better.
The mitigation strategies that make up the Essential Eight are:
- application control
- patch applications
- configure Microsoft Office macro settings
- user application hardening
- restrict administrative privileges
- patch operating systems
- multi-factor authentication
- regular backups.
Asset management and valuation processes
Asset valuation
Councils must have robust asset management and valuation processes to meet their communities’ needs. But these processes continue to be an area that councils need to improve.
Councils construct, maintain and renew significant physical infrastructure for their municipalities.
Councils record their PIPE assets at fair value.
Determining an asset’s fair value can be complex and is subject to judgement. Numerous assumptions about the assets are made, valuation experts can be engaged and/or industry indices drawn upon.
Asset valuation issues we commonly find include councils:
- not conducting regular fair value assessments for all of their asset classes and documenting their assessments
- not accurately applying condition information to assets
- incorrectly calculating the revaluation increment or decrement stemming from the revaluation
- incorrectly accounting for the movement in value in line with Australian Accounting Standards.
A council’s finance team and asset management and/or engineering team must work together to consider fair value issues early in a reporting cycle.
Asset recognition and record keeping
We also commonly see councils:
- not capitalising new assets in a timely way, understating depreciation expenses
- not recognising developer-contributed assets in a timely way, understating income and assets
- not updating their fixed asset registers regularly, leading to inaccurate and/or invalid financial asset information.
PIPE issues by type
Figure 18 shows the number of medium and high-risk PIPE findings by category that we reported to councils in 2021–22 and 2020–21.
We reported a further 49 low-risk issues to councils in 2021–22 about asset management and valuation.
Figure 18: PIPE internal control and financial reporting on medium and high-risk issues by category for 2020–21 and 2021–22
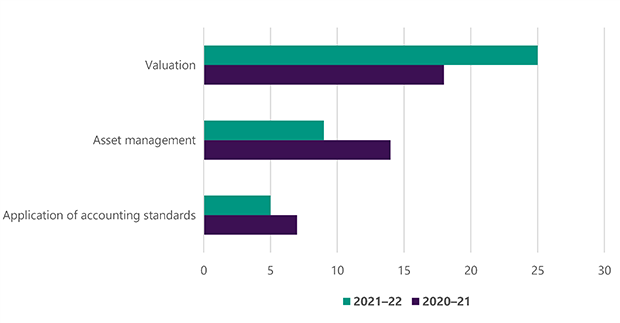
Source: VAGO.
Focusing on asset valuations and strengthening their asset management processes will help councils have more robust and accurate data on their infrastructure network for financial and performance reporting.
Councils can also use this data to develop mature asset management plans and improve their capital expenditure budget estimates.
Recommendations
All councils
5. We recommend that all councils:
- prioritise and resolve prior-period issues
- understand the risk that information technology control weaknesses pose and implement agreed management actions.
6. We recommend that finance teams:
- focus on strengthening their relationship with asset management and/or engineering teams to reduce the likelihood of asset recognition and valuation issues arising
- prepare and present a paper to their audit committee prior to 30 June that outlines the:
- requirements of the council's accounting policy with respect to property, infrastructure assets, plant and equipment
- approach to assessing the fair value of property, infrastructure, plant and equipment, engagement of an expert valuer where applicable, and key milestones
- likely outcomes for respective reporting cycle (i.e. expected movements in fair value and resultant impact to the financial report).
Appendix A. Submissions and comments
Click the link below to download a PDF copy of Appendix A: Submissions and comments.

Appendix B. Sector context
Click the link below to download a PDF copy of Appendix B: Sector context.
Appendix C. Audit context
Click the link below to download a PDF copy of Appendix C: Audit context.
Appendix D. Abbreviations, acronyms and glossary
Click the link below to download a PDF copy of Appendix D: Abbreviations, acronyms and glossary.
Appendix E. Audit opinions
Click the link below to download a PDF copy of Appendix E: Audit opinions.
Appendix F. Control issues risk ratings
Click the link below to download a PDF copy of Appendix F: Control issues risk ratings.
Appendix G: Financial sustainability indicators
Click the link below to download a PDF copy of Appendix G: Financial sustainability indicators.