Results of 2021 Audits: Technical and Further Education Institutes
Data dashboard
Data dashboard
Click here to view the dashboard full screen
Dashboard data
Click the links below to download CSV copies of the following datasets:
Video presentation
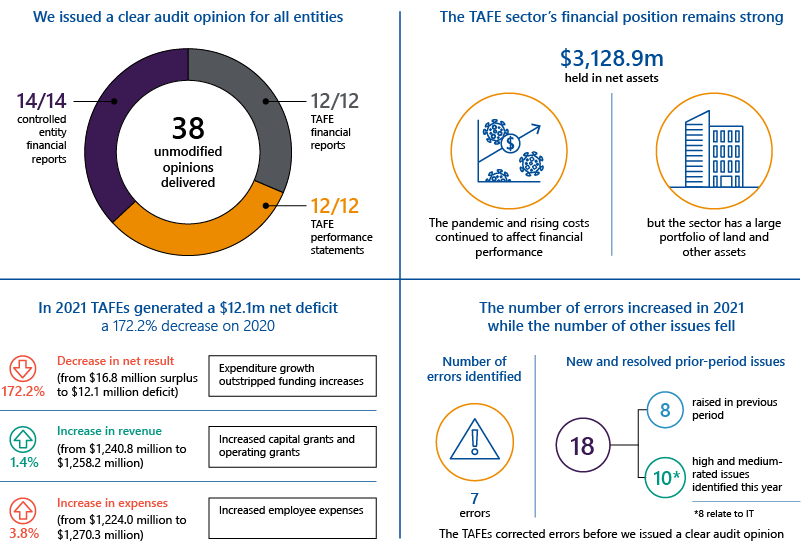
Key facts
Source: VAGO.
1. Audit outcomes
We provided clear audit opinions for all financial reports and performance statements across the technical and further education sector. Parliament and the community can use these reports with confidence.
Financial reports and performance statements are reliable
Number of clear audit opinions
A ‘clear’ or ‘unmodified’ audit opinion means that we have reviewed an entity’s financial report and performance statement and believe they are reliable, accurate and comply with relevant reporting requirements.
We provided clear audit opinions on the financial reports and performance statements of all 12 Technical and Further Education institutes (TAFEs), and on the financial reports of their 14 controlled entities (listed in Appendix E).
Controlled entity
An entity over which another party has the power to govern decision making in relation to financial and operating policies.
FIGURE 1A: Audit opinions delivered for the 2021 period
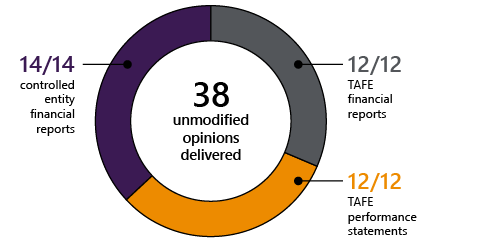
Source: VAGO
Victoria's TAFE institutes
Bendigo Kangan Institute, Box Hill Institute, Chisholm Institute, Gordon Institute of TAFE, Goulburn Ovens Institute of TAFE, Holmesglen Institute, Melbourne Polytechnic, South West Institute of TAFE, Sunraysia Institute of TAFE, TAFE Gippsland, William Angliss Institute of TAFE, and Wodonga Institute of TAFE. Refer to Appendix B: Sector context for a geographical representation of the sector.
Reporting timeliness
Under the Financial Management Act 1994, TAFEs need to provide certified financial reports to VAGO within 8 weeks of balance date. The Audit Act 1994 requires us to provide the entity with an audit opinion within 4 weeks of receiving their certified financial reports.
In 2021, all 12 TAFEs met the statutory timeframe, compared to 11 in 2020. The TAFEs took a median 11 weeks to certify their financial reports, compared to 10.8 weeks in 2020.
Errors in financial reporting
The nature, number and size of errors in financial reports submitted for auditing are direct measures of their quality. Entities must correct material errors before we can issue a clear audit opinion.
This year we found more errors during our audits. We found:
- 7 financial errors compared to 5 in 2020
- 20 classification and disclosure differences, down from 23 in 2020.
|
Of the errors in the draft financial reports, the following were the most significant … |
The TAFE … |
|---|---|
|
one related to Holmesglen Institute's accounting for the revaluation of its land and resulted in a $15.9m increase in value |
adjusted the error and we issued a clear opinion |
|
Chisholm Institute was responsible for one financial error and 9 classification and disclosure differences |
adjusted all errors and differences and we issued a clear opinion. |
Errors in performance statements
We did not identify any significant quality issues through our audits of performance statements for the sector, indicating performance reporting is mature across the sector.
2. Financial analysis
The disruption of the pandemic along with rising costs continued to affect the financial performance of the sector, resulting in an overall net deficit result. Underlying growth in employee costs, an issue that existed before the pandemic, also continues to impact the sector.
TAFEs must focus on managing these costs and increasing alternative sources of revenue to ensure their long-term financial sustainability.
The sector’s net result declined because expenditure growth outstripped increased revenue/income
Financial performance snapshot
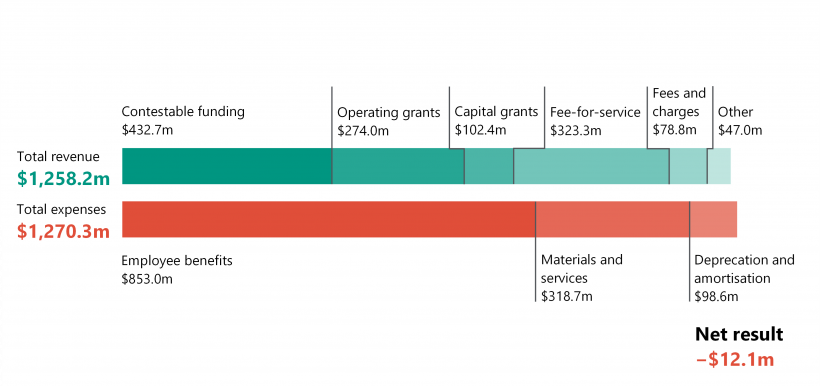
TAFEs collectively recorded a net deficit of $12.1 million in 2021, compared to a net surplus of $16.8 million in 2020.
|
The sector reported … |
Representing … |
From … |
|---|---|---|
|
$1,258.2m in revenue/income |
a 1.4 per cent increase |
$1,240.8m in 2020 |
|
$1,270.3m in expenses |
a 3.8 per cent increase |
$1,224.0m in 2020. |
Net result
Figure 2A shows the net result for 2021, with a breakdown of the revenue and expense streams.
For a comparison with 2020, please see Appendix B: Sector context.
FIGURE 2A: Financial performance snapshot for 2021
Source: VAGO.
TAFEs received more government funding in 2021
Changes in revenue
As shown above in Figure 2A, total revenue for the sector increased in 2021 because TAFEs received more government funding.
|
In 2021, TAFE’s income/revenue from ... |
Totalled ... |
Due ... |
|---|---|---|
|
government contributions |
$809.1m, an increase of $29.9m on 2020 |
to reduced contestable funding |
|
to increased operating grants |
||
|
to increased capital grants |
||
|
fee-for-service and fees and charges |
$402.0m, a decrease of $11.1m on 2020 |
mostly to the impact of COVID-19 border closures, which reduced international fee-for-service revenue. |
|
other sources |
$47.0m, a decrease of $1.5m on 2020. |
Government contributions
In 2021, the government increased capital grants to TAFEs by $47.2 million to help fund their capital works program.
Operating grants to TAFEs also increased by $18.2 million, partly because of increased funding to:
- help TAFEs with their transition to online and remote learning
- provide support to retain staff
- maintain government funding for student placements at pre-pandemic levels.
Government subsidies, also known as contestable funding, decreased by $35.5 million due to reductions in business continuity grants.
COVID-19 led to decreases in student contact hours and reductions in training delivery. In 2020, the TAFEs used business continuity grants specifically to fund the resulting shortfalls in minimum training activity. The government again provided business continuity grants in 2021, but at lower amounts. In 2021, other State Government operating grants helped offset the reduction in business continuity grants.
Fee-for-service revenue
The sector generated $323.3 million in fee-for-service revenue in 2021, a $9.3 million decrease from $332.6 million in 2020.
COVID-19 continues to impede the delivery of fee-for-service courses. Border closures in place for most of 2021 reduced fee-for-service revenue from international onshore students by $22.5 million.
TAFEs increased fee-for-service revenue from other sources by $13.1 million in 2021. Figure 2B shows the continued declining trend of fee-for-service revenue since 2019.
FIGURE 2B: Contestable funding and fee-for-service revenue
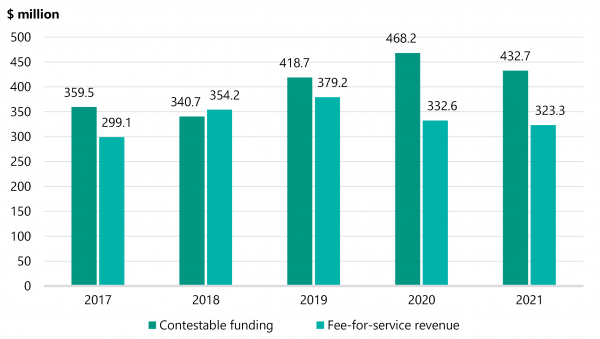
Source: VAGO.
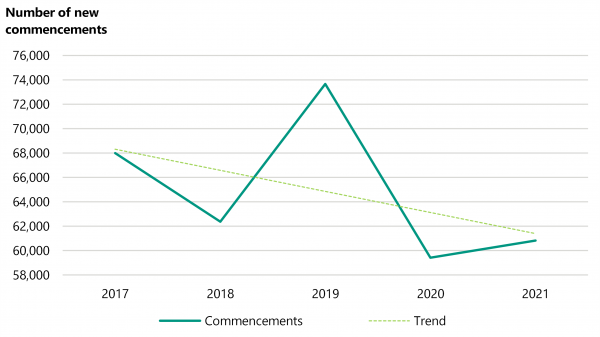
Government-funded commencements
Figure 2C shows the number of government-funded student commencements in Victorian TAFEs.
The decline in 2018 (and then sharp increase in 2019) occurred due to students deferring enrolment so they could access the Free TAFE program, which started in 2019.
Government-funded commencements rapidly declined in 2020 due to the restrictions imposed on TAFEs for in-person course delivery because of the COVID-19 pandemic. In 2021, commencements remain lower than pre-pandemic levels.
FIGURE 2C: Number of government-funded commencements for the years ended 31 December 2017 to 2021
Source: VAGO.
The sector’s expenses increased, driven mostly by employee costs
Changes in expenses
TAFEs incurred $1,270.3 million of expenses in 2021, compared to $1,224.0 million in 2020. Sector expenses have increased in each of the past 5 years except for 2020, where TAFEs constrained their discretionary spending in response to the impacts of COVID-19.
Employee costs continue to be the sector’s most significant expense given the nature of services they provide. These increased by 5.6 per cent compared to 2020 and have risen significantly each year since 2017.
The Victorian Government continues to support TAFEs to retain staff numbers at pre-pandemic levels.
|
Spending on … |
Totalled ... |
Due to ... |
|---|---|---|
|
employee expenses |
$853.0m, an increase of $45.2m from $807.8m in 2020 |
salary increases under teaching enterprise bargaining agreements and a minor increase in overall staff employed in the sector |
|
materials and services |
$318.7m, a reduction of $1.1m from $317.6m in 2020 |
TAFEs maintaining cost-saving measures introduced in 2020, relating to discretionary spending. |
|
depreciation and amortisation |
$98.6m, consistent with 2020. |
|
Most TAFEs did not meet their efficiency and effectiveness targets
Key performance indicators
The TAFEs’ performance statements include key performance indicators (KPIs), with their targets set yearly by TAFE boards.
Two of the KPIs measure a TAFE’s efficiency and effectiveness:
- employment costs as a percentage of training revenue
- training revenue per full-time equivalent (FTE) training member.
Training revenue vs. employee expenses
The combination of higher employment costs and higher teaching FTEs relative to training revenue resulted in less efficient and effective operations—and more expensive training delivery.
As shown in Figure 2D, most TAFEs did not meet their efficiency and effectiveness targets. While training revenue declined in 2021 despite continued government support, employee expenses increased because:
- TAFEs maintained staff numbers at pre-pandemic levels in accordance with government requirements
- there were some incremental pay increases.
On average, employee expenses have increased by 6.9 per cent each year since 2017. Operating and contestable funding has increased by an average 4.1 per cent each year since 2017.
To remain financially sustainable, TAFEs need to manage costs and increase their fee-for-service revenue, or seek ways to generate other revenue.
FIGURE 2D: 2021 efficiency and effectiveness indicator results by TAFE
| Employment costs as a proportion of training revenue | Training revenue per teaching FTE | |||
| Target | Actual | Target | Actual | |
| Bendigo Kangan Institute | 108.4% | 105.3% | $273,097 | $266,399 |
| Box Hill Institute | 91.0% | 98.2% | $233,000 | $213,600 |
| Chisholm Institute | 84.2% | 84.8% | $211,902 | $211,414 |
| Gordon Institute of TAFE | 112.0% | 109.5% | $165,832 | $176,912 |
| Goulburn Ovens Institute of TAFE | 108.8% | 146.2% | $200,803 | $137,703 |
| Holmesglen Institute | <80% | 98.1% | >$195,000 | $195,933 |
| Melbourne Polytechnic | 113.5% | 104.8% | $177,000 | $199,000 |
| South West Institute of TAFE | 129.4% | 137.6% | $167,436 | $175,608 |
| Sunraysia Institute of TAFE | 135.3% | 147.8% | $156,957 | $136,710 |
| TAFE Gippsland | 100.0% | 129.0% | $202,165 | $159,605 |
| William Angliss Institute of TAFE | <102% | 112.6% | >$218,000 | $182,272 |
| Wodonga Institute of TAFE | 99.8% | 102.2% | $203,159 | $167,459 |
Source: VAGO.
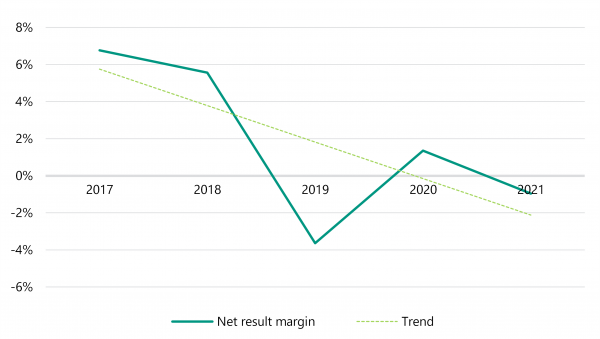
Net result margin
The net result is revenue/income minus expenses. A positive net result margin is a surplus, and the larger the percentage, the stronger the result. A negative result is a deficit. As shown in Figure 2E, the sector’s net result margin decreased in 2021 to −0.96 per cent compared to 1.35 per cent in 2020.
Seven TAFEs incurred a deficit in 2021. In particular, Bendigo Kangan Institute’s net result declined by $42.0 million compared to 2020, mostly because government contributions decreased by $11.9 million and employee expenses increased by $15.4 million.
FIGURE 2E: Sector net result margin
Source: VAGO.
The sector’s financial position remained sound despite the uncertain environment caused by the pandemic
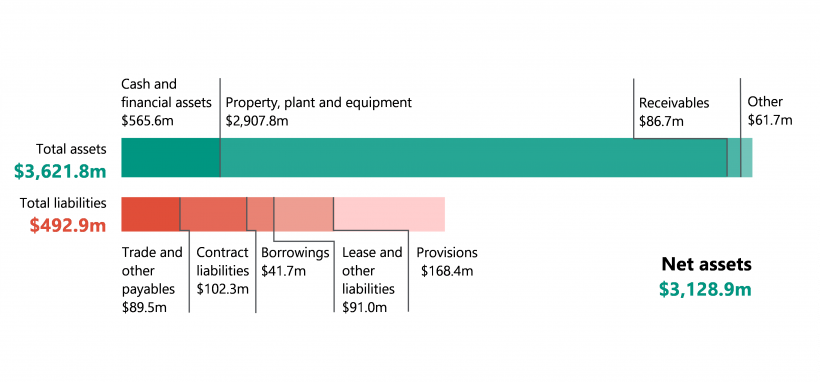
Financial position snapshot
The TAFE sector’s net assets increased to $3,128.9 million in 2021, compared to $2,948.5 million in 2020.
|
The sector reported … |
Representing... |
From ... |
|---|---|---|
|
$3,621.8m in assets |
a 6.4 per cent increase |
$3,402.6m in 2020 |
|
$492.9m in liabilities |
a 8.6 per cent increase |
$454.0m in 2020. |
FIGURE 2F: Financial position snapshot as of 31 December 2021
Source: VAGO.
Increased asset values
The value of the TAFEs’ total assets increased because the value of their land, buildings and equipment grew by $283.9 million in 2021.
|
Increases were mainly driven by … |
While the increases were offset by … |
|---|---|
|
|
Overall liquidity ratio
The sector’s overall financial position is strong, reflected by its large portfolio of land, buildings and equipment assets which TAFEs use to deliver their services. However, because these assets are not liquid, TAFEs cannot rely on them to meet short-term debts.
The liquidity ratio is a better indication of whether TAFEs are likely to be able to service their debt obligations in the immediate future.
While the sector’s average liquidity ratio decreased for 2021, the ratio remains positive at 1.90. This shows that the sector holds almost twice the cash and liquid assets compared to its short-term liabilities, meaning there was no immediate concern at balance date about the sector meeting short-term debt obligations. This is partly because of the continued financial support the government provided to TAFEs during 2021.
Going concern
Financial reports are prepared on a going-concern basis. This means that an entity is expected to be able to pay its debts when they fall due and continue to operate without any intention or need to liquidate or otherwise cease its operations.
To mitigate the risk of a TAFE being unable to pay its debts when they fall due, the Department of Education and Training (DET) may issue it with a letter of comfort. This provides an undertaking that DET will supply adequate cashflow for a set period, should the need arise.
The government’s 2022 budget allocations were approved on the basis that TAFEs should be able to achieve balanced budgets. However, below-forecast student enrolments in early 2022 impacted the sector. This prompted the government to make more funding available and issue:
- 3 letters of comfort for adequate cashflow support, should the need arise (compared to 8 letters in 2020)
- one conditional letter of comfort to TAFE Gippsland relating to a loan liability.
Funding model
The Heads of Agreement for Skills Reform signed in August 2020 was a step towards negotiating a new national skills agreement. A key priority of the new skills agreement was a proposed new funding model intended to:
- more accurately reflect the cost of training delivery
- provide more consistent student pricing
- support growth in enrolments.
A new funding model for the Victorian TAFE sector is being implemented and will position the sector to support Victoria's economic and social recovery from COVID-19 as well as improve the sector's financial sustainability.
The 2022–23 Budget announcement of $83.1 million (in addition to $108.0 million announced in December 2021) will support TAFEs through a range of activities.
3. Internal controls
TAFEs’ internal controls are adequate to prepare reliable financial reports and performance statements, but their information technology controls require improvement.
Snapshot
The Financial Management Act 1994 requires TAFEs to develop effective internal control systems to maintain proper accounts and records. We assess if these internal controls, which include people, systems, and processes, are adequate for preparing reliable financial reports and performance statements.
We report significant internal control issues to an entity’s management and its audit committee, as required under the Australian Auditing Standards.
Overall, TAFEs’ internal controls remain adequate for reliable reporting, but there are areas for improvement.
Raising internal control issues
When we alert TAFE's management and audit committees to internal control issues, this includes:
- raising new issues
- giving updates on issues we raised in a prior period that remain unresolved.
Fewer internal control issues in 2021
Trends in control issues
As shown in figure 3A, the number of new issues has decreased since 2019. The number of prior period unresolved issues has fluctuated over the course of the last 5 years however, has decreased since 2020.
FIGURE 3A: Number of internal control issues (new and unresolved from prior period)
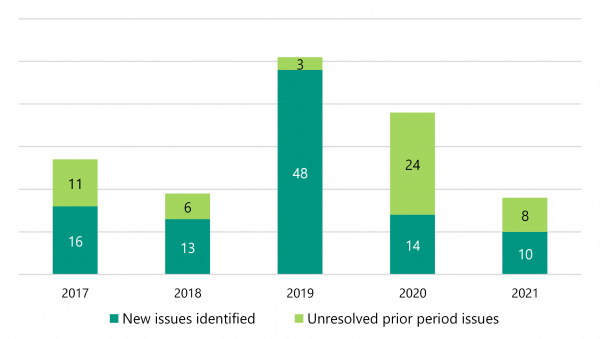
Note: We have excluded low-risk issues as these are considered minor issues or opportunities to improve.
Source: VAGO.
Issues found in 2021
As with last year, we found common IT issues across the sector, including these high and moderate risk items:
|
In 2021 we identified … |
Which we … |
Recommending that … |
|---|---|---|
|
2 new issues related to business continuity and disaster recovery (IT controls) |
rated as high risk |
management take corrective action within one month |
|
one new issue related to Essential Eight compliance (IT controls) |
||
|
7 other new issues, 5 of which relate to IT controls |
rated as moderate risk |
management take corrective action within 3 to 6 months. |
|
8 unresolved prior-period issues, 6 of which related to IT controls |
TAFEs can strengthen their internal control environments and financial reporting by promptly resolving these issues.
IT controls remain a key area of weakness in the sector
Increased reliance on IT controls
The pandemic has made TAFEs even more reliant on IT controls to ensure the security of their systems. This is largely because some manual processing cannot be done remotely.
This reliance has also grown with the move to remote course delivery, a trend we expect will continue as TAFEs revisit their delivery models to increase market reach.
Effective IT controls are important because they reduce the risk of unauthorised access and changes to systems, including cyber-attacks. They are a prerequisite for the smooth day to day operations of entities and reliable financial reporting.
Increase in IT control weaknesses
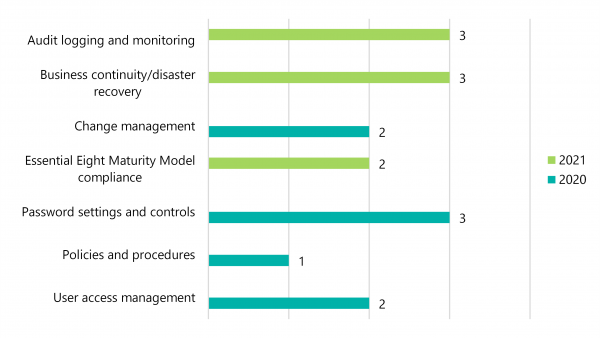
In 2021, we found 3 new types of IT control weaknesses related to:
- audit logging and monitoring
- business continuity and disaster recovery
- compliance with the Essential Eight Maturity Model.
Figure 3B summarises the number of IT control weaknesses by type across the last 2 reporting periods.
FIGURE 3B: Number of IT control weaknesses by type
Source: VAGO.
Logging/monitoring weaknesses
Audit logs and monitoring controls record who is accessing and making changes in IT systems. Coupled with effective user-access management and authentication controls, they reduce the risk of fraud, errors and data loss.
We found that 3 TAFES are not reviewing user activities for some IT applications. This increases the risk of unauthorised access, data manipulation and information theft going undetected.
Planning weaknesses
Effective business continuity planning—or disaster recovery planning—helps an entity respond quickly to a crisis and minimise disruption to their operations.
We found that 3 TAFEs need to enhance their testing of business continuity and disaster recovery plans so they can respond or adapt to unexpected disruptive events and minimise negative impacts.
Cyber security weaknesses
To minimise the risk of cyber threats, organisations are encouraged to comply with the Essential Eight mitigation strategies.
We found that 2 TAFEs are yet to achieve Maturity Level Two in the Essential Eight Maturity Model, meaning they are only partly aligned with cyber threat mitigation strategies. This makes them more vulnerable to cyber-attacks, which have the potential to compromise key systems and data.
TAFEs should work towards achieving a level of maturity that aligns with Essential Eight mitigation strategies.
The Essential Eight Maturity Model
This model supports the implementation of 8 key strategies to minimise the risk of cyber threats, known as the Essential Eight. The model has 3 levels of maturity, from the ability to recover data/system availability to preventing attacks.
Recommendation
To all TAFEs
| We recommend that: | |
|---|---|
| All TAFEs | prioritise and respond more promptly to address the internal control issues we raise with them and that their audit committees monitor the timely resolution of these issues. |
Appendix A. Submissions and comments
Click the link below to download a PDF copy of Appendix A. Submissions and comments.

Appendix B. Sector context
Click the link below to download a PDF copy of Appendix B. Sector context.
Appendix C. Our audit approach
Click the link below to download a PDF copy of Appendix C. Our audit approach.
Appendix D. Acronyms and abbreviations
Click the link below to download a PDF copy of Appendix D. Acronyms and abbreviations.
Click here to download Appendix D. Acronyms and abbreviations
Appendix E. Audit opinions
Click the link below to download a PDF copy of Appendix E. Audit opinions.
Appendix F. Control issues risk ratings
Click the link below to download a PDF copy of Appendix F. Control issues risk ratings.
Click here to download Appendix F. Control issues risk ratings
Appendix G. Financial sustainability indicators
Click the link below to download a PDF copy of Appendix G. Financial sustainability indicators.
Click here to download Appendix G. Financial sustainability indicators