V/Line Passenger Services
Overview
V/Line offers an important service to regional communities—it provides access to services, education and employment across the state. V/Line operates and maintains a fleet of 372 passenger trains and carriages, and 3 520 kilometres of rail track used by passenger and freight services. More than 1 250 V/Line-branded coach services also operate every week, connecting the rail network with regional communities not serviced by trains.
In 2015–16, V/Line carried 17.7 million passengers—16.3 million on trains and 1.4 million on coaches—an increase of 88.3 per cent since 2006–07 and well beyond V/Line’s expectations. In this audit, we assessed whether V/Line regional passenger services are efficient and meet the needs of public transport users, and whether it is adequately prepared to sustain and improve performance in the future.
We focused on V/Line’s performance and how it is managing current and future challenges. We also examined Public Transport Victoria’s (PTV) and the Department of Economic Development, Jobs, Transport and Resources’ (DEDJTR) roles in overseeing and monitoring V/Line’s operational performance and the Department of Treasury and Finance’s role in monitoring V/Line’s financial performance.
We made four recommendations to V/Line and two each to PTV and DEDJTR.
Message
Ordered to be printed
VICTORIAN GOVERNMENT PRINTER August 2017
PP No 259, Session 2014–17
President
Legislative Council
Parliament House
Melbourne
Speaker
Legislative Assembly
Parliament House
Melbourne
Dear Presiding Officers
Under the provisions of section 16AB of the Audit Act 1994, I transmit my report V/Line Passenger Services.
Yours faithfully

Dave Barry
Deputy Auditor-General
9 August 2017
Acronyms
| ACCRI | Asset Management Accountability Framework |
| AMAF | Asset Condition and Criticality Risk Index |
| CEO | Chief executive officer |
| CSM | Customer satisfaction monitor |
| DEDJTR | Department of Economic Development, Jobs, Transport and Resources |
| DPC | Department of Premier and Cabinet |
| DTF | Department of Treasury and Finance |
| EAMS | Enterprise Asset Management System |
| KPI | Key performance indicator |
| NDP | Network development partnership |
| PTV | Public Transport Victoria |
| RRL | Regional Rail Link |
| RSMP | Rolling stock management plan |
| SOP | Strategic operations plan |
| SUP | System upkeep plan |
| TFV | Transport For Victoria |
| TPM | Total performance measure |
| VAGO | Victorian Auditor-General's Office |
Audit overview
V/Line offers an important service to regional communities—it provides Victorians with access to services, education and employment across the state. Closer to Melbourne, V/Line also services many rapidly growing outer suburbs, and demand for these services is increasing.
V/Line operates and maintains a fleet of 372 passenger trains and carriages, and 3 520 kilometres of rail track used by passenger and freight services. More than 1 250 V/Line-branded coach services also operate every week, connecting the rail network with regional communities not serviced by trains.
From 2007, V/Line operated under franchise agreements with the Director of Public Transport. Since 2013, it has been operating under services agreements with Public Transport Victoria (PTV) to deliver safe, punctual and reliable rail and coach services for regional Victoria. As a state-owned enterprise, V/Line also reports to the Department of Treasury and Finance (DTF) and the Department of Economic Development, Jobs, Transport and Resources (DEDJTR).
In 2015–16, V/Line carried 17.7 million passengers—16.3 million on trains and 1.4 million on coaches—an increase of 88.3 per cent since 2006–07 and well beyond V/Line's expectations.
Several factors have contributed to the rapid growth in patronage, including the implementation of the Regional Fast Rail project in 2006, the completion of the Regional Rail Link (RRL) in 2015 and population growth in outer Melbourne and regional areas. These factors have put pressure on V/Line's services to incorporate features of an urban commuter network alongside its regional transport services.
A major challenge for V/Line is to cost-effectively manage the expected growth in patronage while improving performance.
We examined whether V/Line has delivered effective and efficient public transport services and whether it is adequately prepared to sustain and improve performance in the future.
Conclusion
V/Line has not successfully dealt with the challenges it has faced over the past decade. However, it has recently started to turn this situation around and is now better informed about the risks and challenges facing its operations. It now has a strong evidence base to support its asset management, and a new management approach to monitoring and dealing with operational and performance issues.
V/Line was not prepared for the strong growth in patronage and the resulting increase in service demand following the opening of the RRL, which fundamentally changed the nature of its operations. V/Line did not foresee this growth or fully understand the causes of its poor performance because it lacked the necessary capability. It also lacked focus, until recently, on managing its assets.
Consequently, V/Line's performance over the past 10 years has mostly fallen short of its targets and community expectations, despite infrastructure improvements and timetable changes.
The most significant impacts on V/Line's performance have been:
- ongoing financial pressure to deliver cost savings
- excessive wheel wear in VLocity trains and the failure of VLocity trains to activate boom gates on time
- network limitations
- an inability to consistently get V/Line trains to arrive at the metropolitan boundary in time to use their scheduled path
- congestion on the shared metropolitan networks.
V/Line's focus on achieving cost savings has improved its efficiency across a number of indicators, although it cannot demonstrate it is making the best use of its funding. It has not actively measured and benchmarked the efficiency of its passenger services since 2013.
Deficiencies in the basis of the thresholds and targets used to measure performance, and in institutional arrangements, have not supported effective planning, monitoring and governance of regional passenger services. The lack of clarity in the roles and responsibilities of public transport portfolio agencies has hampered V/Line's ability to address performance gaps and deal with emerging issues.
The establishment of Transport For Victoria (TFV), with its explicit focus on planning, is a key development with potential to strengthen governance in the transport portfolio.
Findings
V/Line's operational performance
V/Line has failed to meet key service criteria for the operational performance of its passenger services, as specified in its services agreement and in State Budget papers, particularly during the period July 2015 to March 2017.
In early 2016, V/Line's train services were reduced, and in some cases replaced by, road coaches. This was due to the concurrent issues of excessive wheel wear on VLocity trains and restrictions on the metropolitan network caused by the failure of boom gates to activate on time at the level crossing in Dandenong on the Pakenham line.
During the current services agreement, V/Line has not been able to consistently meet punctuality targets for its train services.
V/Line measures and reports train punctuality and reliability against the timetable communicated to passengers in PTV's journey planner, rather than the master timetable. This approach means that V/Line's reported performance does not represent its actual performance, or necessarily reflect passengers' experience, especially when there are significant service changes. This was highlighted during early 2016 when, despite the wheel wear and boom gate problems—and the replacement of 350 trains with coaches every week—V/Line's publicly reported performance suggested that little had changed.
When trains do not run on time, some passengers may miss connections with other public transport services. PTV, which is responsible for coordinating public transport, does not monitor V/Line train connections with regional town buses and is not aware of the extent of this problem.
Congestion on the shared metropolitan and regional network is one of several challenges V/Line faces in meeting punctuality targets. V/Line operates more than 32 500 services a year across the metropolitan network, and its trains fail to consistently arrive at the metropolitan boundary in time to use their scheduled path. This highlights critical dependencies for V/Line, particularly at interface locations on the regional–metropolitan boundary.
Completion of the RRL project in June 2015 was expected to alleviate conflicts between metropolitan and V/Line services on the western and south-western lines, and improve punctuality across both networks. However, the full benefits of segregating the track from the metropolitan network were not achieved. Punctuality on the western corridor has been significantly lower than it was before the RRL was implemented, mainly due to the wheel wear issue and the significant growth in patronage on those services.
V/Line imposes speed restrictions on the rail network to ensure the safe running of trains, but the restrictions result in longer journey times for passengers and reduce the punctuality of trains.
Customer satisfaction
The methods that V/Line, PTV and DEDJTR use to record and report customer satisfaction internally and publicly are inconsistent.
PTV conducts a quarterly customer satisfaction monitor (CSM) survey on both V/Line trains and coach services. PTV uses a subset of the results of the quarterly CSM to assess V/Line's performance under the services agreement. These results vary significantly from those publicly reported, due to the different assessment criteria used.
The scale that V/Line uses internally to track customer satisfaction differs from the scale that PTV and DEDJTR use to publicly report customer satisfaction, and the two approaches produce different results for the same periods.
The CSM survey has some limitations as a tool for measuring customer satisfaction, so V/Line introduced its own monthly measurement survey in 2016. This provides regular and detailed insights that allow V/Line to identify specific areas of dissatisfaction, resulting in a number of service improvements.
Train loadings
Growth in patronage increases train loadings and, if not well managed, results in passengers being unable to board a crowded train or experiencing an uncomfortable train journey.
The increase in passenger numbers following the opening of the RRL and new stations in metropolitan areas—Wyndham Vale and Tarneit—have resulted in almost a third of V/Line's peak services consistently exceeding the maximum capacity of seats available at the busiest point.
Although V/Line internally tracks train loadings, it is not required to meet any specific standards. The absence of a load standard in the current services agreement means we were unable to assess the extent of any load breaches or whether overcrowding is occurring.
To cater for increased service demand and to transition to more commuter-style services, V/Line is modifying new trains, including increasing seating, and is also preparing for more services with customers standing for part or all of the journey.
This will require a significant shift in V/Line passengers' expectations, especially for those who have historically experienced adequate seating availability. V/Line will need to develop a clear communication strategy to address its passengers' perspectives and needs.
Performance measurement frameworks
PTV has not adequately documented the basis for contractual thresholds and targets, or the State Budget output targets that it uses to assess V/Line's performance. As a result, it is difficult to determine whether the thresholds and targets represent a reasonable measure for assessing performance.
In our 2012 report Public Transport Performance, we noted that in 2008 V/Line requested a review of its punctuality threshold because it was not evidence based and was practically unachievable, given its resources and operational constraints. The former Department of Transport did not revisit this target when it revised the contracts in 2011, but indicated that it would review the target on completion of the RRL project. This did not occur.
Data used to measure performance varies in its reliability due to critical shortcomings in V/Line's and PTV's verification of reported performance.
For V/Line coach services, performance information relating to reliability and punctuality is self-reported by the operators contracted to provide the services. This approach has obvious and inherent risks—such as operator error and bias—which can affect the reliability of the data. To mitigate this risk, the coach contracts allow V/Line to conduct audits, which V/Line conducted for the first time in May 2017 for a limited number of services.
These issues raise concerns about the accuracy of the data submitted by operators and undermine the effectiveness and integrity of the performance regime.
V/Line's financial performance
PTV reviewed V/Line's financial performance in 2013 against international regional rail operators. It found that V/Line performed below average on most key efficiency indicators measured.
V/Line does not routinely monitor and report on the efficiency of its services. A significant amount of V/Line's managerial and board focus has been directed towards delivering the cost savings target set by PTV of $60 million over three years—$20 million per year from 2013–14 to 2015–16. Although some progress was made in delivering savings, this target has not been achieved.
The benchmarking comparisons in the 2013 review considered V/Line passenger services as a single operation. To better understand its efficiency, V/Line needs to collect data according to the four different types of services it delivers—commuter rail, frequent peri-urban all-day services, country long-distance trains and coach services. Each group's performance could then be compared with similar operations in other jurisdictions. V/Line currently does not have the systems in place to accurately produce separate data for the four types of V/Line passenger services.
To assess the efficiency of V/Line passenger train services, we established a set of agreed measures in consultation with V/Line and PTV. These showed that during the period 2012–13 to 2016–17, V/Line's efficiency improved for most indicators.
V/Line is also required to meet community needs in the way it operates its business, which affects its ability to be commercially viable. The community requirements that affect V/Line's business performance should be identified and measured to enable a comprehensive assessment of the efficiency of V/Line services.
Asset management
In the past, major periodic maintenance funding has not kept pace with the levels of funding required to maintain a fully operational and reliable passenger network. This has resulted in a deterioration of the network.
Until recently V/Line did not have a comprehensive understanding of the condition of its assets. It was therefore unable to develop sound long-term asset management strategies or to make evidence-based decisions on how it funded and prioritised maintenance and renewal work.
In 2015, V/Line changed its asset management approach from 'fix on fail' to 'predict and prevent', based on known asset condition. V/Line has now identified its maintenance backlog and has prioritised investments according to criticality and risk. The scale of funding required to address the maintenance backlog is significant—approximately $534.8 million across the entire V/Line network.
Asset failures limit V/Line's ability to deliver agreed service levels, resulting in customer delays and service cancellations. Many of the vehicles in V/Line's rolling stock fleet have been in service beyond their expected life, which is typically 30 years. Consequently they have a high failure rate and require significant investment in replacement and refurbishment.
To begin addressing the backlog, V/Line received a significant boost in maintenance funding for infrastructure assets in 2016–17.
Governance
DEDJTR, PTV, V/Line and VicTrack—which all have specific responsibilities for Victoria's transport-related land, assets and infrastructure—are jointly responsible for planning and operating regional passenger services in Victoria. There is a lack of clarity in the roles and responsibilities and overlapping functions between these agencies.
Recent reviews by V/Line and DEDJTR have found that inadequate governance procedures directly contributed to V/Line's funding shortfall of $50.5 million for the 2015–16 financial year. The complexity of governance arrangements—with overlapping functions between the agencies and multiple communication, reporting and oversight channels—has contributed to uncertainty in funding and budget planning.
Poor timetable development processes and inadequate collaboration between agencies on a new train timetable introduced in 2015 resulted in significant crowding on some lines and an initial drop in punctuality. The timetable was not tested and did not reflect operational constraints such as the availability and capabilities of V/Line's rolling stock.
Following greater collaboration between V/Line and PTV using a more robust timetable development process, the January 2017 timetable changes were successfully implemented.
Due to recent operational and asset management reviews, V/Line is now better informed about the likely risks and future challenges, although the current transport portfolio governance arrangements limit its ability to address performance gaps and deal with emerging issues.
In April 2017, TFV became operational. Its role is to plan and coordinate Victoria's transport system and associated agencies. TFV could have a significant positive impact on the governance arrangements in the transport portfolio, although how it will address these issues is uncertain at this early stage.
Recommendations
We recommend that V/Line:
1. strengthen its monitoring processes for measuring on-time running of trains and coaches (see Section 2.5)
2. improve its systems to collect and separately analyse and report operational and financial performance information between service groups—commuter rail, peri‑urban, country long-distance, and coach—and businesses, passengers and freight, to better understand performance in separate parts of the business (see Section 3.3)
3. undertake peer operational and financial performance benchmarking by service group with similar railways in other jurisdictions and devise a long‑term plan to improve efficiency (see Section 3.3)
4. use community service obligations to model and understand how they influence performance (see Section 3.3).
We recommend that Public Transport Victoria:
5. improve how it monitors and manages V/Line performance by:
- documenting the basis and methodology of targets and thresholds in the services agreement and State Budget papers (see Section 2.5)
- assessing the adequacy of existing performance measures and standards to achieve improvements in performance (see Section 2.5)
- preparing performance benchmarks for future services agreements that drive improvement and are periodically reviewed and reset where necessary (seeSection 2.5)
- periodically auditing V/Line's performance data and related systems (seeSection 2.5)
6. work collaboratively with V/Line to:
- more accurately reflect actual performance and passenger experience by measuring and publicly reporting reliability and punctuality against the master timetable (see Section 2.2)
- develop a more effective way to monitor customer experience performance, using lessons from the current services agreements (see Section 2.4).
We recommend that the Department of Economic Development, Jobs, Transport and Resources :
7. work collaboratively with Public Transport Victoria and V/Line to:
- better understand the impact of the shared metropolitan and regional network on V/Line's punctuality (see Section 2.2)
- develop evidence-based train-loading standards to determine the level of overcrowding on passenger trains (see Section 2.2)
- develop a more robust indicator of service demand by measuring the average passenger travel distances (see Section 3.3)
8. review the transport portfolio governance framework with a particular focus on clarifying the roles of key agencies and reporting and information flow (see Section 5.2).
Responses to recommendations
We have consulted with DEDJTR, DTF, PTV and V/Line, and we considered their views when reaching our audit conclusions. As required by section 16(3) of the Audit Act 1994, we gave a draft copy of this report to those agencies and asked for their submissions or comments. We also sent a copy to the Department of Premier and Cabinet.
The following is a summary of those responses. The full responses are included in Appendix A.
DEDJTR, PTV and V/Line responded, accepting the recommendations, and providing a detailed action plan on how they will address them. DTF did not respond.
1 Audit context
1.1 V/Line network and services
V/Line offers an important service to regional communities—it provides access to services, education and employment across the state. V/Line operates and maintains a fleet of 372 passenger trains and a network of 3 520 kilometres of rail track for passenger services (1 600 kilometres) and freight services (1 920 kilometres).
In 2015–16, V/Line carried 17.7 million passengers—16.3 million on trains and 1.4 million on V/Line-branded coaches—and operated:
- 71 950 commuter train services between Melbourne and Geelong, Ballarat, Bendigo, Seymour and Traralgon
- 12 815 long-distance train services between Melbourne and Bairnsdale, Albury, Shepparton, Echuca, Swan Hill, Ararat, Maryborough and Warrnambool
- 65 104 coach services that connect with the rail network and service regional communities. Some V/Line coaches also go to South Australia, New South Wales and the Australian Capital Territory.
Figure 1A shows the V/Line passenger network.
Figure 1A
V/Line train passenger network
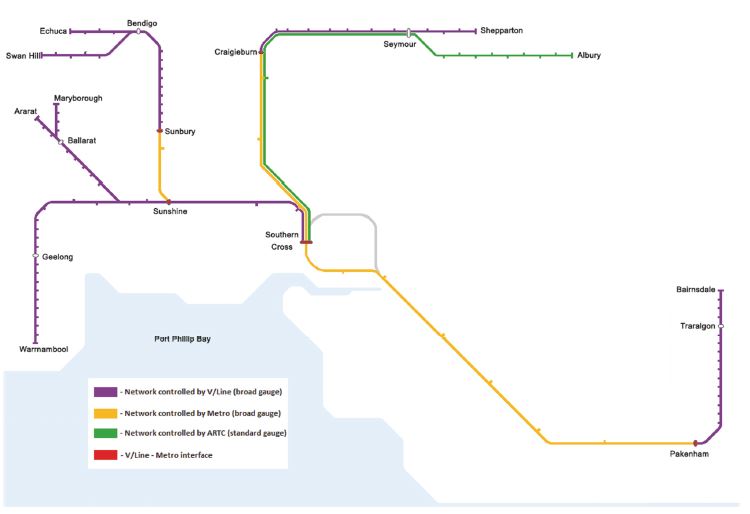
Note: The Australian Rail Track Corporation is responsible for interstate and freight services from Albury to Southern Cross (green section), with V/Line operating passenger trains on the line. The electrified metropolitan services (yellow sections) include Sunbury to Sunshine (northern corridor), Craigieburn to Southern Cross (north-eastern corridor), and Pakenham to Southern Cross (eastern corridor).
Note: Map is representative only and not to scale.
Source: VAGO, based on network map provided by V/Line.
1.2 Growth in V/Line services
The number of services and patronage on the V/Line train network has increased significantly over the last decade. Between 2006–07 and 2015–16, patronage grew by 88.3 per cent, from 9.4 million to 17.7 million, and the annual number of rail services grew by 25.4 per cent, from 67 600 to 84 765, as shown in Figure 1B.
Figure 1B
Train passenger trips and number of services, 2006–07 to March 2017
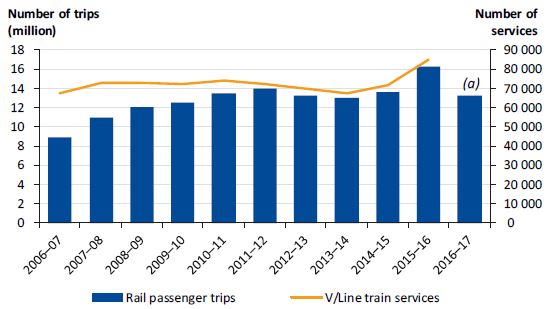
(a) 2016–17 data is from July 2016 to March 2017.
Source: VAGO, based on data from V/Line for 2016–17 and annual reports 2006–07 to 2015–16.
A number of factors have driven this growth:
- population growth
- employment growth in the central business district
- high fuel prices
- cut in regional fares by 20 per cent in March 2007
- changes to fare policy in January 2015, with trips across Zones 1 and 2 incurring a Zone 1 fare
- increased road congestion.
The sharp increase in passenger numbers of 18.3 per cent between 2014–15 and 2015–16 was largely due to the RRL opening in June 2015. The RRL separated metropolitan and regional services in Melbourne's west, opened two new stations on the Geelong line, and created dedicated tracks for Geelong and Ballarat trains in the metropolitan system. A high proportion of RRL services—around 40 per cent—travel to Geelong.
Similarly, passenger trips on V/Line-branded coaches have increased by 48 per cent since 2007–08 to 1.4 million in 2015–16.
Growth in patronage has varied from corridor to corridor—the south-western and western corridors have recorded the strongest growth (162 per cent and 102 per cent, respectively), followed by the eastern (68 per cent), north-eastern (30 per cent), and northern (14 per cent). Figure 1C outlines the key drivers of growth for each of these corridors.
Figure 1C
V/Line growth in patronage by corridor between 2006–07 and 2015–16
|
Corridor |
Growth |
Changes within the corridor |
|---|---|---|
|
South-western |
||
|
Geelong and Warrnambool trains—a broad-gauge double track to Geelong operating through the RRL, with a majority of services terminating at either South Geelong or Waurn Ponds. Some services continue further on a single track with passing loops, and terminate at Warrnambool. |
162% |
|
|
Western |
||
|
Bacchus Marsh, Ballarat, Ararat and Maryborough trains—a broad-gauge double track to Deer Park operating through the RRL, then a single track with passing loops to Ballarat, with most services terminating at Wendouree. From this point, some services continue where the line branches off to either Maryborough or Ararat. |
102% |
|
|
Eastern |
||
|
Traralgon and Bairnsdale trains—a broad‑gauge double track extending from the Pakenham line to Moe, then a single track with passing loops to Traralgon, where most services terminate. From this point, some services continue to Bairnsdale. |
68% |
|
|
North-eastern |
||
|
Seymour, Albury and Shepparton trains—a broad-gauge double track extending past the metropolitan Craigieburn line to Seymour, where the majority of services terminate. From this point, some services continue on a single track with passing loops and terminate at Shepparton. A single standard gauge also runs to Seymour, which then splits into a double track until Albury in New South Wales. Interstate express passenger train services to Sydney also use these tracks. |
30% |
|
|
Northern |
||
|
Sunbury, Kyneton, Bendigo, Echuca and Swan Hill trains—a broad‑gauge double track to Sunshine operating through the RRL, then the metropolitan Sunbury line. A double track continues to Kyneton followed by a single track with passing loops to Bendigo. From this point, some services continue where the line branches off to either Echuca or Swan Hill. |
14% |
|
|
All rail corridors |
||
|
Average across all rail corridors |
88% |
|
Source: VAGO, based on data from V/Line annual reports, 2006–07 to 2015–16.
The government's long-term strategy for public transport in regional Victoria, Connecting Regional Victoria: Victoria's Regional Network Development Plan, was released in May 2016. It identifies the government's intention to increase service levels in regional Victoria.
Changing mix of users
Population growth in outer Melbourne and increasing numbers of commuters from major regional centres have put pressure on V/Line's regional transport services to incorporate features of an urban commuter network.
V/Line now provides four different types of services for transport users with their own particular needs:
- commuter rail—for people travelling daily to work from major regional cities such as Geelong, Ballarat, Bendigo, Seymour and Traralgon and the surrounding country townships
- frequent peri-urban all-day services—for people living in outlying areas of Melbourne such as Melton, Tarneit, Wyndham Vale and Caroline Springs
- country long-distance rail—for occasional travellers from regional hubs and outer regional areas such as Warrnambool, Bairnsdale and Swan Hill who travel for a range of reasons such as medical appointments, visiting family and friends, study or entertainment
- coach services—for people living in regional areas where trains don't operate.
1.3 Agency roles
Figure 1D summarises the significant governance changes in the public transport sector over the past five years.
Figure 1D
Governance changes in the public transport sector
|
April 2012—Formation of PTV to oversee public transport operators that are responsible for the day-to-day operation of services under franchise or service agreements. November 2013—Transfer of administration responsibilities for coach services in regional Victoria from PTV to V/Line. January 2015—Establishment of DEDJTR, which has an integrated focus on the role transport plays in broader economic development. April 2017—Establishment of TFV, which has responsibility for planning, coordinating and integrating the transport system. |
Source: VAGO.
During this period, there have also been some significant internal organisational changes for V/Line, with three chief executive officers (CEO) and turnover of the majority of the executive leadership team and board.
V/Line
V/Line's primary role is to provide public transport services to regional Victoria. Its current three-year services agreement with PTV sets out the minimum level and standard of services V/Line must provide. PTV extended the contract for a further 15 months, and it is now due to expire in September 2017.
Public Transport Victoria
PTV was established in April 2012. It oversees all aspects of V/Line's day-to-day operation of the train and coach services, including performance requirements.
Department of Economic Development, Jobs, Transport and Resources
DEDJTR is responsible for the state's transport and infrastructure policy and planning. It is overseeing the negotiations of the new services agreement between PTV and V/Line.
Transport For Victoria
In April 2017, TFV became operational. This new agency plans, coordinates and integrates Victoria's transport systems. TFV sits within DEDJTR and has overarching responsibility for the transport portfolio. PTV continues to be responsible for managing and administering V/Line's services agreement and the train and tram franchise agreements.
Department of Treasury and Finance
DTF provides governance oversight of government business enterprises such as V/Line. V/Line must submit quarterly, half‑yearly and yearly performance reports to DTF. These reports include financial statements against forecasts and key financial and non-financial performance indicators.
1.4 Relevant legislation
V/Line Corporation is governed by the Transport Integration Act 2010 and the State Owned Enterprises Act 1992.
Transport Integration Act 2010
The Transport Integration Act 2010 sets out V/Line's objective to provide rail passenger and rail freight services consistent with the government's objectives and vision statement for the transport system. All Victorian transport agencies, including V/Line, are required to work together to achieve the government's vision of an integrated and sustainable transport system that contributes to an inclusive, prosperous and environmentally responsible state.
State Owned Enterprises Act 1992
V/Line Corporation was established as a statutory rail corporation in July 2003 and declared a state-owned business corporation under the State Owned Enterprises Act 1992 in October 2008. As a state-owned business corporation, V/Line provides performance reports to DTF and DEDJTR.
1.5 Why this audit is important
Reliable and efficient transport services are vital to link Melbourne and regional Victoria. An increasing number of regional Victorians rely on V/Line passenger services to access work, entertainment, medical services and other opportunities across Victoria and interstate. Closer to Melbourne, V/Line services many rapidly growing outer suburbs, and demand for these services continues to increase.
A major challenge for V/Line, and for the entire public transport sector, is to cost‑effectively manage the expected growth in patronage while improving performance.
1.6 What this audit examined and how
Our objectives were to assess whether V/Line has delivered effective and efficient public transport services, and whether it is adequately prepared to sustain and improve performance in the future. We examined whether:
- V/Line regional passenger services are efficient and meet the needs of public transport users
- V/Line's planning is rigorous and effective in identifying and managing current and future performance challenges.
We examined V/Line's performance and how it is managing current and future challenges. We also examined PTV's and DEDJTR's roles in overseeing and monitoring V/Line's operational performance and DTF's role in monitoring V/Line's financial performance.
We conducted our audit in accordance with section 15 of the Audit Act 1994 and the Australian Auditing and Assurance Standards. The cost of this audit was $545 000.
1.7 Report structure
The remainder of this report is structured as follows:
- Part 2 examines V/Line's operational performance
- Part 3 examines the efficiency of V/Line passenger services
- Part 4 examines V/Line's asset management practices
- Part 5 examines the governance arrangements that support delivery of V/Line passenger services.
2 Operational performance
V/Line's mission is to deliver customer-focused, safe and efficient regional passenger transport and rail freight services.
V/Line must meet key service criteria for the operational performance of its rail passenger services, specified in a services agreement with PTV as follows:
- total performance measure (TPM)—computed from the punctuality and reliability of different train services, weighted according to whether they are peak or off‑peak, weekday or weekend services
- reliability—timetabled train services delivered
- punctuality—train services running on time
- customer satisfaction with train and V/Line-branded coach services.
V/Line is also required to meet the reliability, punctuality and customer satisfaction targets specified in the State Budget papers. Coach services must meet benchmarks that measure punctuality, reliability and coordination with V/Line trains. V/Line specifies these benchmarks in contracts that PTV negotiated with operators.
This part of the report examines whether V/Line has performed satisfactorily and has met targets and passengers' expectations as set out in the services agreement and in State Budget papers.
2.1 Conclusion
V/Line's performance has mostly fallen short of its targets and community expectations, despite infrastructure improvements and timetable changes.
The failure of V/Line trains in the northern, north-eastern and eastern corridors to arrive at the metropolitan boundary in time to make their scheduled path, coupled with conflicts between regional rail and metropolitan networks, have contributed to this outcome. The RRL—designed to alleviate conflicts between metropolitan and V/Line services on the western and south-western corridors—has not delivered the expected performance improvements.
Until recently, performance analysis has not been sophisticated enough to drive a comprehensive and detailed understanding of V/Line's achievement of objectives or to inform management decisions and processes. Data used to measure performance is of varying reliability due to critical shortcomings in V/Line's and PTV's verification of reported performance. The basis of the thresholds and targets for performance measures is unclear and, as a result, they may not represent reasonable measures for assessing performance.
PTV and V/Line need to address these issues by:
- improving their understanding of the impact of the shared metropolitan and regional network on V/Line's punctuality
- developing a transparent, consistent and effective performance measurement regime.
2.2 Passenger train services
Recent issues affecting performance
From mid-2015 to early 2016, V/Line faced a number of issues that affected the delivery of its services, as outlined in Figure 2A.
Figure 2A
Issues affecting delivery of V/Line services from mid-2015 to early 2016
|
Overcrowding and delays on the Geelong, Bendigo and Ballarat lines Two new V/Line stations—Wyndham Vale and Tarneit—were created as part of the RRL, and a revised timetable added more than 340 new services a week. In July 2015, following completion of the RRL and implementation of a new timetable:
Faster-than-normal wheel wear on VLocity trains V/Line discovered in early 2016 that the VLocity fleet needed extra maintenance, which reduced the number of carriages available. An independent report found that the faster‑than-normal wheel wear was due to the combined effect of tight curves on sections of the RRL, high friction due to the absence of lubrication, and poor wear resistance of both wheels and rails. Metropolitan level crossing activation A VLocity train failed to activate boom gates on time at the level crossing in Dandenong on the Pakenham line in January 2016. For safety reasons, VLocity trains were prevented from operating on the Metro-operated sections of the Pakenham line, which is shared with V/Line's Traralgon, Sale and Bairnsdale trains (eastern corridor), until this issue had been addressed. Additional safety measures were installed in mid-March 2016, before the line was reopened to VLocity trains. As part of a long-term solution, axle counters are being installed at metropolitan level crossings shared with V/Line trains. |
Source: VAGO.
The unexpected issues of wheel wear and the failure of VLocity trains to trigger metropolitan level crossings on time occurred around the same time and led to 20 per cent of V/Line services being replaced by coaches during late January, February and early March 2016. The eastern corridor was worst affected, with over 70 per cent of V/Line services being replaced by coaches.
According to V/Line, these incidents caused significant service disruptions and inconvenience for passengers, and resulted in a loss in patronage of around 600 000 (3 per cent) during 2015–16. The service disruptions also had a significant financial impact on V/Line. It offered free travel to compensate passengers for the inconvenience, costing up to $2 million a week in fares, and replaced trains with coach services at a cost of up to $300 000 per day.
Network perspective
Services must meet minimum standards called thresholds. Remedial action is required if the thresholds are not met.
Individual rail corridors have different thresholds, which increase each year, based on assumptions made at the beginning of the services agreement about the operating environment. There is no mechanism for periodic resetting or review of the thresholds to reflect service or network improvements or actual performance.
V/Line advised that the new services agreement will allow for periodic resetting or review of the thresholds to consider network capacity.
Figure 2B outlines the TPM thresholds and targets in the services agreement across the V/Line train passenger network and for individual corridors for the past four financial years. Appendix B shows the TPM results for each corridor.
Figure 2B
Services agreement TPM thresholds and targets
|
Corridor |
2013–14 (per cent) |
2014–15 (per cent) |
2015–16 (per cent) |
2016–17 (per cent) |
|---|---|---|---|---|
|
Thresholds |
||||
|
Eastern—Traralgon and Bairnsdale |
64 |
70 |
78 |
78 |
|
North-eastern—Seymour and Shepparton |
68 |
72 |
78 |
78 |
|
Northern—Bendigo and Swan Hill |
79 |
83 |
88 |
88 |
|
South-western—Geelong and Warrnambool |
77 |
82 |
88 |
88 |
|
Western—Ballarat and Ararat |
83 |
85 |
88 |
88 |
|
Overall network |
76 |
81 |
88 |
88 |
|
Target |
||||
|
Overall network |
81 |
85 |
90 |
90 |
Note: The services agreement was extended a further 15 months to September 2017 with the same measures and targets as 2015–16. The 2016–17 data is from the nine-month period from July 2016 to March 2017.
Source: VAGO, based on V/Line's 2013 services agreement.
To contribute to the TPM for a given period, a train must fulfil the following criteria:
- run to the route scheduled in the daily timetable (reliability)
- not leave from its origin earlier than one minute before the scheduled time (punctuality)
- arrive at its destination less than five minutes late (punctuality).
There is no financial or other reward or penalty associated with the TPM.
Overall network performance
Figure 2C shows a steady decline in performance from 2006–07 until 2009–10. The current services agreement began in July 2013, and since then performance improved markedly until 2015–16 when it dropped sharply, and has continued to be well below the network threshold of 88 per cent.
Figure 2C
TPM, 2006–07 to 2016–17
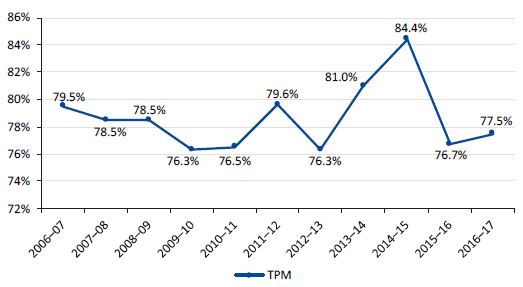
Source: VAGO, based on V/Line data.
The TPM was introduced in the 2013 services agreement. V/Line provided data from July 2016 to March 2017. We calculated results for the earlier periods.
Since the current services agreement began, V/Line has measured its performance on a daily and weekly basis, and it has developed better management reporting. Senior executive staff meet weekly in a 'visualisation room' to discuss performance and escalate problems and issues. They follow strict rules to achieve an effective and efficient outcome from the meeting.
Figure 2D shows the quarterly TPM results under the current services agreement for the period July 2013 to March 2017.
Figure 2D
TPM, July 2013 to March 2017
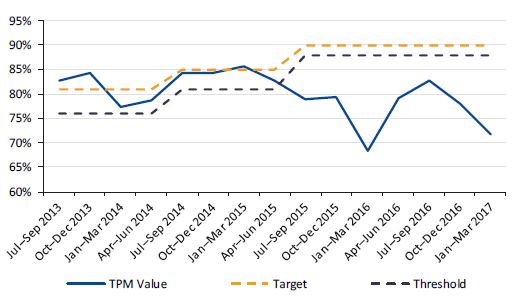
Source: VAGO, based on data provided by V/Line.
For the period July 2013 to March 2017, V/Line did not meet:
- the overall network threshold in seven of the 15 quarters (47 per cent of the time)
- the target in 12 of the 15 quarters (80 per cent of the time).
V/Line did not meet the TPM threshold in any of the four quarters of 2015–16 because:
- there were not enough carriages available to maintain timetabled services, due to the extra maintenance needed to repair the higher-than-normal wheel wear on the VLocity trains on the RRL
- VLocity trains failed to activate the boom gates on time on the Dandenong section of the eastern corridor leading to network restrictions.
V/Line, as required, prepared a cure plan following its failure to meet the TPM threshold for the September 2015 quarter. Despite this, V/Line was unable to improve its TPM performance for three consecutive quarters.
In March 2016, PTV requested a rectification plan detailing the course of action V/Line would take to address the continuing decline in the TPM. This plan was effective—V/Line's overall network TPM improved from a low of 68 per cent in the March 2016 quarter to 83 per cent in the September 2016 quarter. However, it has since dropped again to 71.7 per cent.
Performance in each corridor
If the TPM in a corridor falls below the required threshold in a quarter, PTV can require V/Line to submit a management plan to improve performance.
All corridors failed to meet TPM thresholds for most of 2015–16, due to the wheel wear and boom gate issues.
In 2016–17, all corridors failed again to meet TPM thresholds due to:
- temporary speed restrictions on several level crossings and work to upgrade 20 level crossings
- delays at stations to allow the increased number of passengers enough time to safely board and depart services
- train or carriage faults, heat speed restrictions, bad weather and obstructions on the tracks.
In Appendix B, we provide further details of the quarterly TPM results for all corridors for the period from July 2013 to March 2017.
V/Line submitted a management plan to PTV for the south-western corridor for failing to meet the threshold in the September 2014 quarter. Performance had not improved by the December 2014 quarter, but met the threshold by the March 2015 quarter.
V/Line did not submit a management plan for the western corridor. Instead, the Network Development Partnership forum—comprising PTV and V/Line representatives who discuss public transport performance issues—decided that PTV would regularly monitor the progress of V/Line's performance improvement initiatives. This was effective in improving performance by the September 2014 quarter.
PTV has yet to ask V/Line to prepare management plans for below-threshold performance in two successive quarters or more for all corridors during 2016–17.
Service punctuality and reliability
In addition to the TPM, V/Line must meet and publicly report on operational performance thresholds—on-time running (punctuality) and services delivered (reliability) for its train services.
A train service meets the criteria for punctuality if it arrives at its destination:
- less than 11 minutes late for long-distance journeys (such as Warrnambool and Bairnsdale)
- less than six minutes late for short-distance journeys (such as Geelong and Ballarat)
Reliability is the number of scheduled services delivered against the planned services.
Reliability and punctuality performance are measured against the timetable for that day, which is communicated four days in advance via PTV's journey planner. This may be different from the master timetable as it takes into account:
- special events—PTV identifies these and requires V/Line to plan extra services or increase existing services when patronage is likely to increase
- track occupations—these are requested by the engineering functions of V/Line, Metro Trains, the Australian Rail Track Corporation, and as a result of major projects such as level crossing removals by other authorities
- heat—major heat events on the network (usually from November to March) require changes to service running times or coach replacements.
Due to the extensive level crossing works on the eastern, north-eastern and northern corridors, changes to the master timetable are occurring daily.
Measuring reliability and punctuality performance against the timetable for that day is a major shortcoming, as it does not represent V/Line's actual performance. It also means that V/Line does not track variations in the services delivered against the master timetable.
Punctuality and reliability measures do not apply to replacement services, such as the replacement buses and coaches that operated during the V/Line restoration period from January to June 2016. This means that publicly reported punctuality and reliability results based on the timetable for that day do not necessarily reflect passengers' experience.
For example, during the wheel-wear problems and the failure of VLocity trains to activate boom gates on time—where almost 350 trains were replaced by coaches every week—PTV reported 100 per cent reliability performance on 14 February 2016, 97 per cent on 15 February 2016, and 98.3 per cent on 16 February 2016.
Taking into account these weaknesses in the data, Figure 2E shows that, for the period September 2011 to March 2017, V/Line reported that it:
- consistently met the reliability target of 96 per cent, except for the first quarter of 2016
- failed to meet its punctuality target of 92 per cent.
Figure 2E
V/Line trains quarterly punctuality and reliability, September 2011 to March 2017
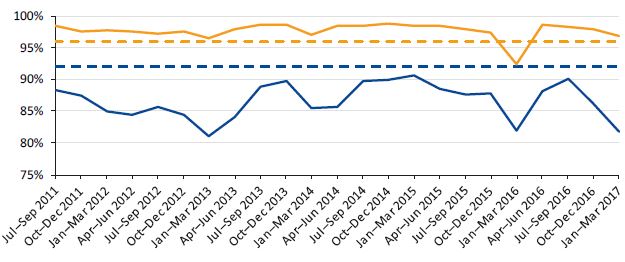
Source: VAGO, based on Track Record, September 2011 to March 2017—PTV's quarterly performance bulletin.
One impact of trains not running on time is that some passengers may miss connections with public transport services outside V/Line's jurisdiction. There is little impact on V/Line train‑to-coach connections because V/Line coaches wait for the delayed train.
Our review of V/Line coach connections for the period July 2013 to June 2016 shows that 99 per cent of coaches connected with V/Line trains. However, if passengers are connecting with regional town buses, they may miss this connection if the train is late.
PTV does not monitor V/Line train connections with regional town buses. As a result, we conducted a limited analysis of Ballarat town bus connections with V/Line train services in the month of August 2016. During this period, 13.3 per cent of V/Line trains did not arrive at Ballarat station within six minutes of their scheduled time. Consequently passengers missed 431 scheduled bus connections or, on average, 4.7 per cent of daily connections.
Barriers to achieving punctuality
V/Line advised that there are several challenges in meeting punctuality including:
- congestion on the shared metropolitan and regional network—V/Line operates more than 32 500 services a year across the metropolitan network
- speed restrictions—these reduce V/Line's ability to meet targets for punctuality
- congestion at Southern Cross Station
- limitations of rolling stock—the Classic Fleet runs at a slower speed than the VLocity trains
- single-track sections—over 60 per cent of the passenger network has single tracks
- old signalling on parts of the network—delays are caused by slow manual systems that allow only a single train in a particular section of the rail corridor, and mechanical systems that require a high level of maintenance
- growth in patronage—increased boarding times at stations.
Metropolitan and regional network boundary
Congestion on the shared metropolitan and regional network is a longstanding issue. In the First interim report of the Select Committee of the Legislative Council on Train Services, in May 2010, the secretary of the former Department of Transport advised the committee that: 'The main problems that V/Line faces in terms of its on‑time running relate to problems of congestion in the metropolitan area. By and large, V/Line does a pretty good job of running punctually on the regional network, but it tends to hit problems at the metropolitan boundary and from there on into the centre of the city. That simply reflects the levels of congestion that we have on our busiest lines, and those very busy lines tend to be the ones that V/Line uses.'
The factors affecting V/Line's performance on the regional network are different to those affecting its performance on the metropolitan system. This distinction is important, as V/Line has direct control of planning and operations on the regional network, whereas the metropolitan rail operator is responsible for managing the metropolitan system.
V/Line advised that rail traffic congestion within the metropolitan system regularly affects its service punctuality. V/Line provided data, presented in Figure 2F, to show that it has met the threshold of 92 per cent at the metropolitan boundary for inbound trains in all three years from 2013–14 to 2015–16 and from July 2016 to March 2017. However, its performance falls significantly short for the punctuality threshold at arrival.
V/Line advised this is mainly due to congestion in the metropolitan area, which limits the paths available to V/Line services and requires its trains to run at slower speeds.
Figure 2F
V/Line inbound trains punctuality at the network boundary, 2013–14 to 2016–17
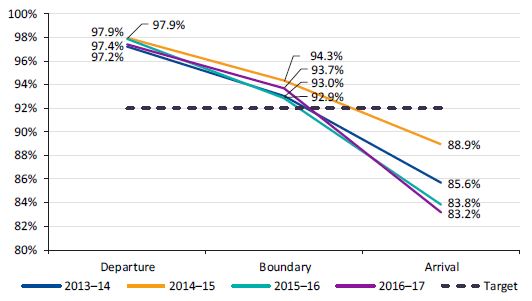
Note: 2016–17 data is from July 2016 to March 2017.
Note: The data for 2015–16 and 2016–17 does not include the western and south-western corridors as they are part of the RRL and do not connect with the metropolitan network.
Source: VAGO, based on V/Line data.
V/Line based its analysis of this data on trains departing and arriving at the metropolitan boundary and at the final destination less than:
- 11 minutes late for long-distance services
- six minutes late for short-distance journeys.
Due to the procedures for allocating paths outlined in the Access Agreement, Operating Protocols and Operational Interface Procedures, if a V/Line train does not arrive at the metropolitan boundary in time to use its scheduled path on that network, it may need to wait for another available path.
To obtain a better understanding of the extent of delay to V/Line trains on the metropolitan network, we re-analysed performance of inbound services at the metropolitan boundary using data based on assumptions that better reflect operational realities—that trains need to depart within one minute of schedule and arrive at the boundary within three minutes of the scheduled path in order to be able to use the allocated path.
Figure 2G shows that for the same period—July 2013 to March 2017—only 85.4 per cent (2013–14) to 89.4 per cent (2014–15) of V/Line trains arrived at the metropolitan boundary within three minutes of their scheduled time, leading to a significant portion of trains missing their scheduled paths.
Figure 2G
Revised analysis of inbound trains punctuality at the network boundary, 2013–14 to 2016–17
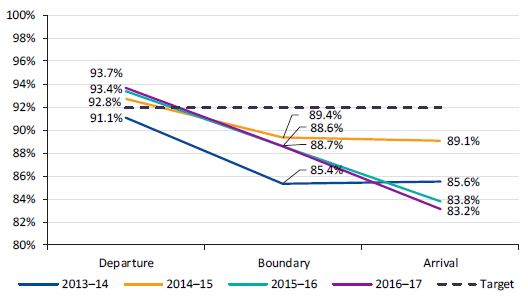
Note: 2016–17 data is from July 2016 to March 2017.
Note: The data for 2015–16 and 2016–17 does not include the western and south-western corridors as they are part of the RRL and do not connect with the metropolitan network.
Source: VAGO, based on V/Line data.
Figure 2H shows that, during the period July 2016 to March 2017, the three corridors that share tracks with the metropolitan network—northern, north-eastern and eastern—were below the punctuality target for trains at their arrival destination. The northern and eastern corridors were significantly below the threshold, due to a combination of V/Line trains failing to arrive at the metropolitan boundary within three minutes and congestion on the metropolitan network.
Figure 2H
V/Line inbound trains boundary punctuality by line, July 2016 to March 2017
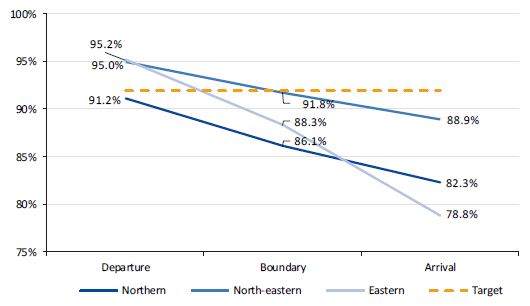
Source: VAGO, based on V/Line data.
V/Line advised that outbound services are also impacted by the shared network. Trains delayed on their outbound journey may not depart on time for their inbound journey if they do not have enough time to turn around for the return trip, creating a flow-on effect.
In July 2014 and May 2016, V/Line wrote to PTV expressing concerns about the procedures used for allocating paths to V/Line trains on the metropolitan network. According to V/Line, the protocols outlined in the Access Agreement and Operating Protocols are not as effective as they could be and can still result in significant delays for V/Line through the metropolitan network.
DEDJTR has since initiated a review of the Access Agreement and Operating Protocols and conducted a workshop to explore the current arrangements, issues and constraints.
The dual running of services on the metropolitan network must be actively managed to ensure services are not adversely affected, and to enable V/Line and the metropolitan franchisee to meet their operational and service requirements.
Regional Rail Link
The RRL was built to relieve congestion on the regional and metropolitan networks. On its completion in June 2015, it was expected to alleviate conflicts between metropolitan and V/Line services in the western and south-western corridors, and therefore improve punctuality. As shown in Figure 2I, however, the full benefits of segregating the track from the metropolitan network were not achieved.
Figure 2I
V/Line trains on-time performance (punctuality) pre and post RRL
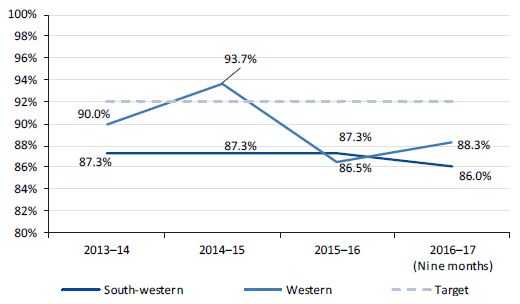
Note: 2016–17 data is from July 2016 to March 2017.
Source: VAGO, based on data provided by V/Line.
Punctuality in the western corridor was significantly lower in both 2015–16 and from July 2016 to March 2017 than it was before the RRL opened. This was mainly due to the VLocity wheel wear issue and the significant growth in patronage, which extended the time needed at platforms for passengers to board. Since the opening of the RRL, patronage on the Geelong line on the south-western corridor—V/Line's busiest line—has increased by 80 per cent.
Speed restrictions
V/Line imposes speed restrictions on the rail network to ensure that trains run safely. Reasons for this practice include the condition of track and infrastructure, level crossing risks and heat. Speed restrictions result in longer journey times for passengers and affect the punctuality of trains.
During 2016, more than 10 200 kilometres of rail journeys were subjected to speed restrictions across the entire passenger network, excluding heat-related restrictions. This equates to around 28 kilometres per day or around 1.8 per cent of the entire passenger network. The worst affected corridor was the south-western (4.8 per cent), followed by northern (2.2 per cent), western (1.6 per cent), eastern (0.9 per cent) and north-eastern (0.1 per cent).
When the temperature is 36 degrees, V/Line trains slow down because steel tracks expand in the heat. This is done as a safety precaution, but it reduces punctuality and causes frustration for customers.
V/Line performance data for the period July 2013 to March 2017 in Figure 2J shows that heat is a contributing factor in delayed V/Line train services, particularly during the summer months.
Figure 2J
Delay attributed to heat-related restrictions, July 2013 to March 2017
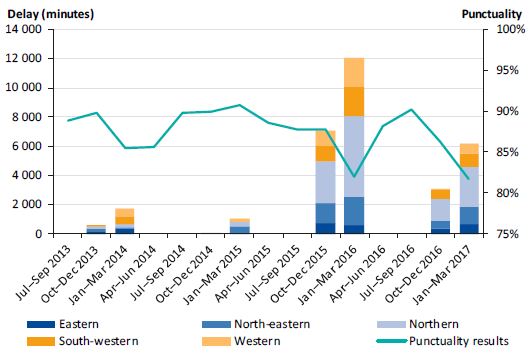
Note: The March 2017 quarter only includes January and February 2017.
Source: VAGO, based on V/Line data.
The northern corridor has been the most affected, with more than 40 per cent of the total heat-related delays. V/Line reviewed its Beat the Heat plan in 2015, resulting in a more flexible and effective approach for managing heat-related speed restrictions.
Train loadings
The rapid growth in passenger numbers is a significant challenge for V/Line, because its objective is to accommodate these passengers while improving performance. Growth in patronage increases train loadings and, if not well managed, results in more passengers being unable to board a crowded train or experiencing an uncomfortable journey.
V/Line advised that it is very rare that customers are not able to board a train. V/Line collects information to help it understand where crowding is a priority and to track measures to improve train loading.
V/Line reports the average capacity on peak train services on its website, based on average seats used at the busiest point. Capacity is reported as 100 per cent when all seats are occupied, but this does not show the number of people standing or demonstrate the amount of time that the services are at capacity.
Figure 2K, based on an analysis of V/Line data, shows that during the period July 2016 to March 2017, on average, 32.8 per cent of all peak services exceeded seat capacity. This is an increase over the 30 per cent of services at full capacity during 2015–16.
With the significant increase in patronage following the opening of the RRL and new stations in metropolitan growth areas—Wyndham Vale and Tarneit—52.8 per cent of peak services on the Geelong line during this period were on average exceeding the maximum capacity of seats available.
Figure 2K
Maximum seat capacity of peak train services, July 2016 to March 2017
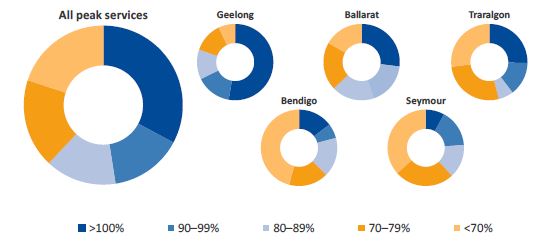
Source: VAGO, based on V/Line data.
In January 2017, PTV introduced a timetable change that added 80 extra services throughout the regional network. This was reviewed by Parliament's Economy and Infrastructure Committee. Its May 2017 Third report into infrastructure projects found that the extra services were off peak. Although they improve the choices for users at off‑peak times, they are unlikely to address capacity issues at peak times.
V/Line's measure of capacity does not assess passenger loads against benchmark standards. Under the previous franchise agreement, V/Line was required to provide seats for all passengers except those travelling within the designated metropolitan area—stations within the boundary previously formed by Sunbury and Pakenham.
Load breaches occurred when the number of passengers boarding a train exceeded the seating capacity outside the metropolitan zone, or when the number of passengers standing within the metropolitan zone exceeded the designated standing capacity for a particular type of train. Although V/Line internally tracks train loadings, it is not required to meet any specific standards.
The absence of a load standard in the current services agreement means we were unable to assess the extent of any load breaches or whether overcrowding is occurring.
Regional passenger demand at peak times is linked to population growth in regional centres and the impact of more outer metropolitan passengers, such as those from Tarneit and Wyndham Vale, on the Geelong line. In Appendix D we provide further details of the seating capacity of the overall network and the Geelong line for March 2017—on which V/Line achieved its highest recorded monthly patronage.
As not all passengers remain on the train for the entire journey, it is important to consider not only whether trains are reaching capacity but also at what location and for how long.
Most morning peak inbound services on the Geelong line are below seating capacity from the originating station, and passenger numbers increase as the train gets closer to Melbourne. The most significant increases occur at Wyndham Vale and Tarneit stations. Although most evening peak outbound services are at or above seat capacity when they leave Southern Cross station, a large proportion of passengers get off at Wyndham Vale and Tarneit stations.
The opening of stations in areas such as these can create surges in demand as residents shift from one mode of transport to another. To help meet this demand, the 2017–18 State Budget includes $311.1 million for 39 new VLocity carriages, taking the total order over the past two years to 66.
As part of the transition to more commuter‑style services and to cater for increasing numbers of passengers, V/Line plans to have more services where customers stand for part or all of the journey. To accommodate this, V/Line has recently added handles to seats on all VLocity trains for standing passengers to hold onto. It is also further modifying new trains, including increasing seating.
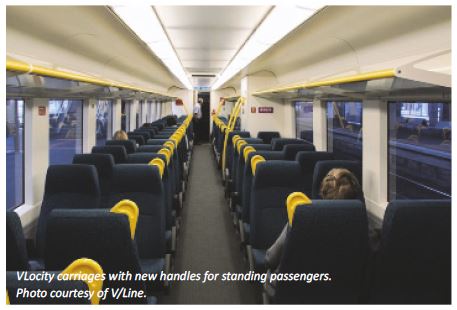
The move towards passengers standing on some V/Line services will require a significant shift in expectations for V/Line passengers, particularly for those who have been able to sit in the past.
V/Line will need to develop a clear communications strategy to address the needs of its passengers during the transition.
2.3 Coach services
V/Line-branded coach services are run by 26 different operators under 40 separate contracts—managed by V/Line but previously negotiated by PTV—which all contain the same performance expectations. The performance regime in each contract includes interim key performance indicators (KPI) on reliability and punctuality, as shown in Figure 2L. These contracts also allow for the introduction of a new performance monitoring regime before the contracts expire in July 2018. To date, this has not occurred.
Figure 2L
Interim KPIs on reliability and punctuality for V/Line coach services
|
KPI |
Performance benchmark |
Benchmark allowance |
|---|---|---|
|
Punctuality |
||
|
Departure of services |
No coach service may depart from any bus stop earlier than one minute before the scheduled departure time. |
Allowance of 1 per cent of services per calendar month or one service, whichever is greater. |
|
Arrival of services at stops and destinations |
Subject to the requirement to delay the departure of coach services if a connecting train is delayed, coach services operating on all routes in any calendar month must arrive at their scheduled destination no later than five minutes after the scheduled arrival time. |
Allowance of 2 per cent of services per calendar month or one service, whichever is greater. |
|
Reliability |
||
|
Cancellations |
No coach service scheduled to operate in any calendar month may be cancelled. |
Allowance of 2 per cent of services per calendar month or one service, whichever is greater. |
Source: VAGO, based on V/Line coach contracts.
According to V/Line data, from January 2013 to January 2017 coaches consistently achieved 100 per cent reliability and between 97.1 and 99.4 per cent punctuality.
2.4 Customer perspectives
PTV conducts a quarterly CSM survey of both V/Line rail and coach services. The CSM measures overall satisfaction with V/Line passenger services, as well as the individual coach and train services.
It also measures customer satisfaction with particular aspects of these services:
- station staff (train only)
- V/Line paper ticketing
- myki ticketing (train only)
- price of travel
- personal security
- information about services
- train stations and coach stops
- design and comfort
- refreshment
- seat reservations
- conductors and drivers
- running of services.
PTV randomly selects people to interview from the telephone directory in areas where regional train and coach services operate. Each quarter, PTV reports the results of the survey on its website in Track Record.
At the outset, passengers are asked to rate their overall satisfaction with the service on a six-point scale, which allows for historical comparisons with data collected before 2009. Passengers then rate each aspect of the service on a 10‑point scale. At the end of the survey, passengers rate the service again, but this time as a whole on a 10-point scale—known as the 'considered' rating—this is then multiplied by 10 to get a score out of 100.
V/Line internally tracks performance against the six-point scale and reports this in its annual report. However, PTV and DEDJTR report publicly against the 10-point scale. Both scales have differing targets:
- on the six-point scale, the target is 68 per cent for trains, with no target set for coaches
- on the 10-point scale, the target is 77 per cent for trains and 81 per cent for coaches.
Measurement of customer satisfaction using the six-point and 10-point scales tends to show similar patterns for both train and coach services. In general, the customer satisfaction results also tend to follow a similar trend to the punctuality and reliability of services.
Although using the six-point scale provides a historical comparison beyond 2009, having two scales is confusing. The 10-point scale was developed because it is considered more precise and easier for respondents to use. PTV should consider whether the six-point scale continues to provide any value.
As shown in Figures 2M and 2N, over the period July 2013 to March 2017, V/Line has not met the satisfaction target of:
- 68 per cent for trains in three of the 15 quarters
- 77 per cent for trains in 11 of the 15 quarters
- 81 per cent for coaches in six of the 15 quarters.
Figure 2M
Customer satisfaction, train, July 2013 to March 2017
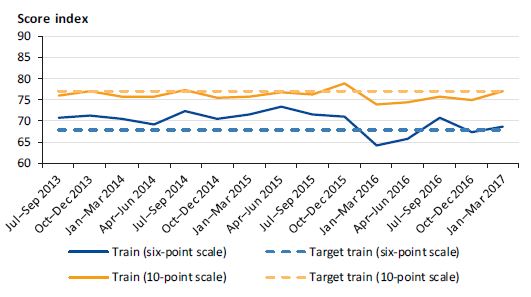
Source: VAGO, based on V/Line data and Track Record, September 2013 to March 2017.
Figure 2N
Customer satisfaction, coaches, July 2013 to March 2017
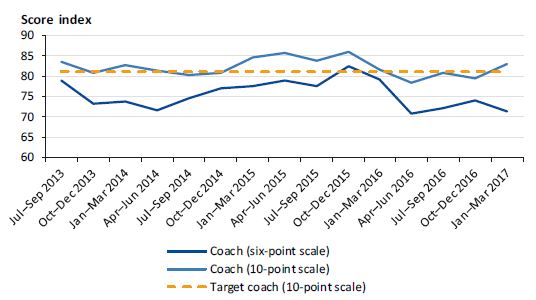
Source: VAGO, based on V/Line data and Track Record, September 2013 to March 2017.
Services agreement
PTV uses a subset of the results of the quarterly CSM—from the 10-point scale—to determine whether a 'call-in' or 'step-in' event has occurred under the services agreement. The assessment criteria are based on the average score across the following five sub‑components in the CSM survey:
- trains—overall information services on trains
- trains—number of announcements on trains
- trains—maintenance and cleanliness of train carriages
- trains—general cleanliness of train stations
- coaches—overall satisfaction with coaches.
A call-in event occurs if, in any quarter, V/Line achieves a score in the CSM survey below 77.3 per cent. A step-in event occurs if V/Line achieves a score equal to or below 77.3 per cent in two successive quarters immediately following a quarter in which a call-in event has occurred.
Under the current service agreement, V/Line has consistently achieved a score greater than 77.3 per cent, therefore a call-in event has not occurred. These results vary significantly from those publicly reported due to the different assessment criteria used.
V/Line advised that the CSM will be based on the publicly reported measure, and will align with the 10-point scale in the new services agreement.
Limitations of customer satisfaction monitoring
The CSM outlines primary, secondary and tertiary drivers of customers' overall satisfaction. The primary driver of overall customer satisfaction is the running of the services. Passengers are most concerned about wait times and unexpected delays due to late, cancelled or full services.
Under the services agreement, however, satisfaction measures relating to the running of services are not included. Instead secondary and tertiary drivers of overall customer satisfaction are included:
- maintenance and cleanliness (secondary driver)
- the number of announcements (tertiary driver).
It is unclear why this limited set of criteria trigger a call-in event. PTV has not provided evidence to explain why this is the case.
There are other limitations with the CSM survey as a tool for measuring satisfaction with V/Line services:
- it is reported quarterly so there are delays in analysing the data and addressing issues
- the sample size is restricted to V/Line users who have landline phones
- the eligibility criteria undermines the value of results—users are eligible to complete the survey as long as they have travelled on V/Line services in the past six months, so their experience may not be current.
To address some of these concerns, V/Line introduced the monthly measurement survey in 2016. This on-board survey samples customers across:
- all train lines, targeting the 26 busiest stations
- all times of day
- weekdays and the weekend
- inbound and outbound.
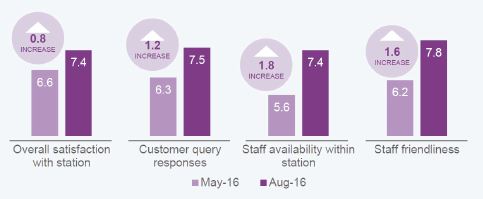
This regular and detailed insight allows V/Line to identify specific areas for improvement—as highlighted in the case study in Figure 2O, where survey feedback led to improvements at Footscray train station.
Figure 2O
Case study: Improvements at Footscray train station
|
Identification of issue In May 2016 the monthly measurement survey identified concerns with the lack of visibility of staff at Footscray station in the western, south-western and northern corridors. Improvements as a result of feedback V/Line advised that this was investigated and addressed through the re‑positioning of staff at the station. This resulted in a subsequent increase in satisfaction across the four customer satisfaction measures used. The mean score for overall customer satisfaction with the station increased by 0.8 from 6.6 in May 2016 to 7.4 in August 2016 after the concerns were addressed. The results for the other three measures—customer query responses, staff availability within the station and staff friendliness—also improved.
|
2.5 Performance measurement frameworks
A well-designed performance measurement regime includes:
- clearly defined and evidence-based measures and targets that are relevant to the services agreement's stated aims
- sufficient, reliable data to understand performance
- adequate reporting of performance.
The performance regime also needs to be cost-effective to administer.
Meaningful measures and targets
Meaningful targets are those that take into account past performance and the potential for improvement.
In our 2012 report Public Transport Performance, we noted that in 2008 V/Line requested a review of its punctuality threshold because it was not evidence based and was practically unachievable given its resources and operational constraints. The former Department of Transport did not revisit this target when it revised the contracts in 2011, but indicated that it would review the target on completion of the RRL project. This has not occurred.
PTV is now responsible for managing the services agreement with V/Line. When it developed the indicators for the current services agreement, PTV considered past performance.
Although PTV provided evidence of its analysis of past performance, it did not adequately document the basis for the services agreement thresholds and targets. Consequently, it was unclear whether the threshold or targets are a reasonable measure for assessing performance.
Rail Futures Institute's research shows that the punctuality and reliability measures V/Line uses are generous by international standards. V/Line short‑distance regional trains are considered on time if they arrive at the destination within six minutes of their scheduled time and long-distance regional trains if they arrive within 11 minutes. According to international standards, on-time performance occurs when departures or arrivals are within two minutes of the scheduled time for short-distance services or within five minutes for long-distance services. This is measured at major intermediate stations and at the origin and destinations.
The current re-negotiation of V/Line's services agreement provides an opportunity to remedy this situation. This is also an opportunity for PTV to ensure the basis and methodology for setting future targets and thresholds is formally documented.
V/Line advised that it is working with PTV to ensure the new services agreement includes mechanisms for aligning targets with network capability, service requirements and funding.
Data reliability
The integrity and effectiveness of the performance regime depends heavily on the availability of accurate and reliable data.
V/Line's and PTV's verification activities are limited, due to self-reporting by coach operators and inefficient manual systems with minimal quality assurance in other V/Line services.
For regional trains, station and signalling staff record arrival times. This data is collated, any discrepancies with global positioning system (GPS) data are resolved—although the latter may not always be accurate—and provided to PTV. There is a degree of internal scrutiny, but this information is not independently audited, and PTV does not verify V/Line's internal checks.
For V/Line coach services, which received $34.3 million funding in 2015–16, performance information on reliability and punctuality is self-reported by the operators. Self‑reporting has obvious and inherent risks—such as operator error and bias—which have the potential to affect the reliability of the data.
To mitigate this risk, the coach contracts allow V/Line to conduct audits of the coach operators' performance data and systems. There is no evidence that V/Line has verified the accuracy of the performance data provided by all operators.
In May 2017, V/Line conducted a 'mystery shopper' survey for the first time. Of the 12 services tested, no coach left an intermediate stop early and all arrived at their destination at or just before the scheduled time.
V/Line receives monthly performance data from each operator and then collates and enters it into a database. According to this data, during the period January 2013 to January 2017, coaches have consistently achieved 100 per cent reliability and between 97.1 and 99.4 per cent punctuality.
Our review of operator reports submitted in May 2016 and October 2016 revealed:
- missing operator reports—seven of the 26 reports in May 2016 and four of the 26reports in October 2016 could not be found; as a result, we could not verify the accuracy of data reported by operators
- that operators are only required to provide data on the on-time running of services for a random sample of 5 per cent of services, selected by the operator
- variations of between 1 and 23 per cent in the information submitted by the operator from the information in V/Line's database.
The high levels of punctuality and reliability that operators reported appear inconsistent with the results of the CSM.
V/Line coach services' operational performance is measured on how well services are run, including frequency, on-time performance and time taken to travel.
Figure 2P shows that satisfaction with the running of services is significantly lower than overall satisfaction with coaches. These issues raise concerns with the accuracy of the data that operators submit.
Figure 2P
Satisfaction with coach services compared to performance
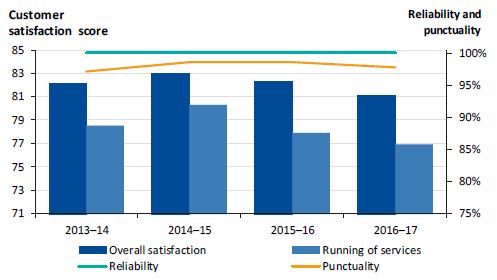
Note: 2016–17 data is from July 2016 to March 2017.
Source: VAGO, based on V/Line data and Track Record, September 2013 to March 2017.
These limitations in performance measurement undermine the effectiveness and integrity of the performance regime.
Public reporting
It is important that public reporting of targets, thresholds and payments is simple and transparent.
PTV publishes daily results of V/Line train reliability and punctuality on its website. It collates these results and other operational information into quarterly reports titled Track Record. These reports give the public an indication of V/Line's performance on the punctuality and reliability of its services, and reports on the results of customer satisfaction surveys.
There are no performance targets for the reliability and punctuality of regional trains in Track Record, although this is not clear from the reports on the results. Track Record reports on the minimum performance standards, known as thresholds. This means that the thresholds represent the minimum acceptable performance for V/Line rather than performance targets.
TPM is not publicly reported. PTV and V/Line plan to simplify performance monitoring in the new services agreement by discontinuing TPM as a performance measure and replacing it with the publicly reported punctuality and reliability measures.
3 Financial performance
An efficient railway system maximises revenues and minimises costs, while providing the desired level of service.
Definitions of an efficient railway system can vary according to government policies and community expectations. Some jurisdictions only judge the rail system as efficient when it is profitable, with minimal public funding. In others, the rail system may be required to service a broader market than would make sense from a strict business perspective, and to support economic and mobility policies that affect its direct business performance. For example, the rail system may be expected to provide lower fares to improve the mobility of citizens, and to attract passengers to rail over other modes of travel for environmental purposes or to relieve road congestion.
This part of the report examines the efficiency of V/Line train passenger services. Given the lack of data available, we were unable to assess the efficiency of coach services.
3.1 Conclusion
Although V/Line has not actively measured or benchmarked the efficiency of passenger services since 2013, its continued focus on achieving cost savings has improved efficiency across a number of indicators.
V/Line does not have the systems to accurately capture data across the different types of passenger services it delivers. Such systems would enable it to better understand opportunities for efficiency and to benchmark performance against railways with similar characteristics.
V/Line has no control over some aspects of its service and has obligations to the community that reduce its overall productive efficiency. It should consider these factors when assessing its efficiency and when making decisions about where to focus its attention to improve its financial performance.
3.2 V/Line operational reviews
During the past four years, there have been three independent operational reviews of V/Line's financial sustainability:
- PTV, May 2013,'Should Cost' Bid to Operate V/Line Franchise Agreement—which produced a cost estimate of V/Line's annual operations and formed the basis of the 2013–16 services agreement
- DEDJTR, August 2015, V/Line Financial Sustainability Review—following V/Line's identification of a significant funding shortfall
- V/Line, January 2016, V/Line Operational, Structure and Capability Review—after a request from the Minister of Transport for a review of V/Line's operational capacity.
'Should Cost' Bid to Operate V/Line Franchise Agreement
This review recommended savings of between $19 million and $48 million per year, depending on the level of investment provided and the time available for implementation. In response, PTV set savings targets of $60 million to be achieved over three years—$20 million per year from 2013–14 to 2015–16. Taking into account the impact of indexation over these years, V/Line was required to deliver an annualised $83 million in savings to achieve these targets.
The target of $60 million savings per year represented a 20 per cent reduction in V/Line's funding from the baseline of $298 million in 2012–13.
V/Line subsequently engaged consultants to develop and implement initiatives to deliver the savings targets identified in the 'Should Cost' Bid to Operate V/Line Franchise Agreement report.
Most of the smaller, easier-to-implement initiatives were identified and achieved, resulting in savings of $25.5 million.
V/Line Financial Sustainability Review
The review found a funding shortfall of $50.5 million in 2015–16 caused by:
- $16 million spending on extra services after the RRL was opened—30 per cent more services were offered than those funded in 2014–15
- $10.5 million shortfall in fare revenue as a result of the capping of myki fares and the reclassification of some stations from Zone B V/Line stations to Zone 2 metropolitan stations
- V/Line not being able to meet $24 million in savings targets.
V/Line Operational, Structure and Capability Review
This review found that, although some areas of V/Line were performing well or were improving, V/Line needed to commit to achieving much greater improvement in performance. It also noted that V/Line needed the services agreement to provide clearer direction on the level and standard of services required.
The review made 19 recommendations—four relating to V/Line's structure and 15 relating to V/Line's internal capability. V/Line is currently addressing these recommendations, with help from DEDJTR and PTV.
3.3 Efficiency of passenger services
The 2013 review 'Should Cost' Bid to Operate V/Line Franchise Agreement (the 2013 review) benchmarked V/Line performance against international regional rail operators. It found V/Line performed below average on most key efficiency indicators measured, as outlined in Figure 3A.
Figure 3A
V/Line's performance relative to international regional rail operators
|
Benchmark |
Comparison |
V/Line position |
|---|---|---|
|
Subsidy per passenger kilometre |
● |
Significantly higher than all UK operators |
|
Operating cost per train kilometre |
● |
Near average compared to other international operators |
|
Number of staff per million passenger kilometres |
● |
Near average compared to other international operators |
|
Head office staff relative to total staff |
● |
Near average compared to other international operators |
|
Train crewing cost per passenger kilometre |
● |
Significantly higher than all UK operators |
|
Driver costs per passenger kilometre |
● |
Significantly higher than all UK operators |
|
Train maintenance cost per train kilometre |
● |
One of the highest train maintenance costs compared to other international operators |
|
Train maintenance cost per vehicle |
● |
One of the highest train maintenance costs compared to other international operators |
|
Cost recovery percentage |
● |
Lower than other international operators |
|
Farebox revenue(a) per passenger kilometre |
● |
Lower than other international operators |
Note:
● Performing below average relative to international operators.
● Performing near average relative to international operators.
● Performing above average relative to international operators.
(a) Farebox revenue is the amount of revenue collected from passenger fares.
Source: VAGO, based on report, 'Should Cost' Bid to Operate V/Line Franchise Agreement, 2013.
Although no two railways are directly comparable, the benchmarks provide a basis for examining the efficiency of V/Line services.
Following the 2013 review, V/Line has not routinely monitored and reported on the efficiency of its services. V/Line's management and board have directed their focus mostly towards delivering the annual cost savings target of $60 million set by PTV.
V/Line set up a dedicated committee and engaged its own advisors to help identify and deliver these savings. Initiatives considered to deliver the savings targets included:
- removing catering
- reducing the numbers of regional signallers, drivers and authorised officers
- reducing and deferring carriage cleaning.
V/Line was able to find around $20 million in savings in the first year. Since then, it has been more difficult to find further savings without reducing staff or making changes to enterprise bargaining agreements.
The 2015 V/Line Financial Sustainability Review found that the initial series of savings initiatives were overly optimistic and that V/Line lacked the organisational ability to deliver them in full. The management team was relatively new, and delivering such a large-scale efficiency plan was a difficult challenge. In addition, V/Line's financial modelling was unable to provide management with accurate information.
Despite these challenges, V/Line has continued to focus on efficiency initiatives, and has $32 million in ongoing savings embedded into its 2016–17 budget. At May 2017, V/Line had achieved $27.3 million in savings.
Review of V/Line's performance
V/Line has not developed any internal efficiency indicators. As a result, we developed our own using Fielding's performance triangle—a framework used in the public transport industry—to identify and develop indicators to assess the efficiency of V/Line's regional passenger services.
This framework, shown in Figure 3B, identifies three types of measures—cost‑effectiveness, cost-efficiency and service effectiveness measures.
Figure 3B
Public transport performance
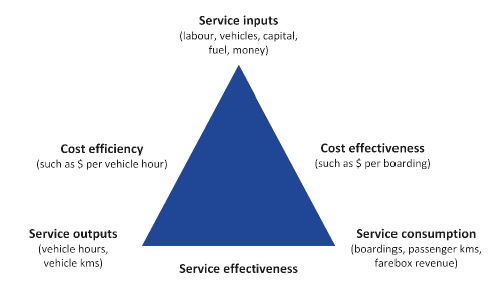
Source: VAGO, based on Managing Public Transport Strategically, GJ Fielding, 1987.
We assessed the measures used in the 2013 review against this framework and found that V/Line:
- has limited service output measures—the only cost-efficiency measures used included vehicle kilometres, which has a strong association with operating costs, or vehicle hours, which is associated with labour use
- does not have service effectiveness measures
- does not have a cost measure for track maintenance, despite the large rail network that V/Line maintains
- was not considering its community service obligations.
The government requires V/Line to meet community needs in the way it operates its business, which affects its ability to be commercially viable. The government regulates fares and requires V/Line to offer various types of concessional fares and free travel. In addition, V/Line provides many services that a for-profit business would not.
These requirements represent a cost to V/Line, which affects its business performance. Isolating these requirements would enable V/Line to make a comprehensive assessment of the efficiency of its services. The requirements are also a cost to the government, which must subsidise any shortfall between revenues and costs.
The benchmarking comparisons in the 2013 review considered V/Line passenger services as a single operation. In practice, V/Line's passenger services vary significantly, along with the associated performance expectations. There are four main types of services:
- Commuter rail is a long-distance train service from large regional centres to Melbourne, mainly carrying commuters, with trains running into the city before 9am and returning in the evening peak. This is an inherently inefficient service pattern, as trains are often used only twice a day, but staff are paid for a full day.
- Frequent peri-urban all-day services operate to the urban fringe of Melbourne, such as to Geelong, and operate frequently throughout the day. Demand patterns are still dominated by peak rail commuting, but the performance profile is very different to commuter rail.
- Country long-distance rail provides services to distant regional areas.
- Coach services are regional coaches that have a very different cost profile to that of rail.
Classifying V/Line passenger services into one of the four services groups and comparing each group's performance with similar operations would produce a better understanding of efficiency.
V/Line advised that it currently does not have the systems in place to accurately produce separate data for the four types of V/Line passenger services.
To assess the efficiency of V/Line passenger train services, we established a set of agreed measures in consultation with V/Line and PTV.
Figure 3C lists the performance measures we used to assess V/Line efficiency. V/Line provided data for each performance measure for the years 2012−13 to 2015−16 and a forecast for 2016−17. It became apparent that there were issues with the availability of data and the calculation of some denominators, such as passenger kilometres.
It is international common practice to use passenger kilometres as a measure of demand. This is particularly important in long-distance passenger railways because passenger travel distances are much longer than in urban areas—a 'trip' in a V/Line serviced area is on a much larger scale than one in an urban area. However, V/Line estimated passenger kilometres based on each passenger completing the whole route, which does not accurately reflect how far passengers actually travel, so we used the alternative measures listed in Figure 3C.
Figure 3C
Performance measures for assessing the efficiency of V/Line passenger rail services
|
Recommended performance measures |
Data available |
Adopted performance measures |
|---|---|---|
|
Cost-efficiency—inputs versus outputs |
||
|
Operating costs per train kilometre |
✔ |
Operating costs per train kilometre |
|
Train maintenance costs per train kilometre |
✔ |
Train maintenance costs per train kilometre |
|
Track maintenance costs per track kilometre |
✔ |
Track maintenance costs per track kilometre |
|
Train maintenance costs per vehicle |
✔ |
Train maintenance costs per vehicle |
|
Operating costs per train hour |
✔ |
Operating costs per train hour |
|
Train crew costs per train hour |
✔ |
Train crew costs per train hour |
|
Driver costs per train hour |
✔ |
Driver costs per train hour |
|
Cost-effectiveness—inputs versus consumption |
||
|
Staff per million rail passenger kilometres |
✘ |
Staff per million rail passengers |
|
Train crew costs per million rail passenger kilometres |
✘ |
Train crew costs per rail passenger |
|
Driver costs per million rail passenger kilometres |
✘ |
Driver costs per rail passenger |
|
Cost recovery—revenue (excluding subsidy) as a share of total costs |
✔ |
Cost recovery—revenue (excluding subsidy) as a share of total costs |
|
Farebox revenue per million rail passenger kilometres |
✘ |
Farebox revenue per rail passenger |
|
Other |
||
|
Head office staff to total staff |
✔ |
Head office staff to total staff |
|
Subsidy per million rail passenger kilometres |
✘ |
Subsidy per rail passenger |
Source: VAGO.
Appendix E shows V/Line's performance against each measure and any longer term trends where data was available from the 2013 review. Collectively the data shows a reasonably consistent long-term trend, although we noted a decrease in forecast farebox revenue in 2016–17.
Using the information provided by V/Line, Figures 3D, 3E and 3F illustrate the relative change in annual performance from 2012–13 to 2016–17 across the 14 measures listed in Figure 3C by type of measure—efficiency, effectiveness and other. These show that V/Line's efficiency has improved across a number of indicators, mainly due to its focus on achieving cost savings.
The efficiency measures in Figure 3D show that:
- all maintenance-related costs have increased since 2012–13, with track maintenance costs per track kilometre increasing by more than 35 per cent—thisis a result of increased funding to address the maintenance backlog (V/Line advised that its cost per kilometre are below Australasian Railway Association benchmarks for Australian rail operators)
- operating costs per train kilometre and per train hour have had a relatively small decrease of around 5 per cent since 2012–13, as has the subsidy per rail passenger
- train crew costs and driver costs per train hour have both decreased by more than 10 per cent since 2012–13.
Figure 3D
Relative change in cost-efficiency performance, 2012–13 to 2016–17
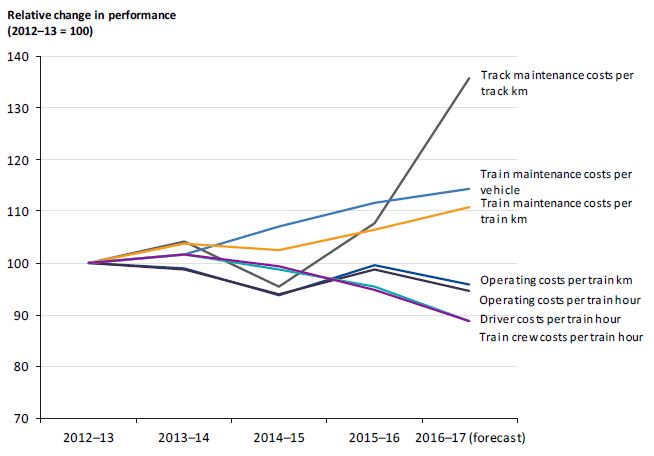
Note: 2016–17 is a V/Line forecast.
Source: VAGO, based on V/Line data.
The effectiveness measures in Figure 3E show that:
- train crew costs and driver costs per passenger had a relative decrease of about 20 per cent, due to the 35 per cent increase in numbers of passengers between 2012–13 and 2016–17, and this has driven a significant improvement inper‑passenger cost productivity
- the largest relative decrease in performance relates to cost recovery and farebox revenue per rail passenger—with reductions of around 20–30 per cent since 2012–13, due to the decline in fare yield from passengers (although passenger numbers have grown, revenues have not increased at the same rate).
Figure 3E
Relative change in cost-effectiveness, 2012–13 to 2016–17
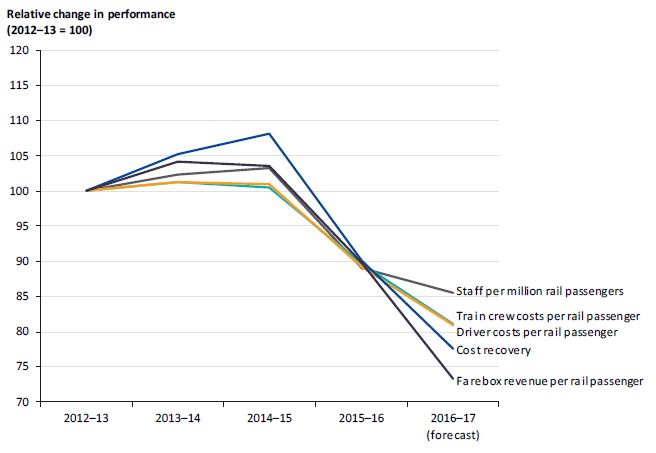
Note: 2016–17 is a V/Line forecast.
Source: VAGO, based on V/Line data.
Figure 3F shows that:
- the ratio of head office staff to total staff has been fairly consistent since 2012–13, although staff per million rail passengers has reduced by around 15 per cent
- the subsidy per passenger is forecast to decrease by 5 per cent in 2016–17.
Figure 3F
Relative change in other measures of performance, 2012–13 to 2016–17
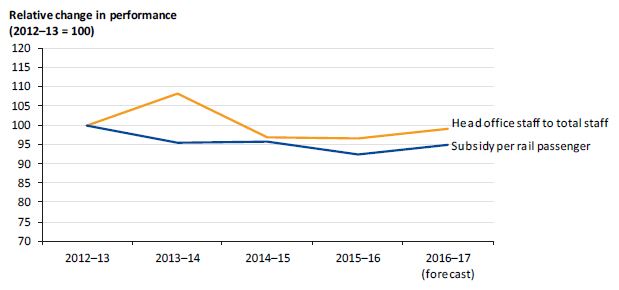
Note: 2016–17 is a V/Line forecast.
Source: VAGO, based on V/Line data.
4 Asset management
The regional rail network is a significant state asset. To be managed effectively, the network needs a sound asset management framework and strategy, based on a robust understanding of the condition of the existing assets and their capacity, capability and usage. The strategy should take into account available resources, funding constraints and competing service and asset priorities.
Under a services agreement with PTV, V/Line is required to manage and maintain regional rail infrastructure, including the rolling stock used for passenger services.
In this part of the report, we examine V/Line's asset management practices.
4.1 Conclusion
Until recently V/Line has not adequately discharged its maintenance responsibilities under the government's asset management policy. The policy sets clear expectations for Victorian public sector agencies to have a whole-of-life approach to asset management that focuses on the services the assets need to deliver.
V/Line's incomplete knowledge of the condition of its assets has limited its ability to develop sound, long-term asset management strategies and to make evidence‑based decisions on how to fund and prioritise maintenance and renewal work.
In 2015, V/Line began to address these deficiencies by adopting a whole-of-life asset management approach and completing condition assessments across its network and fleet assets.
Using this foundation, V/Line has now identified its maintenance backlog and is able to prioritise investment according to criticality and risk. However, V/Line must continue to build on these improvements by increasing its capacity to actively identify and manage assets and maintain infrastructure.
4.2 Managing V/Line assets
Until recently, V/Line was responsible for a regional-focused network with relatively low service frequency. It had limited experience in operating and maintaining metropolitan rail infrastructure with higher frequency commuter services.
The addition of the RRL to V/Line's asset portfolio significantly increased asset management risks, as highlighted in the June 2016 V/Line Technical Review (the 2016 review). DEDJTR and DPC commissioned this review, following the wheel wear and boom gate incidents.
The 2016 review found that V/Line had an immature asset management capability and was therefore unable to adequately predict and respond to these issues.
The 2016 review also found that PTV did not have the in-house skills, systems and experience to undertake its required asset management functions. As a result, PTV was unable to effectively manage V/Line's asset management issues.
In 2015, V/Line changed its asset management approach from 'fix on fail' to 'predict and prevent', based on known asset condition. This whole-of-life asset management approach is aligned to the International Standard for Asset Management ISO 55000 and DTF's Asset Management Accountability Framework (AMAF).
The AMAF requires V/Line and other public sector agencies to attest to their compliance with a range of mandatory requirements, including developing an asset management strategy, by 30 June 2018.
V/Line is currently conducting a comprehensive gap analysis against the mandatory requirements of the AMAF, and will develop and implement remedial plans for any identified deficiencies.
Work underway at DEDJTR shows a commitment to ensuring that Victoria's transport assets are managed effectively and efficiently, with service levels defined by a network development strategy. This work includes:
- implementing the AMAF across agencies in the transport sector
- developing and communicating the new Transport Asset Management Policy, which outlines how the asset management strategy will be applied across the entire transport portfolio
- developing and implementing a medium-term (15-year) transport asset management strategy, based on service levels outlined in the network development strategy, to support the delivery of transport services
- defining roles and responsibilities for asset management across the transport portfolio
- developing and implementing an appropriate portfolio-wide asset management governance structure—this will be developed under the new TFV governance framework.
PTV and V/Line are also reviewing the services agreement with a view to:
- defining asset management governance, accountability and verification, including the role of VicTrack as the residual asset owner
- understanding the impacts of asset condition, risks and associated criticalities on service delivery, regulatory compliance and safety considerations
- identifying maintenance gaps through evidence-based analysis
- improving monitoring and review processes by better defining performance targets and improvement strategies.
Asset management arrangements
Management of Victoria's regional train assets is complex because of the range of agencies involved—VicTrack owns the assets on behalf of Victoria and leases them to PTV, which then subleases them to V/Line.
As the manager, operator and maintainer of Victoria's regional passenger and freight rail networks and fleet assets, V/Line is responsible for the effective management of rail assets, across all phases of the asset life cycle.
V/Line also manages regional coach services. However, it has fee-for-service agreements in place with local bus operators and does not own or maintain the coaches providing this service.
V/Line's asset base consists of:
- infrastructure—track, bridges, structures, signalling equipment, communications, freight terminals, stations and maintenance depots
- rolling stock—VLocity and Classic Fleet vehicles, including wheels, electrical systems, carriage bodies, locomotives and brake systems.
Maintenance of V/Line's Classic and VLocity fleet is managed via a long-term agreement with a third party.
Asset information
Information about assets, particularly their condition, is critical for asset management planning. Data on asset condition, along with information about service levels, is useful to determine the gap between actual and desired asset condition.
In 2015 and 2016, V/Line commissioned Asset Condition and Criticality Risk Index (ACCRI) assessments of its asset base. The ACCRI framework helps organisations to identify asset condition and assign criticality ratings. The criticality ratings are based on the impact of the asset failure on the business. The index can be used to inform asset funding priorities.
In 2015, V/Line used ACCRI to assess its infrastructure assets and, in 2016, its Classic Fleet rolling stock assets. These were the first asset condition assessments that V/Line has conducted.
V/Line used this information to develop asset management plans for routine maintenance and major periodical maintenance, and to inform the annual works program.
In 2015, V/Line also implemented a fully integrated Enterprise Asset Management System (EAMS), which provides a single source of asset information. It replaced a variety of unsupported and unintegrated business systems. EAMS contains all of the ACCRI asset condition data and preventative work regimes, and enables analysis and reporting of asset condition to inform asset planning and prioritisation of funding.
ACCRI results
The ACCRI reviews provided information, using a five-point scale, for each asset based on its:
- condition—ranging from new and full functionality, to end of life and requiring replacement within one to two years
- criticality—representing the relative importance of the asset when assessed according to the impact of its failure on rail operations and the travelling public—considerations include patronage, tonnage, regulatory requirements and operational movements; commuter passenger lines assets receive the highest weighting.
Infrastructure assets
Figure 4A shows the asset condition for the:
- total V/Line portfolio—comprising the passenger and freight networks, and stations
- passenger network
- freight network
- stations.
Figure 4A
ACCRI condition rating of V/Line assets
|
Condition rating |
Passenger network (per cent) |
Freight network (per cent) |
Stations (per cent) |
Overall network (per cent) |
|---|---|---|---|---|
|
End of life—low residual life and approaching replacement within one to two years |
3.7 |
11.7 |
1.3 |
6.7 |
|
Poor—poor condition with 20 per cent of residual life and reduced functionality |
3.4 |
4.7 |
5.6 |
6.3 |
|
Average—mid-life with 50 per cent of residual life and full functionality |
19.8 |
34.6 |
12.7 |
24.8 |
|
Good—good condition with 80 per cent residual life and functionality |
52.0 |
31.7 |
36.8 |
35.8 |
|
New—new condition and full functionality |
21.1 |
17.3 |
43.7 |
26.4 |
Source: VAGO, based on V/Line ACCRI Project, 2015.
Figure 4A shows that 3.7 per cent of infrastructure assets on the passenger network are at end of life, compared to 6.7 per cent for the overall network.
When condition and criticality are considered together, 5.6 per cent of the passenger network assets were rated as an immediate priority, as shown in Figure 4B. These assets have a high likelihood of failure and significantly affect V/Line's ability to deliver agreed service levels.
A further 49.4 per cent of infrastructure assets were identified as high priority. Without investment to improve their condition, these assets will continue to deteriorate and will need to be replaced.
Figure 4B
Condition of V/Line's infrastructure assets
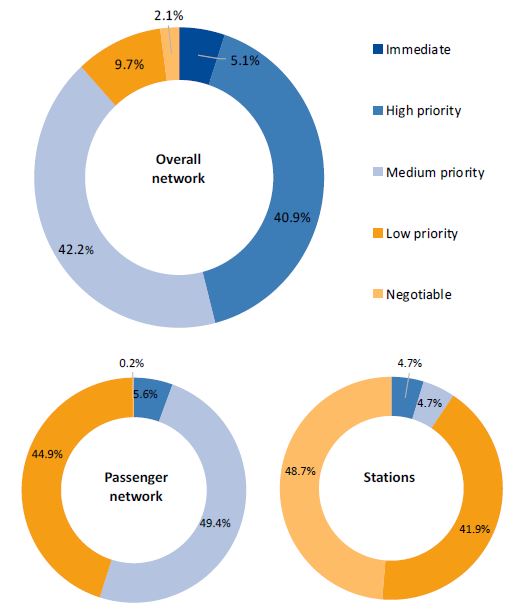
Source: VAGO, based on V/Line ACCRI Project, 2015.
The main causes of train cancellations over the period July 2013 to March 2017 were faults in rolling stock, signals and infrastructure, accounting for around 42 per cent of all train cancellations, as shown in Figure 4C.
Figure 4C
Causes of train cancellations, July 2013–March 2017
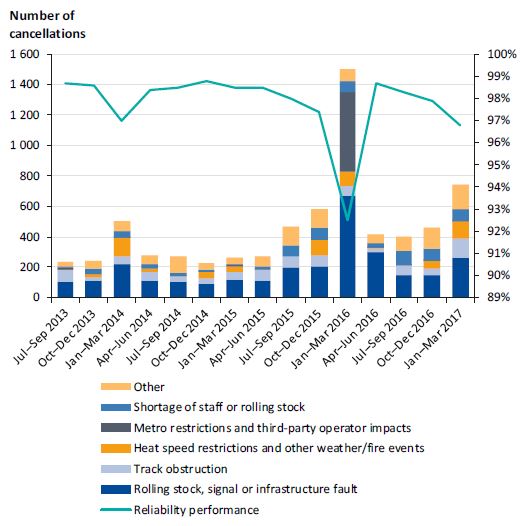
Source: VAGO, based on V/Line data.
V/Line reported to government that, if the immediate priority assets are not replaced, the impacts could include:
- increased use of temporary speed restrictions, resulting in decreased reliability and longer journey times for customers
- greater likelihood of asset failures, resulting in major disruptions to customers
- higher overall maintenance expenses and increasing capital replacement costs.
V/Line's current response to this deterioration includes:
- increasing reactive maintenance strategies, such as accelerated response to wheel wear
- adding operational constraints, such as temporary speed restrictions
- increasing inspection regimes.
Rolling stock
V/Line's rolling stock consists of a wide range of vehicle types of various ages. Many of the Classic Fleet legacy vehicles have been in service beyond their expected design life, typically specified as 30 years, as shown in Figure 4D. V/Line faces a major challenge to maintain them to current service standards.
To meet patronage growth and increased service levels, V/Line has significantly increased the operational usage of these assets over time. The government's rolling stock strategy, Trains, Trams, Jobs 2015–2025, has identified that, based on design lives of vehicles, 40 per cent of the regional train fleet will need to be replaced by 2025.
Figure 4D
Average age of rolling stock
|
Asset type |
Average asset life (years) |
Design life (years) |
|---|---|---|
|
VLocity |
6.8 |
30 |
|
Classic Fleet |
||
|
20.9 |
30 |
|
32.8 |
30 |
|
60.0 |
30 |
|
32.8 |
30 |
|
52.4 |
30 |
|
56.0 |
30 |
|
54.0 |
30 |
Source: VAGO, based on V/Line ACCRI Project, 2015.
V/Line's ACCRI assessment of its Classic Fleet determined that, as of July 2016, approximately $53 million worth of the fleet needed to be replaced as an immediate priority. To address this, the government allocated $12.47 million to V/Line for the 2016–17 financial year.
The VLocity fleet is relatively new and has not undergone an ACCRI assessment.
Maintenance funding
V/Line's routine maintenance activities, funded through the services agreement, include:
- regular inspection and testing of assets
- regular servicing and adjustment of equipment
- regulatory compliance
- repair of defects and faults to maintain an asset's operational performance and capacity to specified levels.
V/Line also carries out major periodic maintenance works, funded through the State Budget, which are intended to:
- preserve each asset's operational performance and capacity to specified levels
- reduce ongoing routine maintenance
- be cyclical in nature, with a frequency of 12 months or more.
In the past, major periodic maintenance funding has not kept pace with the levels of funding required to maintain a fully operational and reliable passenger network. This has resulted in deterioration of the network.
The scale of funding required to address the maintenance backlog is significant. The ACCRI review identified a backlog of maintenance work valued at approximately $534.8 million across the entire V/Line network, comprising:
- $196.1 million for the passenger network
- $315.9 million for the freight network
- $13.1 million for stations
- $9.7 million for other assets.
Based on the ACCRI results, V/Line submitted a business case to government for major periodic maintenance to address its maintenance backlog.
V/Line received a significant boost in routine and periodic maintenance funding for infrastructure assets from 2016–17. Figure 4E shows that total maintenance funding increased by 51 per cent from 2015–16 to 2016–17, with routine maintenance increasing by 29 per cent and major periodic maintenance by 65 per cent.
Figure 4E
Routine and periodic maintenance funding, 2012–13 to 2016–17
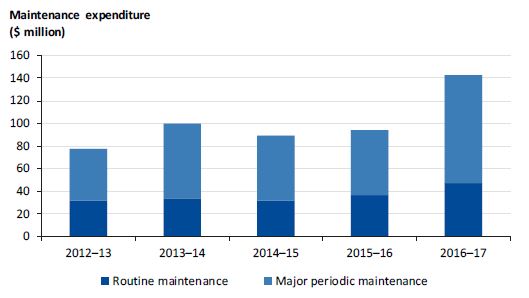
Note: Excludes maintenance funding for rolling stock and the Murray Basin Project.
Source: VAGO, based on V/Line data.
A further $287.9 million for major periodic maintenance has been allocated in the 2017–18 State Budget over the four-year forward estimates.
5 Governance
An essential element of good public administration is a governance framework that clearly sets out roles and responsibilities, and outlines how these roles will contribute to the overall purpose and function of a service or program.
DEDJTR, PTV, VicTrack and V/Line all share responsibility for the planning and operation of regional passenger services.
This part of the report examines whether the governance arrangements support the effective delivery of V/Line passenger services.
5.1 Conclusion
V/Line is now better informed about the risks and challenges it faces in delivering a diverse range of rail and coach services to the Victorian community. However, its ability to address performance gaps and deal with emerging issues is hampered by the transport portfolio's complex governance structure. There are complicated reporting and funding arrangements and a lack of clarity in the roles and responsibilities of public transport portfolio agencies.
The establishment of TFV, with its explicit focus on planning, is a key development designed to strengthen governance in the transport portfolio.
5.2 Contractual, reporting and funding arrangements
V/Line delivers services under an agreement with PTV. V/Line operations must also comply with:
- a projects agreementthat sets out V/Line's role and responsibilities in delivering or supporting the delivery of capital projects
- a network services agreement that outlines marketing and customer expectations
- the assignment of rights and creation of agency deeds for the administering of coach services.
VicTrack owns the infrastructure and leases it to PTV, which then subleases it to V/Line. These arrangements are illustrated in Figure 5A.
Figure 5A
V/Line's contractual arrangements
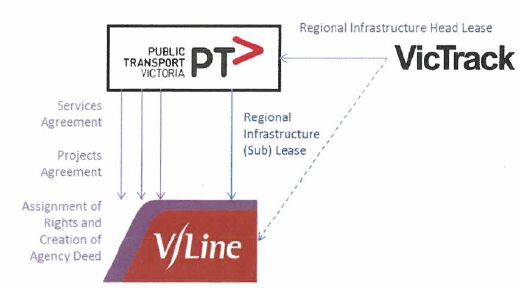
Source: V/Line Operational, Structure and Capability Review, 2016.
V/Line's reporting and funding arrangements, as shown in Figure 5B, further complicate these contractual arrangements. V/Line regularly reports to the responsible minister and three separate agencies—PTV, DEDJTR and DTF.
These multiple reporting lines, each with different audiences, create inefficiencies and subject V/Line to feedback, direction and influence from a variety of sources. V/Line must report on its performance under the services agreement, as well as reporting publicly against State Budget measures that have different targets.
Appendix C outlines V/Line's extensive reporting requirements under the services agreement and the State Owned Enterprises Act 1992.
Figure 5B
V/Line reporting and funding relationships
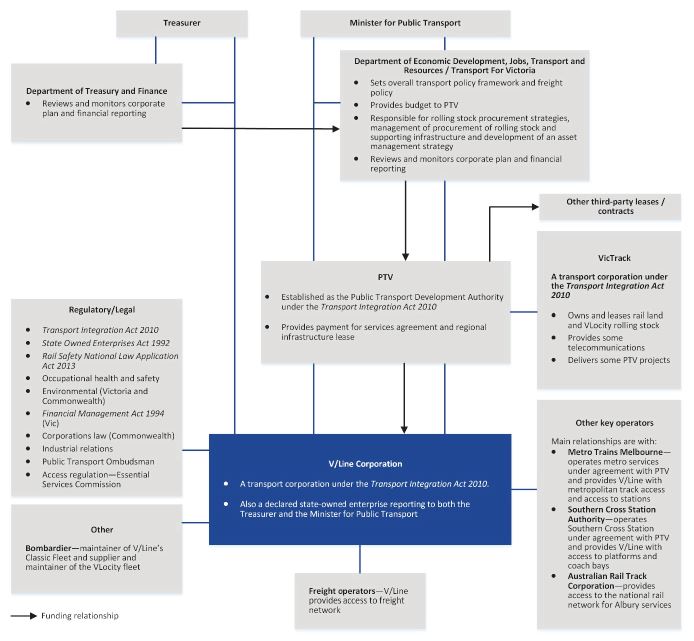
Source: VAGO, based on information from V/Line.
Recent reviews
The governance arrangements, including V/Line's reporting and funding relationships, have been recently scrutinised in several reviews:
- V/Line Financial Sustainability Review, 2015
- V/Line Technical Review, 2016
- V/Line Operational, Structure and Capability Review, 2016
These reviews identified weaknesses in V/Line's governance structures.
V/Line Financial Sustainability Review
The V/Line Financial Sustainability Review found that inadequate governance processes directly contributed to the V/Line funding shortfall of $50.5 million for the 2015–16 financial year. It identified that DEDJTR and PTV had not adequately monitored V/Line's ability to meet its savings targets and that timetable changes had not aligned with previous budget expectations.
V/Line Technical Review
The V/Line Technical Review focused on why the wheel wear and boom gate incidents occurred. The review found that the governance and management issues—particularly the lack of clarity in agency roles and decision-making authority—potentially contributed to these problems. For example, uncertainty exists as to whether V/Line is simply a rail operator or has broader responsibilities. This uncertainty arises from V/Line's accountability to its government‑appointed board and to the Treasurer and the Minister for Public Transport. There is also a lack of clarity about the expectations of V/Line in service planning, including the development of timetabling, rolling stock and service delivery responses to meet growing demand.
PTV has focused strongly on its procurement role, but has left some important functions to service providers, such as rail safety, asset management and coordination across the network. PTV has also interpreted its function of 'providing assistance to agencies' as simply meaning that it provides funding.
The boom gate issue is an example of an incident where PTV should have stepped in and forced a resolution. The issue was not new—the first reported incident with a VLocity train was in September 2011—but there was debate between V/Line and the metropolitan service providers on the cause of the problem and who should be responsible for rectifying it. In its oversight function, PTV has an important role to play as arbitrator when service providers disagree. In this instance, PTV failed to clarify responsibilities and ensure a sustainable solution was implemented.
V/Line Operational, Structure and Capability Review
The V/Line Operational, Structure and Capability Review (the operational review) found that:
- there is uncertainty in the transport portfolio about the role of V/Line and the services expected from it as a rail operator
- governance arrangements are complex—overlapping functions between V/Line, PTV and DEDJTRand multiple communication, reporting and oversight channels, havecontributed to uncertainty in funding and budget planning
- there is poor collaboration between agencies.
Figure 5C highlights this lack of collaboration, using the example of the introduction of the new timetable in June 2015, following the opening of the RRL.
Figure 5C
Introduction of V/Line's new train timetable
|
Background Following the completion of the RRL, a new V/Line timetable was introduced on 21 June 2015, which scheduled 30 per cent more services. Little collaboration in development of the timetable There was significant change in the timetable—V/Line was to provide four times the number of services during peak times, and it was making the transition from providing regional services only, to delivering both regional and suburban services. Despite the scale of the change, V/Line did not have all the elements of a readiness plan in place that included:
Due to resourcing and system limitations, PTV provided the timetable change specifications to V/Line without enough collaborative development. Issues with overcrowding and punctuality of trains Significant overcrowding occurred when the RRL opened—particularly on the Ballarat and Geelong lines—as passengers adjusted to the new timetable. This led to a significant initial drop in on-time performance during the peak period—from 89 per cent across the regional network to 68.9 per cent. Review of the timetable's implementation Given the relatively poor performance of the timetable, PTV commissioned a review to identify the problems with the development and implementation of the timetable. The review identified significant weaknesses in the communication between V/Line and PTV, and raised concerns about their joint processes for planning, designing, budgeting and implementing new timetables. The review found:
Lessons Guided by lessons from the introduction of the June 2015 timetable, V/Line and PTV collaborated more closely and used a more robust timetable development process for implementing a new timetable in January 2017. An independent review of the operational readiness of the new timetable noted good governance practices, including incorporating a risk register, a project management plan, a project steering committee, a project manager and regular management forums. V/Line and PTV advised that the January 2017 timetable changes were successfully implemented with few issues. |
Source: VAGO.
Figure 5C highlights the value of good governance and planning arrangements. To address the identified governance issues, the operational review recommended that V/Line advocate for improved reporting lines. It also recommended that V/Line request its role as a contracted service operator be clearly set out in future services agreements, supported by clear indicators and performance benchmarks.
The review also recommended that V/Line work with PTV and DEDJTR to:
- clarify and define its role and service objectives in the services agreement, taking into account V/Line's dual role as a commuter service provider and a regional transport operator
- establish a set of business rules to facilitate productive and transparent inter‑agency functions and partnerships, particularly those affecting planning, investment prioritisation and budgeting.
DEDJTR has agreed to work with V/Line and PTV to address these recommendations. DEDJTR will issue a statement of expectations to V/Line to confirm its role and its relationships with other agencies, and to address specific issues for V/Line.
Both V/Line and PTV have endorsed a set of working principles to inform the drafting of the new services agreement, currently under negotiation. These principles deal with the roles and responsibilities of each party, funding arrangements, key performance indicators, and development of business rules for:
- making changes to network services, including implementing timetable changes
- developing business cases, including prioritising investment, and developing funding bids and submissions
- reporting on performance, customer service and communications, safety, security and environment, and financials.
In developing these business rules, both parties acknowledged the need to:
- minimise the duplication of reporting and auditing between V/Line, PTV, DEDJTR and DTF
- focus on aligning reporting obligations against the respective roles of V/Line as service provider and PTV as contract manager.
5.3 Capability
Since 2015, V/Line has seen significant change in its operating environment, due to expansion of its infrastructure and the services it is responsible for. V/Line has improved its internal processes and capability by investing in new asset management systems and processes, but there is evidence that capability gaps remain within the business.
The V/Line Operational, Structure and Capability Review found that V/Line is performing at a reasonable level, despite the growth in patronage and the pressure on funding, primarily due to the savings targets that began in 2013–14. However, the poor implementation of the June 2015 timetable and the wheel wear and boom gate incidents have highlighted capability gaps.
The V/Line Technical Review concluded that a range of internal capability issues at V/Line contributed to the wheel wear incident. These are some of the issues:
- Planning—The design of the track included significant constraints, such as tight curves, that were not matched to the operating plan and were not achievable in practice. This was the result of a lack of integration between infrastructure, timetable and operations planning, a failure to dynamically test the infrastructure and operating plan, and a failure to monitor actual operating activity relative to design tolerances. Further, maintenance plans were not appropriately designed or monitored to account for known track constraints, particularly the need for lubrication on tight curves.
- Asset management—V/Line's asset management capability was immature. There was a lack of appropriate asset management planning and defect monitoring to identify wheel and rail interface issues earlier. V/Line did not respond quickly enough and did not adequately investigate the initial issues identified.
- Project management—V/Line has relied heavily on outside contractors for many of its project management functions. As a result, V/Line's project management capability is weak and much of the corporate and infrastructure knowledge associated with projects has not been retained in the business.
During 2015, many of these capability issues were exacerbated as V/Line faced significant challenges that clearly stretched its abilities.
V/Line was involved in many major activities at this time:
- The transition of RRL infrastructure to V/Line was a major exercise requiring detailed consideration and analysis of the new infrastructure to determine its impact on services.
- The development and introduction of a major new timetable entailed a 30percent increase in services and considerably higher service frequencies. V/Line was moving from being solely a regional operator to providing more commuter‑style services, with very different customer needs. V/Line's and PTV's approach to implementing the new timetable appears to have lacked the necessary discipline and rigour for such a significant change in operations.
- V/Line introduced a new asset management system but did not have the considerable staff resources and capability required to do this well.
- V/Line had been asked to deliver cumulative annual cost savings of $60 million over three years but was struggling to achieve this level of savings. During the middle of 2015, reviews of V/Line identified a significant financial shortfall and investigated the drivers of the shortfall. This was a substantial focus for the leadership group.
- V/Line tried to meet its goal of becoming one of the top 5 per cent of customer service organisations in the world. To achieve this, V/Line became a certified customer service organisation under the International Customer Service Standard, following an independent assessment against the standard by the Customer Service Institute of Australia. V/Line is the only state-owned enterprise in Victoria to achieve this accreditation.
Clearly these activities were the major focus for management. For an agency of the size and capacity of V/Line, with a relatively new senior management team, this was an extremely full management agenda.
V/Line, PTV and DEDJTR all have a role to play in addressing the issues identified by recent reviews. DEDJTR is managing the recommendations of the V/Line Technical Review, as part of its broader asset management reform program.
V/Line's board has also accepted all of the 15 recommendations relating to capability from the V/Line Operational, Structure and Capability Review.
Appendix A Audit Act 1994 section 16—submissions and comments
We have consulted with DEDJTR, DTF, PTV and V/Line, and we considered their views when reaching our audit conclusions. As required by section 16(3) of the Audit Act 1994, we gave a draft copy of this report, or relevant extracts, to those agencies and asked for their submissions and comments.
Responsibility for the accuracy, fairness and balance of those comments rests solely with the agency head.
Responses were received as follows:
DEDJTR
PTV
V/Line
RESPONSE provided by the Secretary, DEDJTR
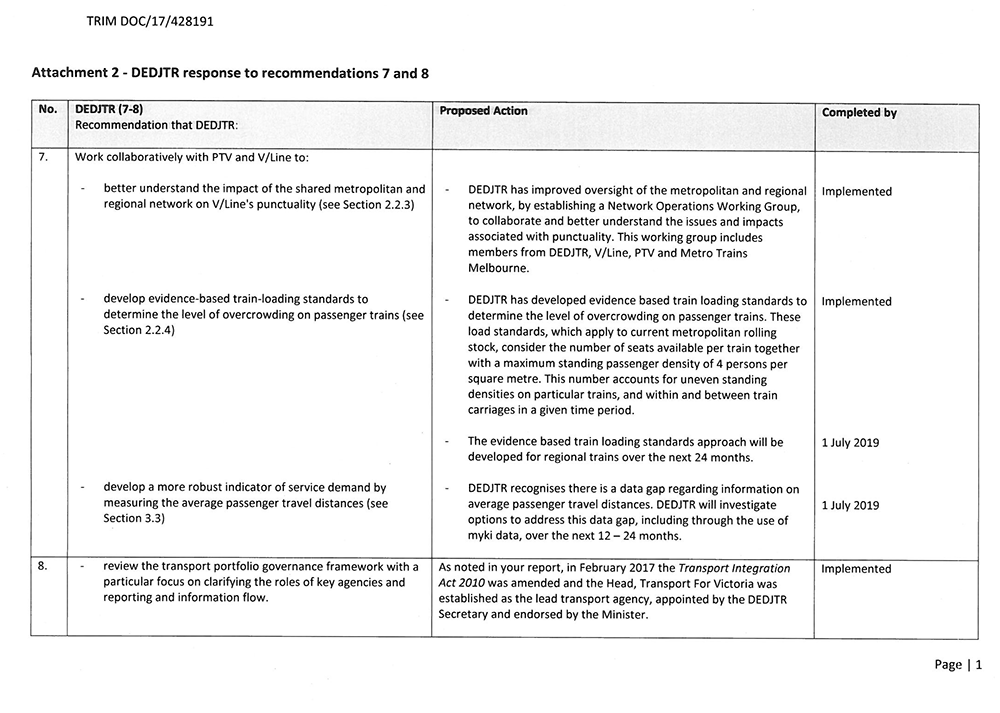
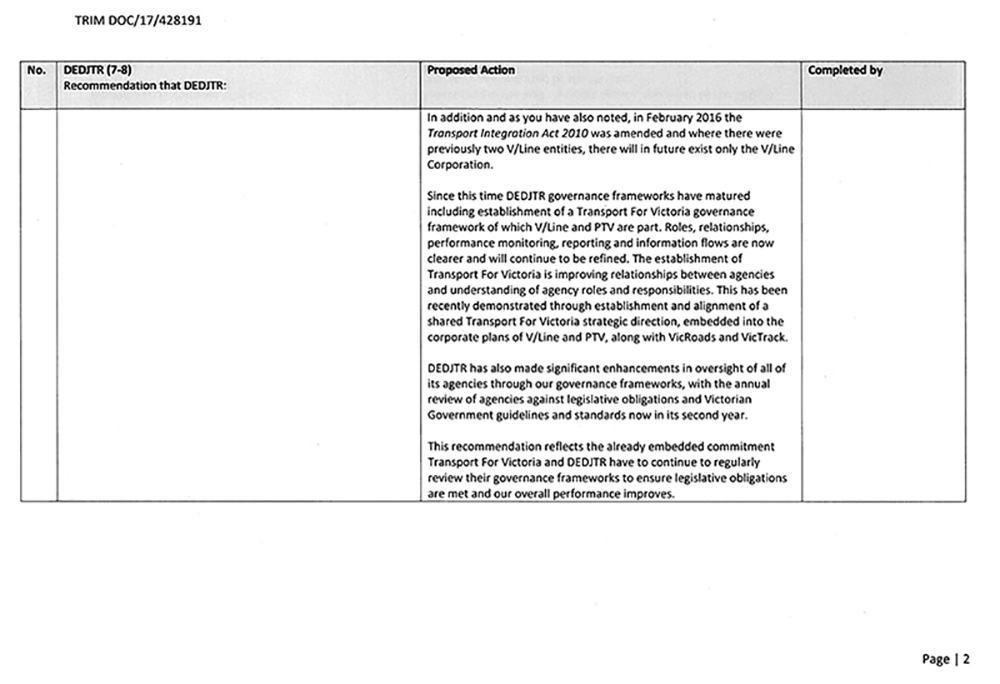
RESPONSE provided by the Chief Executive Officer, PTV
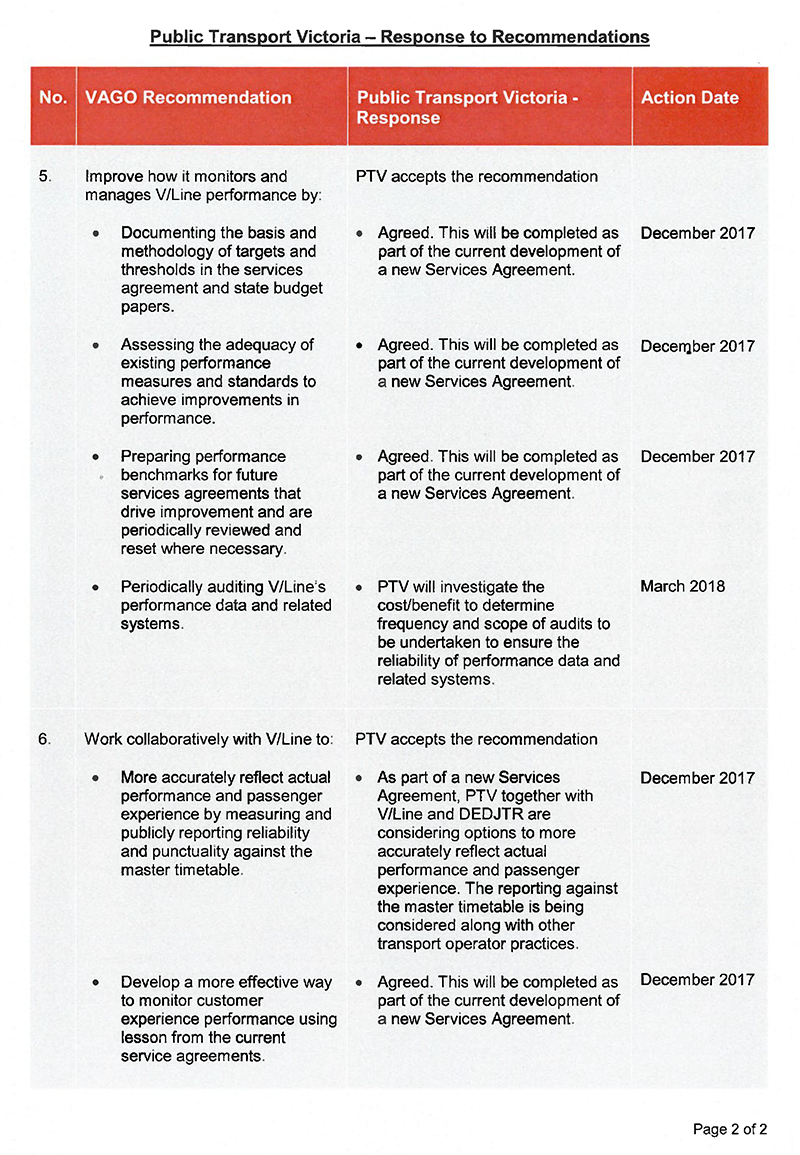
RESPONSE provided by the Chief Executive Officer, V/Line
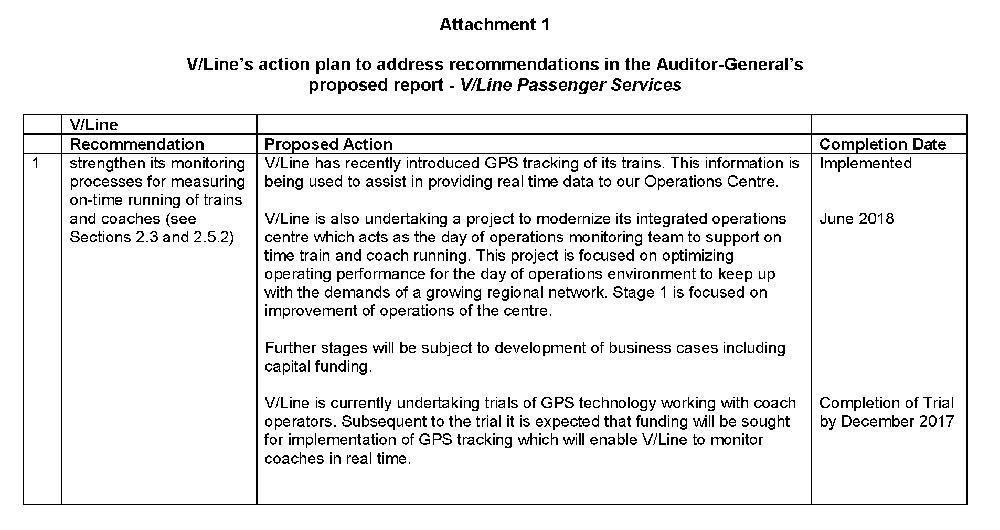
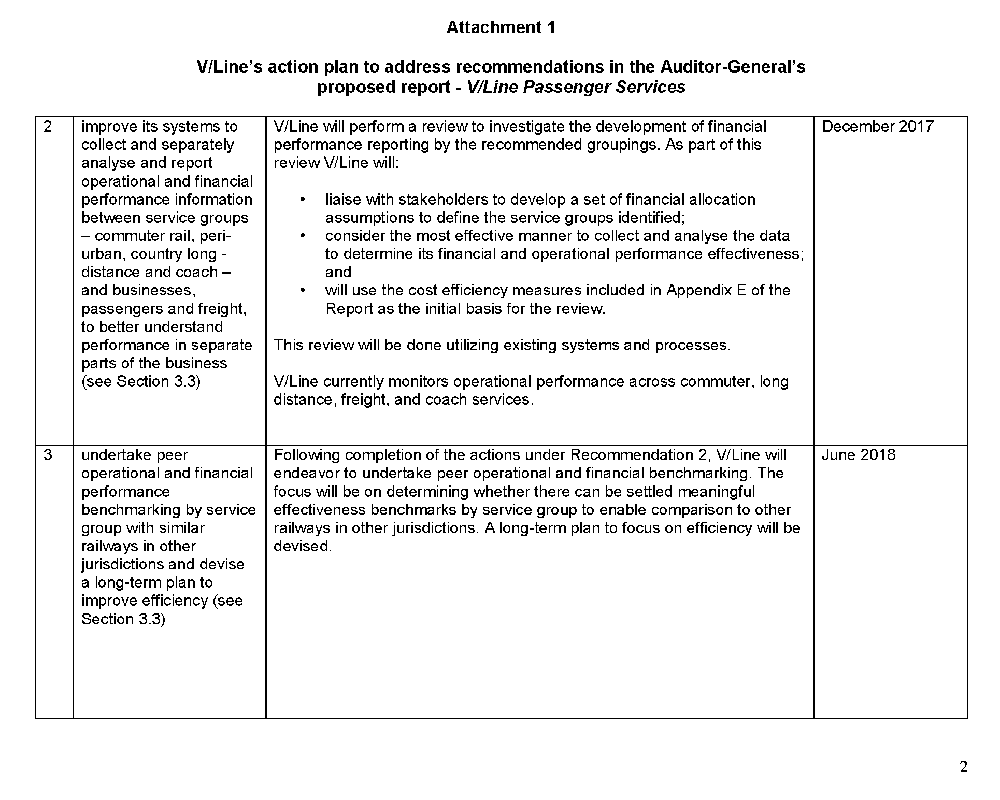
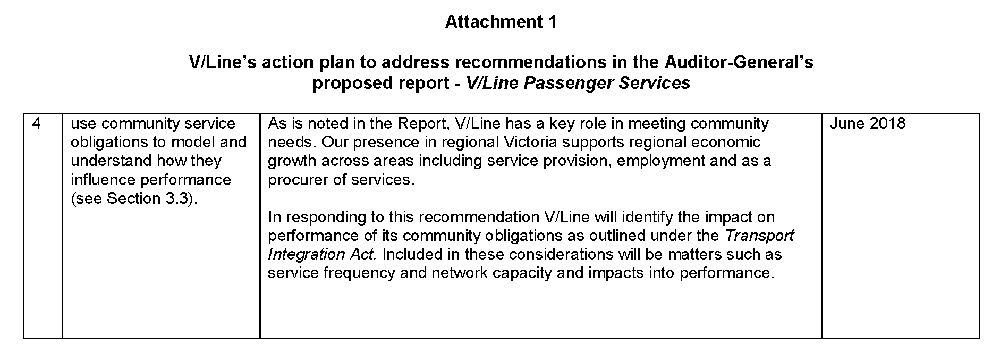
Appendix B Total performance measure by corridor
Figures B1 to B5 show the TPM results for each corridor for the period July 2013 to March 2017. See Figure 2B for the thresholds for each of these years.
Figure B1
TPM, eastern corridor, July 2013 to March 2017
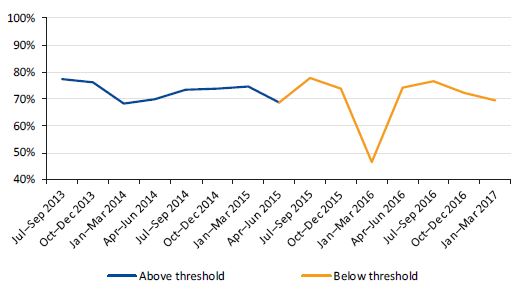
Note: The threshold progressively increases each financial year.
Source: VAGO, based on V/Line data.
Figure B2
TPM, north-eastern corridor, July 2013 to March 2017
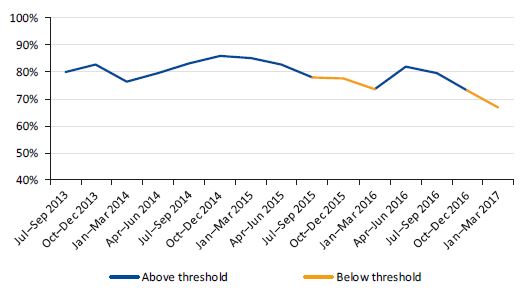
Note: The threshold progressively increases each financial year.
Source: VAGO, based on V/Line data.
Figure B3
TPM, northern corridor, July 2013 to March 2017
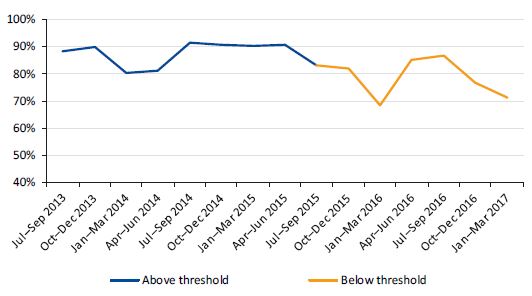
Note: The threshold progressively increases each financial year.
Source: VAGO, based on V/Line data.
Figure B4
TPM, western corridor, July 2013 to March 2017
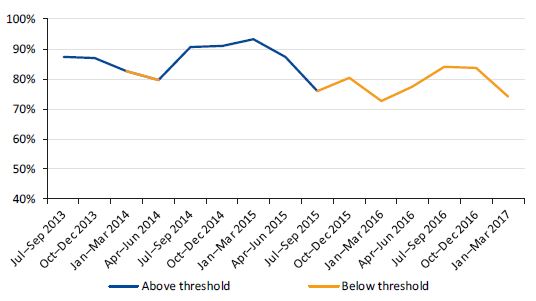
Note: The threshold progressively increases each financial year.
Source: VAGO, based on V/Line data.
Figure B5
TPM, south-western corridor, July 2013 to March 2017
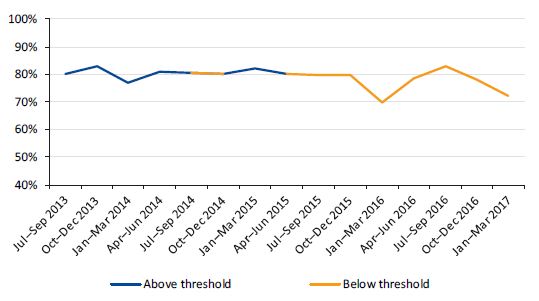
Note: The threshold progressively increases each financial year.
Source: VAGO, based on V/Line data.
Appendix C V/Line reporting requirements
V/Line must comply with reporting requirements in the services agreement with PTV and under the State Owned Enterprises Act 1992. Figure C1 sets out the reporting requirements under the services agreement.
Figure C1
V/Line reporting required by services agreement
|
Services agreement clause |
Description of reporting |
Frequency and due date |
|---|---|---|
|
5(b) |
Provision of V/Line corporate plan, business plan, board and V/Line management reports. |
Business plan annually, board reports monthly, network development partnership (NDP) report monthly |
|
8.1(a) (applies only in event of substandard service result, call-in and step-in events) |
V/Line must provide a draft management plan in the event that the V/Line performance measure for a corridor in a quarter is less than the specified threshold levels. |
As directed by PTV, within 14 days of PTV's request |
|
8.2(b)(ii) (applies only in event of substandard service result, call-in and step‑in events) |
V/Line is required to provide PTV with a comprehensive cure plan if course of action not agreed between CEOs and PTV elect to give notice to V/Line. |
As directed by PTV, plan to be submitted within 10 weekdays of notice |
|
Schedule 1—Statement of services deliverables |
||
|
1.6(a) |
V/Line must prepare and provide to PTV a draft annual system upkeep plan (SUP). |
Annually, by 31 March each year |
|
1.6(c) |
V/Line must prepare and provide to PTV a final SUP. |
Annually, by 31 May each year |
|
1.7(a) |
V/Line must have a disability support action plan lodged with Australian Human Rights Commission. |
Ongoing (term of the agreement) |
|
1.7(d) |
V/Line must provide PTV with an annual update report against the disability support action plan. |
Annually, by 30 September each year (within three months of the end of the financial year) |
|
3.2(a) |
V/Line must submit to PTV a driver training and recruitment plan for rail service. |
Annually, by 31 March each year |
|
3.5(a) |
V/Line must submit a draft strategic operations plan (SOP) to each member of the NDP (V/Line) and to PTV. |
Annually, no later than 31 October each year |
|
3.5(c) |
V/Line must submit a final SOP to NDP (V/Line) and to PTV. |
Annually, no later than 28 February each year |
|
3.7(a) |
V/Line must provide a draft version of the business plan to PTV. |
Annually, draft must be provided at least two months prior to the scheduled date of finalisation of the business plan |
|
3.8(a) |
V/Line must provide a management information report to PTV. |
Monthly, by 10 business days after the end of the calendar month |
|
3.8(c) |
The management information report that follows the release of the CSM should address CSM results. |
Quarterly, by 10 business days after the end of the calendar month |
|
4.3(a) |
V/Line must submit a draft annual rolling stock management plan (RSMP) to PTV. |
Annually, by 31 March each year |
|
4.3(c) |
V/Line must submit a final annual RSMP to PTV. |
Annually, by 30 June each year |
|
4.3(d) |
V/Line must submit an annual report to PTV. |
Annually, by July 30 each year (within 30 days of the end of the financial year) |
|
Schedule 2—Payments and variations |
||
|
2.3(a) |
PTV must notify V/Line at least five week days prior to end of each reporting period of the services payment payable. |
Monthly, end of each calendar month |
|
5.1(b) |
For each approved project, V/Line will notify PTV each month of third party payments paid and any direct labour costs incurred which could have been avoided but for the project costs with respect to the project. Each notification must be supported by a schedule of invoices. |
Monthly, required with submission of invoices to PTV |
|
6.1(a) |
V/Line must prepare a forecast for cashed in leave payments. |
Annually, by 30 April each year |
|
8.1(ii) |
The coach allowance for special event payments are subject to having a public transport plan finalised. |
Public transport plans finalised at least one month before each event |
|
Schedule 3—Key service criteria, performance measurement and step-in |
||
|
1.6(a)(iv) |
Provide PTV with electronic copies of a daily report of the arrival and departure times of each rail service at each location for which information is available for that service, including at the scheduled origin and destination of the service under the applicable timetable and at the actual origin and destination of the service to the extent these are different from the applicable timetable. |
Daily, no later than 9.00 am on the day following the day to which the report relates |
|
17(b)(ii) |
V/Line must provide monthly reports to PTV or a PTV's associate which identify all incidents and claims of any physical loss, destruction or damage to the property and matters insured under this schedule which are assessed at 50 per cent or more of the relevant insurance deductible (or such other percentage of the relevant deductible as PTV may notify V/Line). Each incident and claim must be updated in each monthly report until it has been finalised. |
Monthly |
|
Schedule 1—Network services schedule |
||
|
7.3(a) |
V/Line operator marketing plan no later than 15 week days after receiving a draft of the network services coordination plan, the franchisee must prepare and submit to PTV a draft of the V/Line operator marketing plan covering the period of the next financial year. |
Annually, by 15 April (or 14 days after receipt of draft network services coordination plan) |
|
7.3(e) |
Within 10 week days of receipt of PTV's comments (if any) under paragraph (d), the franchisee must provide to PTV for its approval a revised version of the V/Line operator marketing plan amended to incorporate any comments provided by PTV. |
Annually |
|
8.13(a) |
Coordination of complaints handling procedure—the franchisee must provide PTV with the information required by Section 5 of Part 2, in the form of Section 5 of Part 2, within 15 week days of the end of each quarter. |
Quarterly, by 15 of the month after the end of each quarter |
|
10.2(a) |
The franchisee must provide to PTV a copy of its current V/Line revenue protection plan, and details of any other current and proposed revenue protection activities and initiatives, no later than 30 September in each calendar year. |
Annually, by 30 September |
Source: VAGO, based on information from V/Line and PTV.
Figure C2 sets out the reporting requirements under the State Owned Enterprises Act 1992.
Figure C2
V/Line reporting required by the State Owned Enterprises Act 1992
|
Section of Act |
Description of reporting |
Agency that receives report |
|---|---|---|
|
41 and 42 |
V/Line's corporate plan detailing V/Line's business plans for the next five years and including:
|
|
|
55 |
Half-yearly reports—V/Line provides monthly reports. In January or February in each year or at such other time as the relevant minister approves, the board of each state business corporation must give to the relevant minister and the Treasurer a report of the operations of the corporation during the period of six months ending on the preceding 31 December and prescribed financial statements for that period. |
|
Source: VAGO, based on information from V/Line and PTV.
Appendix D Train loadings
Network train loadings
Figure D1 shows the average number of train seats occupied, during March 2017, for morning inbound and evening outbound peak services.
Figure D1
Maximum seat capacity of peak train services, March 2017
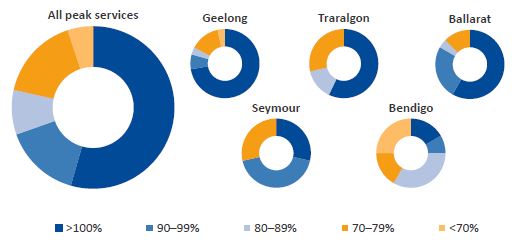
Source: VAGO, based on V/Line data.
Geelong line train load by station
Figures D2 to D3 show the average number of train seats occupied by station on the Geelong line (south-western corridor), during March 2017, for morning inbound and evening outbound peak services.
Figure D2
Average passenger loads between stations, inbound morning peak to Southern Cross Station, March 2017
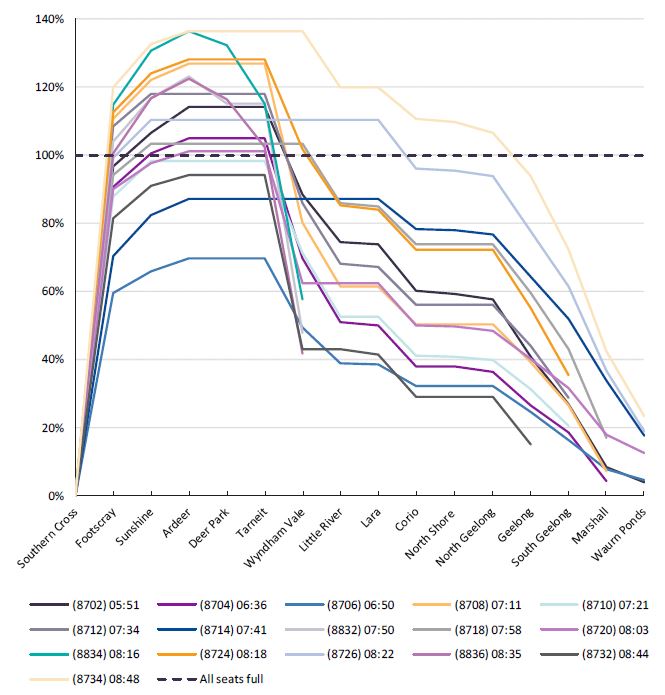
Note: 2016–17 data is from July 2016 to March 2017.
Note: Services have different stopping patterns. Services that run express between stations show the train load of the most recent stop for each of the stations bypassed. Morning peak services include all trains arriving at Southern Cross before 9 am. The train load is shown as the number of seats filled as the train departs from the station. Each line represents a train service, with the train number shown in brackets and the arrival time at Southern Cross.
Source: VAGO, based on V/Line data.
Figure D3
Average passenger loads between stations, outbound evening peak from Southern Cross Station, March 2017
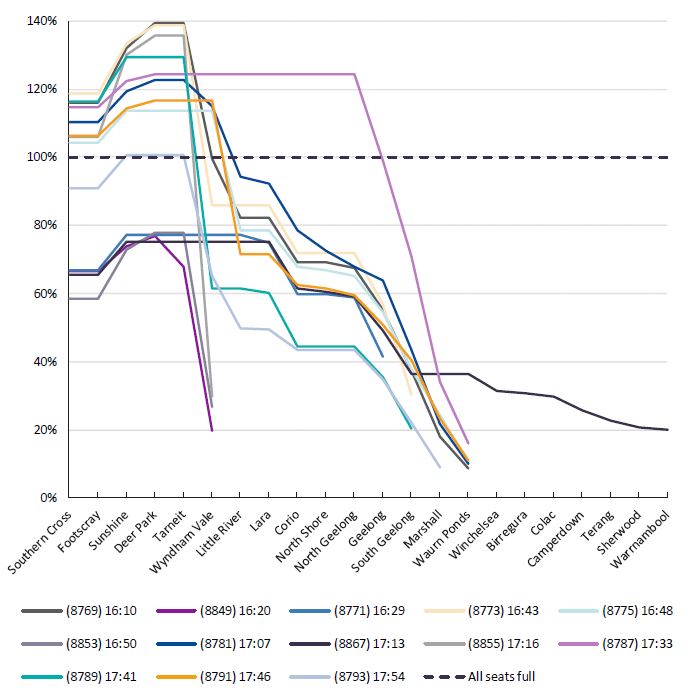
Note: 2016–17 data is July 2016 to March 2017.
Note: Services have different stopping patterns. Services that run express between stations show the train load of the most recent stop for each of the stations bypassed. Evening peak services include all trains departing from Southern Cross between 4 pm and 6 pm. Each line represents a train service, with the train number shown in brackets and the departure time from Southern Cross.
Source: VAGO, based on V/Line data.
Figures D4 and D5 provide further details of the percentage of seats occupied by station for each of these peak train services on the Geelong line for March 2017.
Figure D4
Average passenger loads between stations—inbound morning peak to Southern Cross Station, March 2017
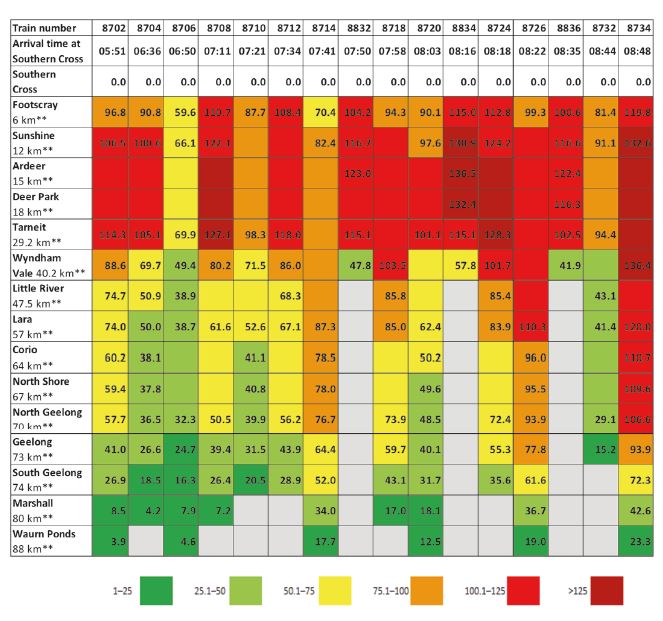
Note: ** Kilometres from Southern Cross Station.
Note: Services have different stopping patterns. Services that run express between stations show the train load of the most recent stop for each of the stations bypassed.
Source: VAGO, based on V/Line data.
Figure D5
Average passenger loads between stations—outbound evening peak from Southern Cross Station, March 2017
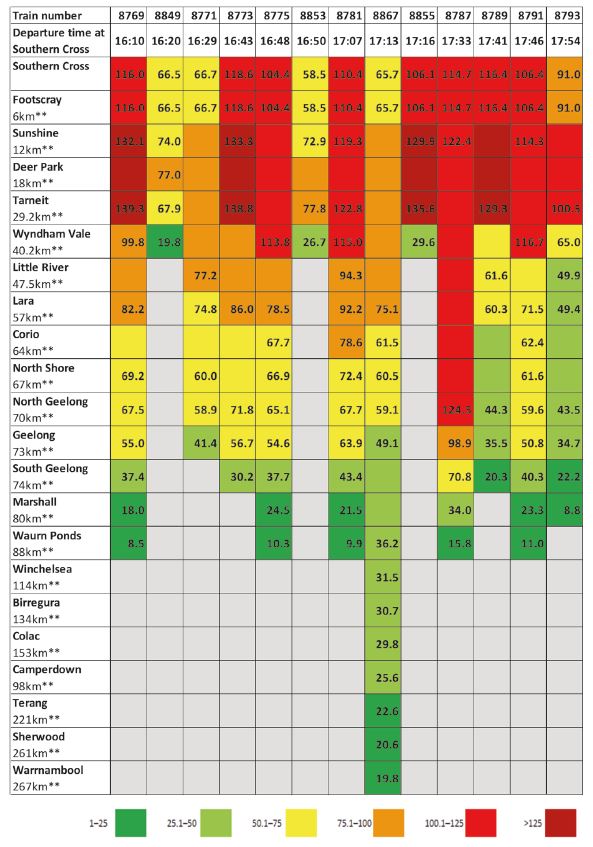
Note: ** Kilometres from Southern Cross Station.
Note: Services have different stopping patterns. Services that run express between stations show the train load of the most recent stop for each of the stations bypassed.
Source: VAGO, based on V/Line data.
Appendix E Financial performance
To assess the efficiency of V/Line passenger train services, we established a set of agreed measures in consultation with V/Line and PTV. V/Line provided data for each performance measure for the years 2012−13 to 2015−16 and forecasts for 2016−17.
Figures E1 to E14 show V/Line's relative performance on a range of measures using 2012−13 as the baseline year, with dollar figures adjusted for inflation. Figures E15 to E18 show long-term trends where data was available from the 'Should Cost' Bid to Operate V/Line Franchise Agreement report (the 2013 review).
Cost-efficiency measures
Figure E1
Operating costs per train kilometre, 2012–13 to 2016–17
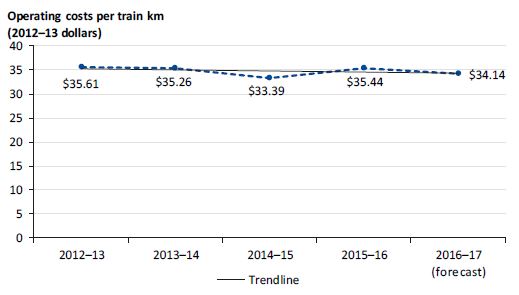
Note: 2016–17 is a V/Line forecast.
Source: VAGO, based on V/Line data.
Figure E2
Train maintenance costs per train kilometre, 2012–13 to 2016–17
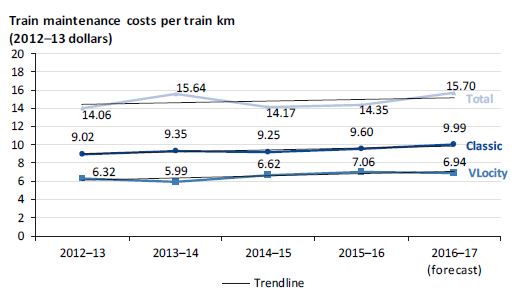
Note: 2016–17 is a V/Line forecast.
Source: VAGO, based on V/Line data.
Figure E3
Track maintenance costs per track kilometre, 2012–13 to 2016–17
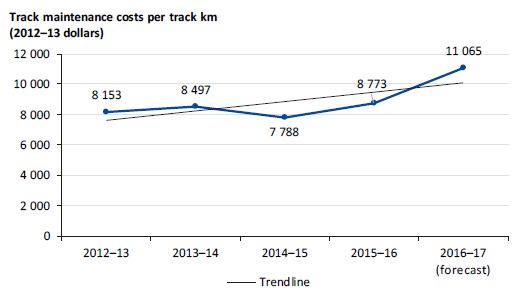
Note: 2016–17 is a V/Line forecast.
Source: VAGO, based on V/Line data.
Figure E4
Train maintenance costs per vehicle, 2012–13 to 2016–17
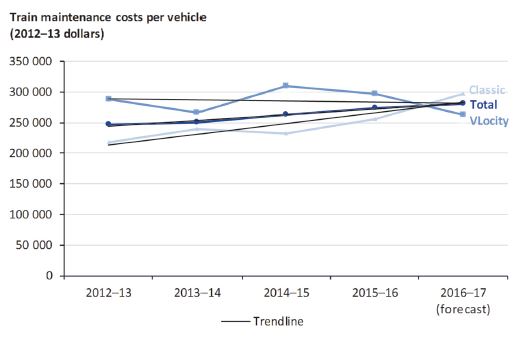
Note: 2016–17 is a V/Line forecast.
Source: VAGO, based on V/Line data.
Figure E5
Operating costs per train hour, 2012–13 to 2016–17
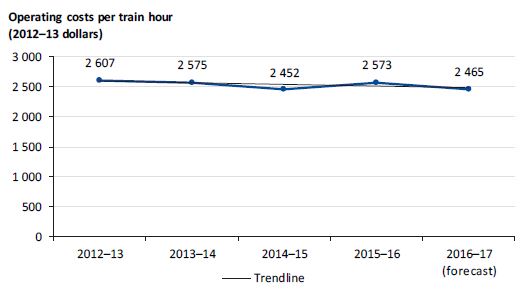
Note: 2016–17 is a V/Line forecast.
Source: VAGO, based on V/Line data.
Figure E6
Train crew costs per train hour, 2012–13 to 2016–17
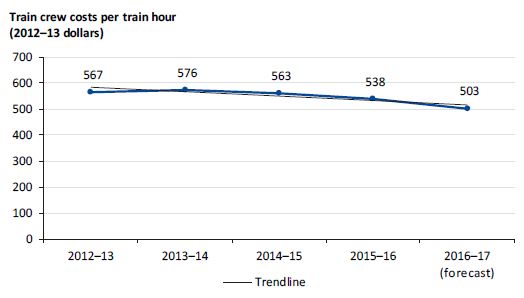
Note: 2016–17 is a V/Line forecast.
Source: VAGO, based on V/Line data.
Figure E7
Driver costs per train hour, 2012–13 to 2016–17
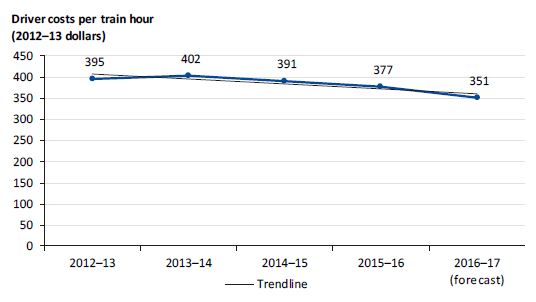
Note: 2016–17 is a V/Line forecast.
Source: VAGO, based on V/Line data.
Cost-effectiveness measures
Figures E8 to E12 show V/Line's performance on the cost-effectiveness measures.
Figure E8
Staff per million rail passengers, 2012–13 to 2016–17
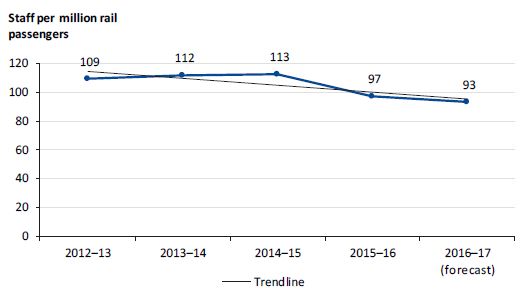
Note: 2016–17 is a V/Line forecast.
Source: VAGO, based on V/Line data.
Figure E9
Train crew costs per rail passenger, 2012–13 to 2016–17
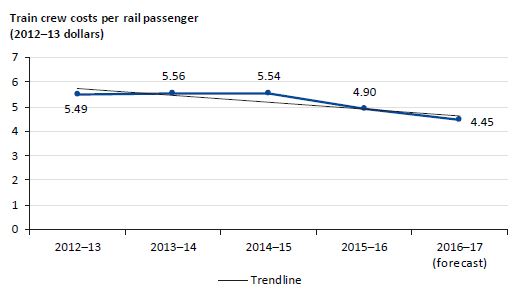
Note: 2016–17 is a V/Line forecast.
Source: VAGO, based on V/Line data.
Figure E10
Driver costs per rail passenger, 2012–13 to 2016–17
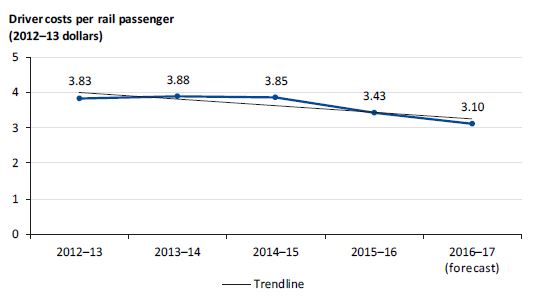
Note: 2016–17 is a V/Line forecast.
Source: VAGO, based on V/Line data.
Figure E11
Cost recovery, 2012–13 to 2016–17
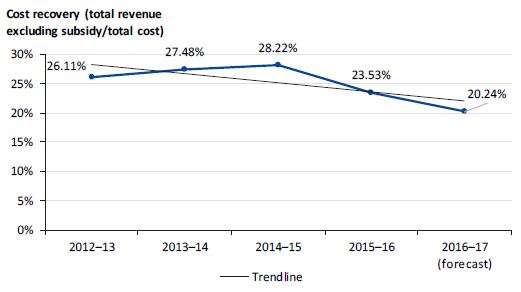
Note: 2016–17 is a V/Line forecast.
Source: VAGO, based on V/Line data.
Figure E12
Farebox revenue per rail passenger, 2012–13 to 2016–17
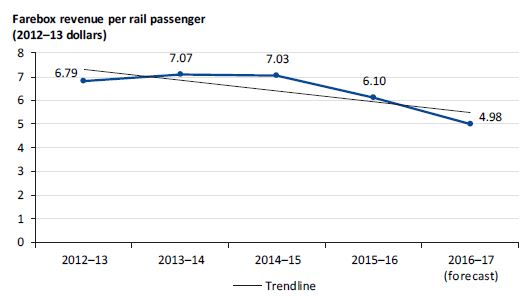
Note: 2016–17 is a V/Line forecast.
Source: VAGO, based on V/Line data.
Other efficiency measures
Figure E13
Subsidy per rail passenger, 2012–13 to 2016–17
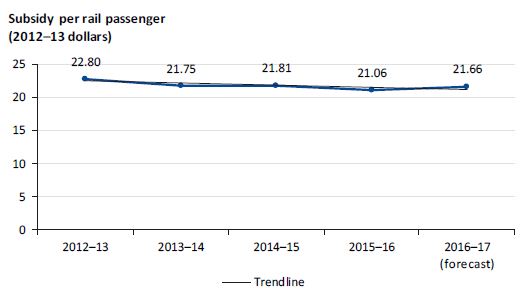
Note: 2016–17 is a V/Line forecast.
Source: VAGO, based on V/Line data.
Figure E14
Ratio of head office staff to total staff, 2012–13 to 2016–17
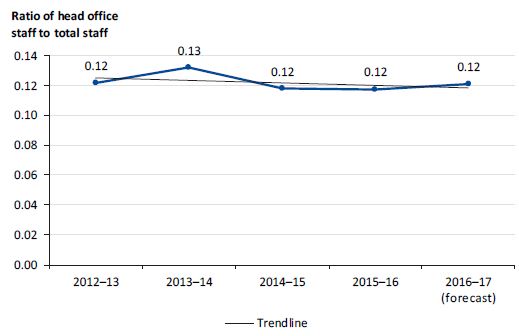
Note: 2016–17 is a V/Line forecast.
Source: VAGO, based on V/Line data.
Long-term trends
Figure E15
Total costs, 2003–04 to 2016–17
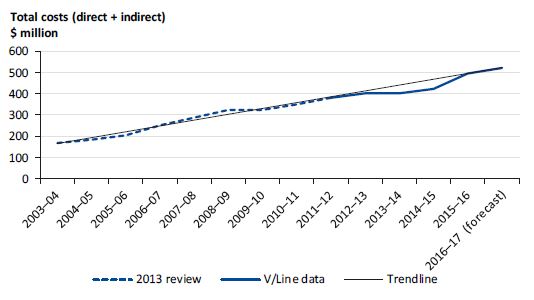
Note: 2016–17 is a V/Line forecast. Costs are nominal—not adjusted for inflation.
Source: VAGO, based on V/Line data and the 2013 review.
Figure E16
Farebox revenue, 2003–04 to 2016–17
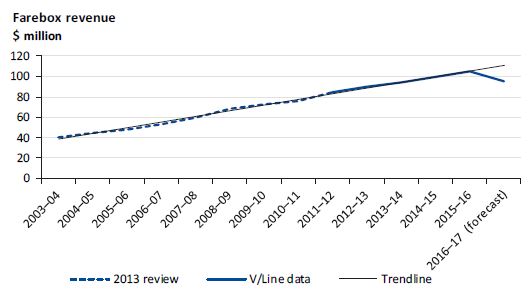
Note: 2016–17 is forecast. Revenue is nominal—actual revenue received.
Source: VAGO, based on V/Line data and the 2013 review.
Figure E17
Total maintenance costs, 2003–04 to 2016–17
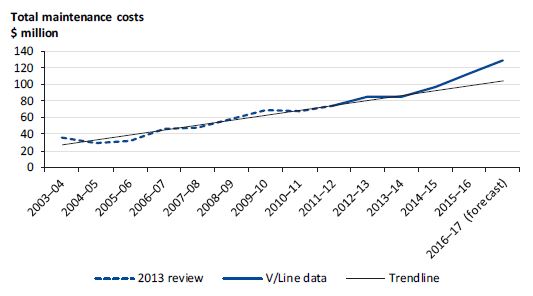
Note: 2016–17 is a V/Line forecast. Costs are nominal—not adjusted for inflation.
Source: VAGO, based on V/Line data and the 2013 review.
Figure E18
Total fleet size, 2003–04 to 2016–17
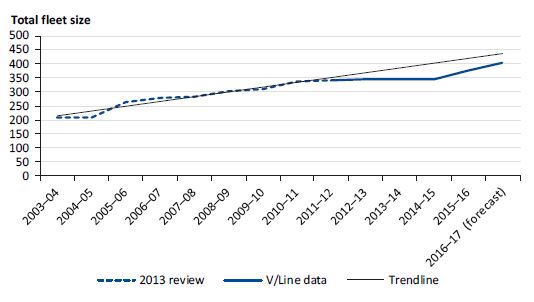
Note: 2016–17 is a V/line forecast.
Source: VAGO, based on V/Line data and the 2013 review.