Responses to Performance Engagement Recommendations: Annual Status Update 2023
Overview
What we examined
Are public sector agencies implementing our performance engagement recommendations in a timely way?
Why this review is important
Our performance engagements assess whether government agencies are effectively and efficiently meeting their objectives, using resources economically and complying with legislation.
They often identify opportunities for improvement, which are reflected in our recommendations.
There is no legislative requirement for agencies to accept, complete or report on our recommendations.
This review provides transparency to the Victorian public and parliamentarians on agencies’ responses to our performance engagement recommendations. It holds agencies accountable for addressing identified areas for improvement.
What we examined
In this report we focus on all 1,518 recommendations we made between July 2018 and June 2022.
We surveyed 64 agencies on 619 unresolved recommendations from that period.
We also surveyed 13 agencies on 38 unresolved recommendations from before July 2018. We did not include these aging recommendations in the July 2018 to June 2022 dataset, which is the focus of this report.
What we concluded
Most agencies reported that they accept and are implementing our recommendations.
For recommendations in reports we tabled between July 2018 and June 2022, agencies we examined had:
- accepted 1,469 (96.8 per cent)
- completed 1,166 (79.4 per cent) of these
- taken a median of 12 months to complete them.
There are 303 accepted recommendations (20.6 per cent) that are unresolved. Agencies should complete these recommendations to mitigate the risks we found in their respective engagements.
Video presentation
Key facts

Source: VAGO.
1. How agencies responded to our recommendations
We consulted with the audited agencies and considered their views when reaching our conclusions. The agencies’ responses are in Appendix A.
Performance engagements and recommendations
We conduct performance engagements that assess whether public sector agencies have efficient, effective, economical and compliant programs and services.
Our performance engagements may identify poor performance, which we detail in our reports. In these instances, our reports make recommendations to help agencies address the root causes.
We give agencies the opportunity to respond to recommendations before we table our reports. Agencies may state whether they accept the recommendation in full, in part, in principle or not at all. They may also state the actions they will take to address each recommendation and a target date for completion of these actions.
We conduct this review each year to ask agencies whether they have progressed in completing the recommendations.
Follow-up on outstanding recommendations
During this review, we followed up on unresolved recommendations. We asked agencies for updates on:
- their acceptance of the recommendation
- what actions they have taken in response to the recommendation
- whether the recommendation is now complete
- when they completed the recommendation or their updated target date for completion.
This section summarises the recommendation updates agencies have given us.
For full detail on specific recommendations, see Appendix G or the accompanying dashboard published on our website.
How our recommendations seek to improve public services
Addressing the root causes of poor performance
We make recommendations to public sector agencies about their programs and services. We aim to help agencies address the root causes of poor performance.
Our recommendations, like the public sector, encompass a broad range of agencies and services. We tabled 77 reports between July 2018 and June 2022 that made recommendations to 100 agencies. Government departments received the majority (54.1 per cent) of recommendations.
We identified common types of poor performance highlighted by our reports and common types of actions our recommendations suggest. To do this, we categorised our recommendations using the Committee of Sponsoring Organizations of the Treadway Commission’s (COSO) Internal Controls – Integrated Framework (COSO framework) and our own thematic framework. We detail this analysis in Section 2 of this report.
Agencies accepting and completing our recommendations
Accepted recommendations
Before tabling a report, we ask audited agencies whether they accept our recommendations. We asked agencies again as part of this review.
Of the 1,518 recommendations we made in our reports between July 2018 and June 2022, agencies initially accepted 1,462 (96.3 per cent). This has increased to 1,469 (96.8 per cent) at the time of this review. While this change is due to the significant increase in accepted recommendations tabled in 2020–21, this acceptance has decreased slightly in other years.
Figure 1: Number of recommendations accepted at time of tabling and at time of review, by tabled year
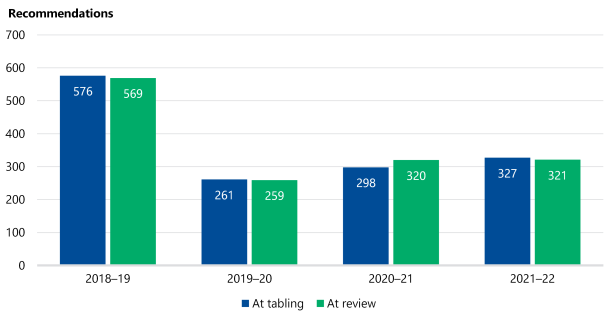
Source: VAGO.
Completion of accepted recommendations
We classify recommendations as complete when agencies attest to us that they have established processes to ensure that the recommended action is ongoing.
Agencies attested:
- they had completed 1,166 (79.4 per cent) of the 1,469 accepted recommendations
- 303 (20.6 per cent) of the 1,469 accepted recommendations were unresolved.
Figure 2: Percentage of accepted recommendations by status
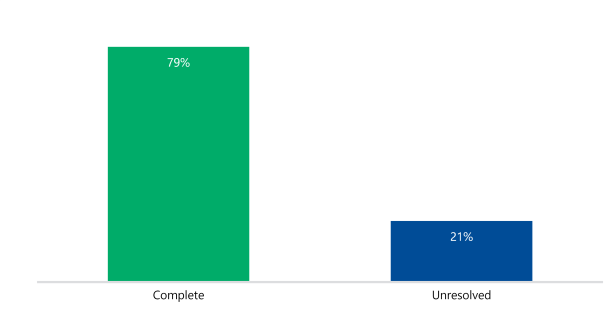
Source: VAGO.
We categorise unresolved recommendations as either ‘in progress’ or ‘not started’.
We found 300 (99 per cent) of the unresolved recommendations were in progress, while 3 (1 per cent) were not started.
Figure 3: Status of accepted recommendations by tabled year
| 2018–19 | 2019–20 | 2020–21 | 2021–22 | Total | |
|---|---|---|---|---|---|
| Complete | 504 (89%) | 239 (92%) | 219 (68%) | 204 (64%) | 1,166 (79%) |
| In progress | 65 (11%) | 20 (7.7%) | 100 (31%) | 115 (36%) | 300 (20%) |
| Not started | 0 | 0 | 1 (0.3%) | 2 (0.6%) | 3 (0.2%) |
Source: VAGO.
Completion by government departments
Between July 2018 and June 2022, 821 (54.1 per cent) of our 1,518 recommendations were to government departments. This is largely because we include them in more of our engagements.
Government departments accepted 793 (96.6 per cent) of these recommendations. They have completed 603 (76.0 per cent) of the recommendations they accepted.
Individual departments have completed between 59.7 per cent and 90.0 per cent of the recommendations they accepted.
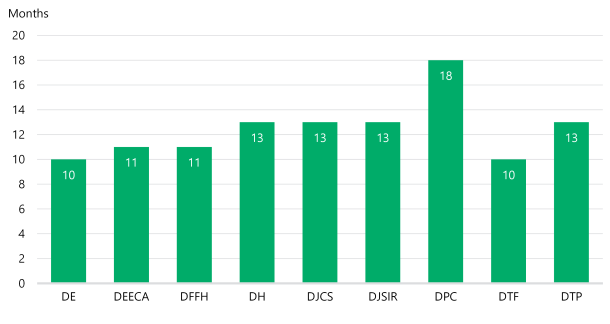
Figure 4: Status of accepted recommendations by department
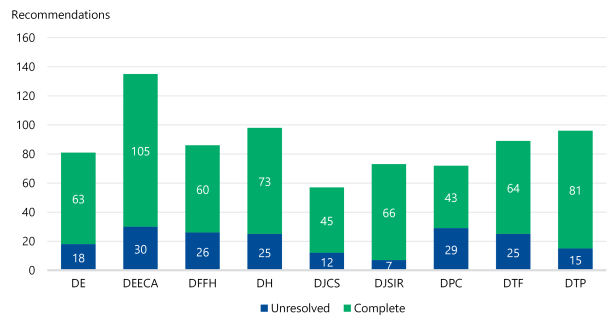
Note: The Department of Government Services (DGS), established on 1 January 2023, is excluded. Acronyms used are for the Department of Education (DE), Department of Energy, Environment and Climate Action (DEECA), Department of Families, Fairness and Housing (DFFH), Department of Health (DH), Department of Justice and Community Safety (DJCS), Department of Jobs, Skills, Industry and Regions (DJSIR), Department of Premier and Cabinet (DPC), Department of Treasury and Finance (DTF), Department of Transport and Planning (DTP).
Source: VAGO.
Time agencies take to complete our recommendations
Importance of timely completion of recommendations
Our recommendations aim to address the root causes of poor performance. When agencies complete our recommendations they help address the issues identified in our performance engagements.
While some recommendations are more complex than others, agencies should seek to complete recommendations:
- in a timely manner
- in accordance with their own target completion dates.
Agencies’ median completion times
Agencies have taken a median of 12 months to complete recommendations tabled between July 2018 and June 2022.
The time taken to complete these recommendations varied from 0 to 57 months.
Figure 5: Number of recommendations, by range of months to complete
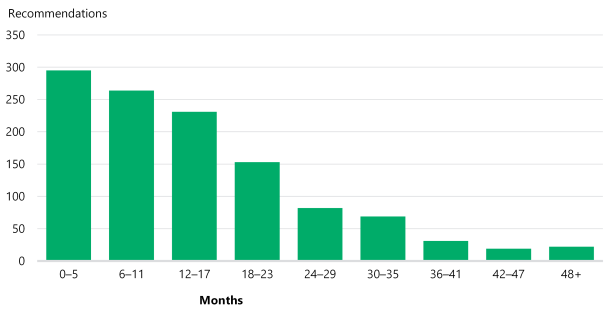
Source: VAGO.
Departments’ completion times
Government departments have taken a median of 12 months to complete their recommendations.
DPC had the longest median completion time at 18 months.
DE and the DTF had the equal shortest median completion times at 10 months.
Figure 6: Median number of months to complete a recommendation, by department
Note: DGS, established on 1 January 2023, is excluded.
Source: VAGO.
Elapsed time of unresolved recommendations
There are 303 unresolved recommendations. As of 31 December 2022, the elapsed time of unresolved recommendations was a median of 19 months.
Recommendations may remain unresolved for longer periods of time if they require agencies to make significant changes.
Analysing whether agencies meet their self-determined target completion dates may better explain their performance.
Agencies’ target completion dates
Target completion dates
Agencies may set target completion dates for recommendations before a performance engagement tables in Parliament. Agencies set initial target completion dates for 1,226 (83.5 per cent) of the 1,469 accepted recommendations that tabled between July 2018 and June 2022.
Agencies may revise their target completion date for a recommendation during our annual review.
There is no restriction on the target completion dates that agencies may set. They may also revise that date any number of times.
Initial target completion dates
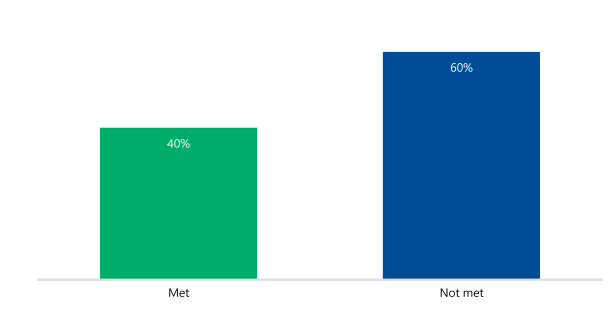
Agencies set initial target completion dates for 952 (81.6 per cent) of the 1,166 completed recommendations.
They met this initial target completion date for 380 (39.9 per cent) of their completed recommendations.
Figure 7: Percentage of completed recommendations that met their initial target completion date
Source: VAGO.
Revised target completion dates
During our annual review, we ask agencies if they have changed their target completion date for a recommendation.
Of the 1,226 accepted recommendations with an initial target completion date, agencies revised that date for 502 recommendations (40.9 per cent). Of these, 451 (89.8 per cent) were later than the original target completion date.
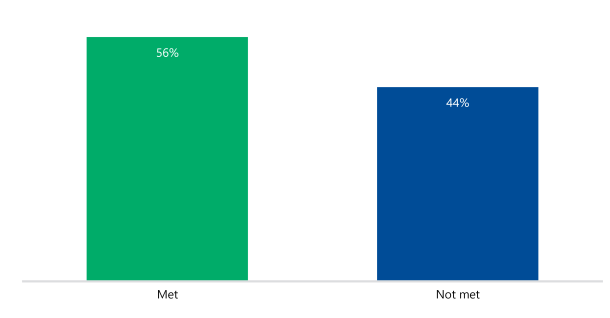
Despite revisions, agencies still did not meet their revised target completion date for 105 (44.3 per cent) of the 237 completed recommendations they delayed.
Figure 8: Percentage of completed recommendations that met their delayed target completion date
Source: VAGO.
Difference between revised and initial target completion dates
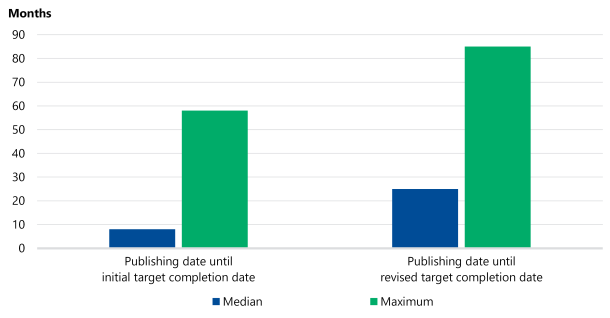
We found that revised target completion dates are a median of 17 months later than initial target completion dates.
Of the 1,226 accepted recommendations with initial target completion dates, the median target completion date was 8 months after tabling. The highest initial target completion date was 58 months after tabling.
Of the 502 accepted recommendations with revised target completion dates, the median revised target completion date was 25 months after tabling. The highest revised target completion date was 85 months after tabling.
Figure 9: Change from initial to revised target completion date
Source: VAGO.
Target completion dates of unresolved recommendations
There are currently 303 accepted but unresolved recommendations.
Agencies set initial target completion dates for 274 (90.4 per cent) of unresolved recommendations. As of 31 December 2022, these unresolved recommendations were a median of 5 months behind their initial target completion dates.
Agencies set revised target completion dates for 223 (73.6 per cent) of these unresolved recommendations. Of these, 214 (96.0 per cent) are later than their original target dates, indicating continued delays in implementing recommendations.
Unresolved recommendations from before July 2018
Updates on aging recommendations
We requested updates on 38 unresolved recommendations made before July 2018. Of these, 23 remain unresolved following this review. These relate to 10 agencies across 7 engagements.
These recommendations make up 7.1 per cent of all unresolved recommendations.
We urge the relevant agencies to resolve these recommendations. This will address the risks we found and make necessary improvements.
2. How our recommendations seek to improve public services
Our recommendations suggest what agencies should improve and the type of action required to make these improvements.
We categorised our recommendations using the COSO framework to help us understand what and how agencies should improve.
We also grouped our recommendations into themes to understand what we commonly recommend agencies should improve.
Applying the COSO framework
COSO framework categories
We used some elements of the COSO framework to group our performance engagement recommendations from July 2018 to June 2022. We assigned objectives and components to our recommendations based on the framework:
- Each recommendation’s objective indicates what internal control objective the agency should improve or achieve.
- Each recommendation’s component indicates how the recommendation suggests the agency should achieve its internal control objective.
See Appendix F for further information on how the COSO framework was applied to categorise our performance engagement recommendations.
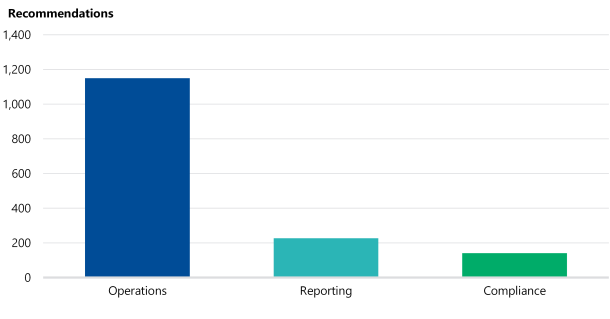
Focus on improving agency operations
The majority of our recommendations (75.8 per cent) focused on improving the efficiency and effectiveness of the operations of audited agencies.
Figure 10: Number of recommendations by COSO framework objective
Source: VAGO.
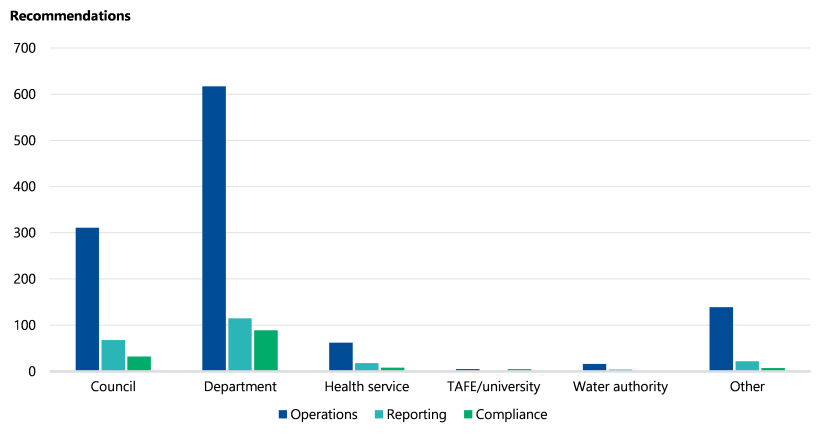
COSO objectives by types of agency
We categorised agencies by type:
- department
- council
- TAFE/university
- health service
- water authority
- other.
The most common objective category of our recommendations made to each type of agency was operations. Operations recommendations made up between 50.0 per cent and 82.7 per cent of each agency type’s recommendations.
Figure 11: Number of recommendations by COSO framework objective and agency type
Source: VAGO.
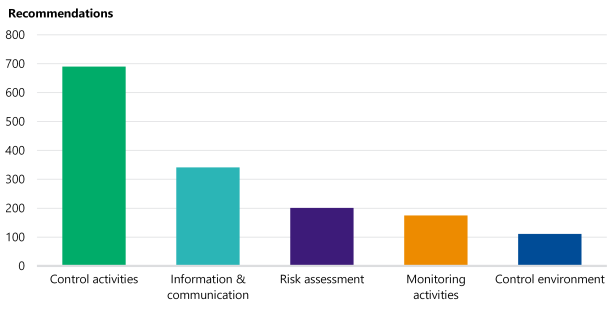
Components to achieve objectives
The COSO component assigned to our recommendations categorises how our recommendations suggest agencies should achieve their internal control objectives.
The most frequent component assigned to our recommendations was control activities. In total, 690 (45.5 per cent) of our recommendations were directed to improving controls.
The second most frequent component was information and communication: 341 (22.5 per cent) of our recommendations suggested this.
Figure 12: Number of recommendations by COSO framework component
Source: VAGO.
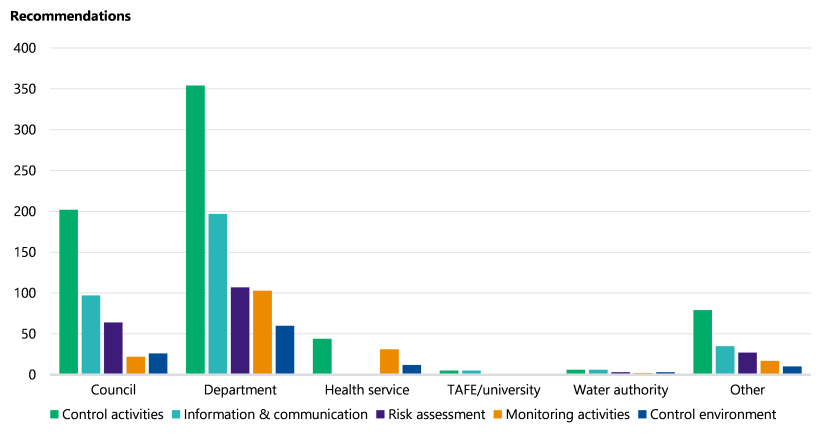
COSO components by types of agency
Control activities recommendations made up between 30.0 per cent and 49.1 per cent of each agency type’s recommendations.
Figure 13: Number of recommendations by COSO framework component and agency type
Source: VAGO.
What our recommendations suggest agencies should improve
Recommendation themes
We categorised our performance engagement recommendations into themes. These themes explain in further detail what our recommendations suggest the audited agency should implement, achieve or improve.
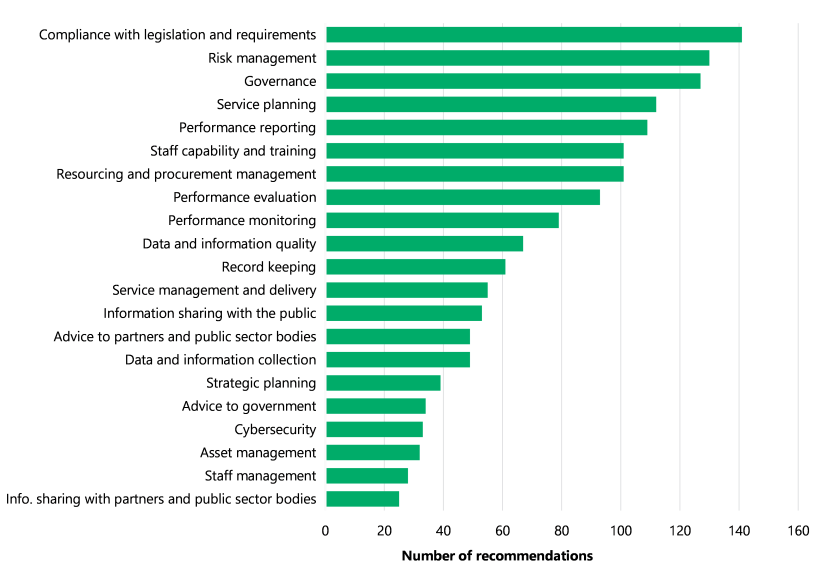
Figure 14 shows the distribution of recommendation themes for our 1,518 performance engagement recommendations.
Figure 14: Number of recommendations by theme
Source: VAGO.
Accountability themes
Many of our recommendations focused on improving agencies’ accountability. The accountability themes ‘record keeping’, ‘performance monitoring’, ‘performance evaluation’ and ‘performance reporting’ had a combined 342 recommendations (22.5 per cent).
Figure 15: Accountability recommendations

Source: VAGO.
Agencies should routinely record, monitor, evaluate and report the operation and performance of their programs and activities.
When agencies understand and appropriately report whether their activities achieved what they intended, Parliament and the public can have confidence that public money was spent effectively. Complete and prompt disclosure of information allows Parliament and the public to hold agencies to account for program delivery and outcomes where necessary.
Figure 16: Accountability themes: record keeping and performance monitoring
|
Record keeping (61 recommendations) |
Performance monitoring (79 recommendations) |
|
|---|---|---|
|
Theme description |
Recommendations that suggest agencies implement or improve their record keeping practices. |
Recommendations that suggest agencies implement or improve monitoring of their own performance. |
|
Common recommended actions |
|
|
|
Example |
Our 2022 Fraud Control Over Local Government Grants report recommended that 6 councils, ‘document all funding decisions in a consistent and structured way within a centralised system to ensure their decision making is transparent …’. Five (83.3 per cent) of these recommendations have since been completed. One recommendation is still in progress. |
Our 2020 Victoria's Homelessness Response report recommended that DFFH, ‘increase the use of existing data, including linked data, qualitative data, and potentially unstructured data, to improve performance monitoring and decision making to support service delivery’. This recommendation has since been completed. |
Source: VAGO.
Figure 17: Accountability themes: performance evaluation and performance reporting
|
Performance evaluation (93 recommendations) |
Performance reporting (109 recommendations) |
|
|---|---|---|
|
Theme description |
Recommendations that suggest agencies implement or improve their assessment of their own performance. |
Recommendations that suggest agencies implement or improve the reporting of their own performance to relevant recipients. This performance reporting may be to internal decision-makers, Parliament or the public. |
|
Common recommended actions |
|
|
|
Example |
Our 2021 Measuring and Reporting on Service Delivery report recommended that all 9 departments, ‘develop output performance measures that use unit costing to measure service efficiency’. This recommendation has since been completed by one department. Eight recommendations are in progress. |
Our 2019 Reporting on Local Government Performance report recommended that 5 councils, ‘ensure strategic indicators in their annual reports communicate the outcomes of services for the community’. These recommendations have since been completed. |
Source: VAGO.
Risk management and governance themes
The second and third most common themes of our performance engagement recommendations were ‘risk management’ and ‘governance’. These themes were in 257 recommendations (16.9 per cent).
Figure 18: Risk management and governance recommendations

Source: VAGO.
Risk management is crucial for agencies to achieve their goals. Weaknesses in risk management practices can result in risks not being identified or adequately addressed, leading to operational or compliance failures.
Similarly, governance weaknesses can create an environment where controls are not effective and maladministration can occur. The agency may then, knowingly or unknowingly, accept this maladministration, not detect it or detect it but not address it.
Figure 19: Risk management and governance themes
|
Risk management (130 recommendations) |
Governance (127 recommendations) |
|
|---|---|---|
|
Theme description |
Recommendations that suggest agencies implement or improve risk management practices. |
Recommendations that suggest agencies implement or improve governance practices. |
|
Common recommended actions |
|
|
|
Example |
Our 2022 Fraud Control Over Local Government Grants recommended to 6 local councils that they, ‘include grant-related fraud risks in their risk management and fraud and corruption plans and assign responsibility for managing these risks’. Three (50 per cent) of these recommendations have since been completed. Three recommendations are still in progress. |
Our 2019 Security of Government Buildings report recommended to 2 departments that they ‘develop a governance structure for security management, including clear accountability and adequate executive oversight’. Both of these recommendations have since been completed. |
Source: VAGO.
Compliance themes
The most common individual theme of our performance engagement recommendations was ‘compliance with legislation and requirements’. There were 141 recommendations (9.3 per cent) in this thematic category.
Figure 20: Compliance recommendations

Source: VAGO
Compliance is one of the elements regularly examined by our performance engagements. Knowing that agencies are complying with legislation, regulations and other requirements is crucial to retain public trust and legitimacy.
Failures in agency compliance may be unlawful and can expose agencies to risks of underperformance and inefficiency.
Figure 21: Compliance themes
|
Compliance with legislation and requirements (141 recommendations) |
|
|---|---|
|
Theme description |
Recommendations that suggest agencies implement or improve practices to ensure their compliance with legislation, regulations or other requirements. |
|
Common recommended actions |
|
|
Example |
Our 2022 Government Advertising report recommended to 4 departments and one agency that they ‘document risk-based processes for checking advertising campaigns’ compliance with the Public Administration Act 2004. In particular for high-risk and/or sensitive campaigns, agencies should: seek detailed and/or external legal advice [and] ensure that the agency head confirms compliance with the Public Administration Act 2004 (see Section 2.3).’ Four (80 per cent) of these recommendations have since been completed. One recommendation is still in progress. |
Source: VAGO.
Transparency and communication themes
Many of our recommendations focused on improving the information and advice agencies shared with the public and with each other. These transparency and communication themes – ‘information sharing with the public’, ‘information sharing with partners and public sector bodies’ and ‘advice to partners and public sector bodies’ – were in a combined 127 (8.4 per cent of) recommendations.
Figure 22: Transparency and communication recommendations

Source: VAGO.
Agencies gather and own information that may be of value to members of the Victorian public. Where appropriate, presenting this information publicly and in accessible formats provides value to the community and increases transparency. When an agency is transparent about information that affects the Victorian public, it builds confidence and trust in government.
When an agency shares useful information or advice with other agencies, it increases the effectiveness and efficiency of the public sector. Where appropriate, agencies with similar functions or responsibilities can benefit from sharing operational or strategic information.
Agencies with oversight of service delivery sectors, such as departments, can improve sector performance by providing models, guidelines and advice. Reducing duplication and variation in quality of the public sector’s work by improving communication can increase overall effectiveness and efficiency.
Figure 23: Transparency and communication themes
|
Information sharing with the public (53 recommendations) |
Information sharing with partners and public sector bodies (25 recommendations) |
Advice to partners and public sector bodies (49 recommendations) |
|
|---|---|---|---|
|
Theme description |
Recommendations that suggest agencies implement or improve their public communication of relevant information. |
Recommendations that suggest agencies implement or improve their communication with other agencies. |
Recommendations that suggest agencies implement or improve their advice given to other agencies. |
|
Common recommended actions |
|
|
|
|
Example |
Our 2021 report Maintaining Local Roads recommended to 5 local councils that they, ‘provide communities with detailed information on service levels for road maintenance and collect their feedback at least once every two years’. Four (80 per cent) of these recommendations have since been completed. One has been discontinued. |
Our 2018 Managing the Environmental Impacts of Domestic Wastewater report recommended to 2 water authorities that they, ‘investigate and implement a process to report to councils on the number and locations of properties connecting to sewer within agreed time frames’. Both recommendations have since been completed. |
Our 2019 Sexual Harassment in the Victorian Public Sector report recommended that the Victorian Public Sector Commission, ‘review and expand guidance for departments on reporting matters to Victoria Police’. This recommendation has since been completed. |
Source: VAGO.
Data and information quality themes
Many of our recommendations focused on improving the collection and quality of agencies’ datasets. The data themes ‘data and information collection’ and ‘data and information quality’ had a combined 116 (7.6 per cent of) recommendations.
Figure 24: Data and information recommendations

Source: VAGO.
Agencies use data to support their strategic planning, decision-making and assessment of outcomes. It is therefore critical that datasets used by agencies are meaningful and reliable.
To achieve meaningful and reliable datasets, agencies require data collection and quality assurance practices that are systematic and effectively controlled.
Figure 25: Data and information themes
|
Data and information collection (49 recommendations) |
Data and information quality (67 recommendations) |
|
|---|---|---|
|
Theme description |
Recommendations that suggest agencies implement or improve their data collection practices. |
Recommendations that suggest agencies implement or improve processes that ensure their datasets are useful and reliable. |
|
Common recommended actions |
|
|
|
Example |
Our 2019 Follow up of Access to Public Dental Services in Victoria report recommended that one department and one health service, ‘collect data on people who are eligible for public dental services as a subset of its broader oral health outcomes measures based on the whole population’. These recommendations have since been completed. |
Our 2022 Offsetting Native Vegetation Loss on Private Land report recommended that DEECA, ‘develop and implement a data management protocol to ensure the currency and completeness of its native vegetation tools and datasets …’. This recommendation is in progress. |
Source: VAGO.
Appendix A: Submissions and comments
Download a PDF copy of Appendix A: Submissions and comments.

Appendix B: Abbreviations, acronyms and glossary
Download a PDF copy of Appendix B: Acronyms, abbreviations and glossary.
Appendix C: Scope of this review
Appendix D: Engagements and agencies in this review
Download a PDF copy of Appendix D: Engagements and agencies in this review.
Download Appendix D: Engagements and agencies in this review
Appendix E. Between-year trends of departmental completion times
Click the link below to download a PDF copy of Appendix E. Between-year trends of departmental completion times.
Click here to download Appendix E. Between-year trends of departmental completion times
Appendix F: The Committee of Sponsoring Organizations of the Treadway Commission’s Internal Control – Integrated Framework (COSO framework)
Download a PDF copy of Appendix F: The Committee of Sponsoring Organizations of the Treadway Commission’s Internal Control – Integrated Framework (COSO framework).
Appendix G: Agency responses to assurance review
Download a PDF copy of Appendix G: Agency responses to assurance review.