Local Government: Results of the 2011–12 Audits
Overview
This report covers the results of our financial audits of 103 entities within the local government sector, consisting 79 councils, 11 regional library corporations and 13 companies, trusts and joint ventures. It informs Parliament about significant issues arising from the audits of financial, standard and performance statements for 2011–12, and augments the assurance provided through audit opinions included in the entities’ annual reports.
This report comments on the quality and timeliness of financial reporting, the financial sustainability of councils, general internal controls, controls over budget management and development and outsourcing activities of councils.
Local Government: Results of the 2011–12 Audits: Message
Ordered to be printed
VICTORIAN GOVERNMENT PRINTER November 2012
PP No 199, Session 2010–12
President
Legislative Council
Parliament House
Melbourne
Speaker
Legislative Assembly
Parliament House
Melbourne
Dear Presiding Officers
Under the provisions of section 16AB of the Audit Act 1994, I transmit my report on Local Government: Results of the 2011–12 Audits.
Yours faithfully

D D R PEARSON
Auditor-General
28 November 2012
Audit summary
This report presents the results of our financial audits of 103 entities within the local government sector comprising 79 councils, 11 regional library corporations (RLCs) and 13 associated entities. It provides a detailed analysis of council financial reporting, performance reporting, financial results, financial sustainability and internal controls. It informs Parliament about significant issues arising from the audits and complements the assurance provided through individual audit opinions included in the entities’ annual reports.
Clear audit opinions were issued on all financial reports and 90 standard statements. An ‘emphasis of matter’ paragraph was included for one entity due to the financial statements being prepared on a liquidation basis.
Clear audit opinions were issued on 79 performance statements for the year.
Conclusion
Notwithstanding some areas for improvement, Parliament can have confidence in the adequacy of financial and performance reporting and the internal controls of the entities audited.
Financial results and sustainability
The combined operating results for councils deteriorated from a surplus of $1.11 billion in 2010–11 to $1.03 billion in 2011–12. An increase of $672 million in revenue (9 per cent) was offset by an increase of $752 million (12 per cent) in expenses, mainly driven by an increase in employee benefits arising from a $367 million funding call on the local government defined benefit superannuation plan.
The combined operating results of RLCs have also deteriorated from a surplus of $2.16 million in 2010–11 to a deficit of $3.06 million in 2011–12. They continue to rely heavily on council contributions to fund their operations, which represented 80 per cent of revenue. Without this funding, RLCs cannot generate sufficient funds to meet their financial obligations.
Of 79 councils, 73 had a low financial sustainability risk, five had a medium risk, and one was high risk.
All councils’ results were impacted by the early receipt of two quarterly instalments of grant funding from the Victorian Grants Commission and a funding call made on local government to address a shortfall in the defined benefit superannuation fund.
Internal controls
Overall, councils, RLCs and associated entities’ internal controls were adequate for producing reliable, accurate and timely financial reports. Nevertheless, a number of common areas for improvement were identified. Councils, RLCs and associated entities require adequate internal controls for financial reporting purposes to assist with the efficiency and effectiveness of their operations and to comply with relevant laws and regulations. As part of our annual assessment of internal controls we focused on controls for budget development and management and outsourcing activities.
Budgets of all councils were aligned with the four-year term of the elected council and the council’s four-year strategic objectives. However, 92 per cent of councils did not acquit actual performance against the budget or the strategic objectives set and 47 per cent did not have longer-term budgets beyond 10 years.
Seventy-seven per cent of councils did not demonstrate links between their operational and capital budgets, and minimal consideration was given to asset depreciation or the ageing of existing assets in order to achieve an appropriate balance between maintaining older assets and investing in new assets.
Recommendations
- That councils should further refine their financial reporting processes by strengthening the review and assurance procedures over the accuracy of data needed for financial report preparation.
- That the Department of Planning and Community Development should continue its work in developing regulations that establish the minimum standards for the form and content of performance statements.
- critically review their strategic and service objectives so that they are clearly expressed, aligned and measurable
- critically review the performance information in their annual reports so that it is relevant, balanced, appropriate and clearly aligned with their objectives
- develop budget management policies and procedures to encourage consistency of practice
- prepare and align financial and strategic budgets beyond the elected council’s four-year term to inform delivery of longer-term outcomes, and consideration of timely asset replacement
- periodically review and acquit actual performance against the council’s budget and strategic objectives to inform budget management decisions and avoidance of overruns
- review the link and impact between their operational and capital works needs when preparing the budget so that sufficient provisions are made for maintenance and renewal of assets
- obtain independent assessments of the assumptions underpinning budgets to improve the soundness of budgeting outcomes and practices
- provide a reporting mechanism for councillors to regularly monitor actual council performance against set budget
- develop and maintain outsourcing policies and procedures that:
- mandate the preparation of robust business cases and require rigorous assessments of procurement options including outsourcing or insourcing any service
- mandate assessment of the alignment of outsourced arrangement with Best Value Principles
- address reporting disclosure matters
- develop formulated and tested contingencies for delivery of critical outsourced services in the event of provider failure
- identify and register risks inherent in outsourcing and develop mitigation strategies and monitor progress in managing those risks.
Submissions and comments received
In addition to progressive engagement during the course of the audit, in accordance with section 16(3) of the Audit Act 1994 relevant extracts from the report were provided to all councils and the Department of Planning and Community Development with a request for submissions or comments.
Agency views have been considered in reaching our audit conclusions and are represented to the extent relevant and warranted in preparing this report. Their full section 16(3) submissions and comments however, are included in Appendix G.
1 Background
1.1 Introduction
The Victorian local government sector consists of 103 entities, comprising 79 local councils, 11 regional library corporations and 13 associated entities. Local governments are recognised in Victoria’s constitution as the third tier of government. While administered under the Local Government Act 1989 (the Act), each council operates autonomously and is directly accountable to its constituency.
Councils are governed by democratically elected councillors and their operations are administered by the council-appointed chief executive officer.
This report includes the results of the financial audits of the 103 entities as set out in Figure 1A. The 103 entities are named in Appendix A of this report.
Figure 1A
Local government reporting entities
Type of entity |
2011 |
2012 |
|---|---|---|
Councils |
79 |
79 |
Companies, trusts and joint ventures |
14 |
13 |
Regional library corporations |
12 |
11 |
Total |
105 |
103 |
Source: Victorian Auditor-General’s Office.
The number of entities subject to audit in 2011–12 decreased following the cessation of the Central Highlands Regional Library Corporation and changes in the structure of the Manningham Centre Association which meant that it is no longer a controlled entity of Manningham City Council. The report informs Parliament about significant issues arising from the financial audits within the sector and adds to the assurance provided through audit opinions on financial, standard and performance statements included in the respective entities’ annual reports.
The report comments on the financial sustainability of the entities, their general internal controls, their controls over budget development and management and outsourcing activities of councils.
The other VAGO reports on the results of our 2011–12 financial audits are outlined in Appendix B.
1.1.1 Audit of financial reports
An annual financial audit has two aims:
- to give an opinion consistent with section 9 of the Audit Act 1994, on whether the financial statements are fairly stated
- to consider whether there has been wastage of public resources or a lack of probity or financial prudence in the management or application of public resources, consistent with section 3A (2) of the Audit Act 1994.
The financial audit framework applied in the conduct of the 2012 audits of the sector is set out in Appendix C.
1.1.2 Audit of performance reports
Section 132 of the Local Government Act 1989 (the Act) requires councils to prepare performance statements annually, and section 133 states that the auditor must prepare a report to the Minister for Local Government.
1.1.3 Audit of internal controls
An entity’s governing body is responsible for developing and maintaining its internal control framework. Internal controls are systems, policies and procedures that help an entity to reliably and cost-effectively meet its objectives. Sound internal controls enable delivery of reliable, accurate and timely external and internal reporting. The main components of an effective internal control framework and an explanation of the framework are set out in Appendix C.
The annual financial audit enables the Auditor-General to form an opinion on an entity’s financial report. An integral part of this process, and a requirement of Australian Auditing Standard 315 Identifying and Assessing the Risks of Material Misstatement through Understanding the Entity and Its Environment, is to assess the adequacy of an entity’s internal control framework and governance processes related to its financial reporting.
Internal control weaknesses we identify during an audit do not usually result in a ‘qualified’ audit opinion. A qualification is warranted only if weaknesses cause significant uncertainty about the accuracy, completeness and reliability of the financial information being reported. Often, an entity will have compensating controls that mitigate the risk of a material error in the financial report.
Weaknesses we find during an audit are brought to the attention of an entity’s mayor or chairperson, chief executive officer and audit committee by way of a management letter.
Section 16 of the Audit Act 1994 empowers the Auditor-General to report to Parliament on the results of audits. This report includes the results of our review of internal controls related to the financial reporting responsibilities of the local government sector.
1.2 Audit conduct
The audits of 79 councils, the 13 entities they control and 11 regional library corporations were undertaken in accordance with Australian Auditing Standards.
The cost of preparing and printing this report was $195 000.
1.3 Structure of this report
The structure of this report is set out in Figure 1B.
Figure 1B
Report structure
Part |
Description |
|---|---|
Part 2: Financial reporting |
Outlines the financial reporting framework and covers the results of the audits of the 2011–12:
This Part comments on the quality of financial reporting against better practice and timeliness against legislated time lines. |
Part 3: Performance reporting |
Covers the results of the audits of the performance statements of 79 councils for 2011–12. This Part also comments on developments in performance reporting in the sector over the past year. |
Part 4: Financial results |
Illustrates and analyses the financial results of the 79 councils and 11 regional library corporations including financial performance for 2011–12. |
Part 5: Financial sustainability |
Provides insight into the financial sustainability of 79 councils obtained from analysing the trends in six financial sustainability indicators over a five-year period. |
Part 6: Internal controls |
Assesses the general internal controls and controls over the focus areas of budget development and management and outsourcing activities of councils. |
Source: Victorian Auditor-General’s Office.
2 Financial reporting
At a glance
Background
Independent audit opinions add credibility to financial reports by providing reasonable assurance that the information reported is reliable. The quality of an entity’s reporting can be measured by the timeliness and accuracy of the preparation of the reports. This Part covers the results of the 2011–12 audits of the 79 local councils, 11 regional library corporations and 13 associated entities. It also compares financial reporting practices in 2011–12 against better practice.
Conclusion
Parliament can have confidence in the financial reports, as all 103 completed audits were given clear audit opinions.
Overall, the financial report preparation processes of local councils, regional library corporations and associated entities were adequate. They produced accurate, complete and reliable information. However, opportunities for improvement have been identified.
Findings
- Clear audit opinions were issued on the 103 financial reports.
-
Two entities did not meet the legislated time
frame of 30 September 2012:
- Buloke Shire Council’s audit opinion was issued on 2 October 2012.
- Central Goldfields Shire Council’s audit opinion was issued on 23 October 2012.
- Financial reporting accuracy would improve if a robust assurance procedure was overlaid on infrastructure valuations before acceptance.
- Sixty-nine clear acquittal audit opinions were issued.
Recommendation
That councils should further refine their financial reporting processes by strengthening the review and assurance procedures over the accuracy of data needed for financial report preparation.
2.1 Introduction
This Part covers the results of the financial statement audits of the 103 entities in the local government sector with 30 June 2012 balance dates.
2.2 Financial reporting framework
The principal legislation governing the financial reporting of councils and regional library corporations (RLCs) is the Local Government Act 1989 (the Act).
Figure 2A outlines the financial reporting requirements for local government entities.
Figure 2A
Local government sector financial reporting requirements
Statement |
Details |
Councils |
RLCs |
Other |
|---|---|---|---|---|
General purpose |
General purpose financial statements prepared in accordance with Australian Accounting Standards. The statements are the:
|
Yes |
Yes |
Yes |
Special purpose (Standard) |
Statements based upon the above:
with additional information comprising the original approved budget and the difference between actual and budget. A standard statement of capital works setting out actual against planned capital expenditure. Supporting narrative explaining any material variances between actual results and budget. |
Yes |
Yes |
N/A |
Note: N/A = not applicable.
Source: Victorian Auditor-General’s Office.
Under the Act, councils and RLCs must prepare annual general purpose and standard financial statements and submit them for audit.
Financial statements must be prepared in accordance with Australian Accounting Standards including the Australian Accounting Interpretations.
Councils and RLCs must submit their annual reports to the Minister for Local Government by 30 September each year.
Councils are also required to prepare performance statements and have them audited. The results of our audit of performance statements are presented in Part 3 of this report.
2.3 Audit opinions issued
Independent audit opinions add credibility to financial reports by providing reasonable assurance that the information reported is reliable and accurate. A clear audit opinion confirms that the financial statements present fairly the transactions and balances for the reporting period, in accordance with the requirements of relevant accounting standards and legislation.
A qualified audit opinion means that the financial report is materially different to the requirements of the relevant reporting framework or accounting standards, and is less reliable and useful as an accountability document.
In certain circumstances an audit opinion may draw attention to, or emphasise, a matter relevant to the users of an entity’s financial report but does not warrant a qualification. Unmodified opinions can include an ‘emphasis of matter’ paragraph.
2.3.1 General purpose financial statements
By the statutory date of 30 September 2012, 101 clear opinions had been issued on the general purpose financial statements for 2011–12. Two further clear opinions were issued on 2 October 2012 and 23 October 2012, bringing the number of opinions to 103 for 2011–12 (103 clear and one qualified in 2010–11).
Figure 2B shows the entity that received an emphasis of matter opinion on the financial statements as at 30 September 2012 (two in 2010–11) and the reason that emphasis was given.
Figure 2B
Emphasis of matter audit opinions issued for 2011–12
Entity |
Status |
Reason |
|---|---|---|
Melbourne Wholesale Fish Market |
Ongoing |
The financial statements were prepared on a liquidation basis due to the cessation of operations. As at 30 June 2012 the entity was in the process of being wound up. |
Source: Victorian Auditor-General’s Office.
2.3.2 Standard financial statements
By the statutory date of 30 September 2012, 88 clear audit opinions with an emphasis of matter were issued on the standard financial statements of councils and RLCs. Two clear opinions were subsequently issued, bringing the number of opinions to 90 for 2011–12 (91 clear in 2010–11).
Councils and RLCs are required to prepare standard statements under section 131 of the Act. These statements are ‘special purpose financial reports’, which report actual expenditure against budget for the financial year.
Under Australian Auditing Standard ASA 706 Emphasis of Matter Paragraphs and Other Matter Paragraphs in the Independent Auditor’s Report, applicable from January 2010, an emphasis of matter audit opinion is required for all special purpose financial reports.
2.3.3 Grant acquittal opinions
The Act sets out the statutory reporting obligations of councils to the Victorian community. From time to time, councils are required to report to other parties on the use of specific grants received. For example, conditions of grant funding from the Commonwealth Government may specify additional reporting requirements such as acquittal reporting.
An acquittal report generally consists of an income and expenditure statement based on a prescribed template provided by the funding body. Audits of grant funding are usually a requirement of the conditions of a grant and a prerequisite for continued funding.
A grant acquittal audit provides assurance to the funding body that grant conditions have been met, and that grant expenditure was incurred in accordance with the grant agreement, including any special conditions and payment requirements. Grant acquittal audits are conducted in accordance with the Australian Auditing Standards and the requirements of the relevant grant agreement or grant conditions.
In 2011–12 we issued 69 grant acquittal opinions, all of which related to the Nation Building Program managed by the Commonwealth Government’s Department of Infrastructure and Transport. A list of the acquittals issued during the year, and the years to which they relate, is included in Appendix D of this report.
2.4 Quality of reporting
The quality of an entity’s financial reporting can be measured by the accuracy and timeliness of the preparation and finalisation of its financial report. Overall, the financial report preparation processes of councils and RLCs produced accurate, complete and reliable information. There has been an overall improvement in all key areas that form a better practice framework.
The framework applied in assessing the quality of reporting is detailed in Appendix C.
2.4.1 Timeliness
Recognising the importance of financial reports in providing accountability for the use of public monies, entities should prepare and publish their reports on a timely basis. The later the reports are produced and published after year end, the less useful they are for stakeholders and for informing decision-making.
The legislated time frame for councils, RLCs and related entities to finalise their audited financial reports and submit them to the Minister for Local Government is 30 September in each year.
In 2011–12, 101 of 103 entities (98 per cent) met the time frame compared to 97 per cent in 2010–11. Figure 2C shows the entities that missed the time line and why.
Figure 2C
Entities that missed the statutory reporting time line, 2011–12
Entity |
Reason |
|---|---|
Buloke Shire Council |
The financial reports were not signed and audit opinion was not issued as at 30 September 2012. Council signed on 1 October 2012. The audit opinion was issued on 2 October 2012. |
Central Goldfields Shire Council |
The financial reports were not signed and audit opinion was not issued as at 30 September 2012. Council signed on 18 October 2012. The audit opinion was issued on 23 October 2012. |
Source: Victorian Auditor-General’s Office.
2.4.2 Accuracy
The frequency and size of errors requiring adjustment are direct measures of the quality of the draft financial statements. Ideally, there should be no errors or adjustments required as a result of audit.
When our staff detect errors in the draft financial statements they are raised with management. Material errors need to be corrected before a clear audit opinion can be issued. The entity itself may also change its draft financial statements after submitting them to audit, if their quality assurance procedures identify that reported information is incorrect or incomplete.
There was an increase in the number of material adjustments from 43 in 2010–11 to 61 in 2011–12. Large and small shire councils accounted for 49 per cent (58 per cent in 2010–11) of the material adjustments. The number of adjustments to disclosure improved, reducing from 41 last year to 22 in 2011–12. Regional and large shire councils accounted for 77 per cent of adjustments to disclosure (78 per cent in 2010–11).
Material adjustments resulted in an increase of $38.8 million to asset balances and an increase of $68.0 million in equity. The major issue leading to adjustment during the 2011–12 audits related to accounting for asset valuations. This was also identified as an issue in 2010–11.
Adjustments were required to correct errors due to:
- incorrect valuations of infrastructure assets processed by councils based on underlying data that lacked quality
- inadequate quality assurance over the reasonableness of asset revaluation data.
Recommendation
- That councils should further refine their financial reporting processes by strengthening the review and assurance procedures over the accuracy of data needed for financial report preparation.
3 Performance reporting
At a glance
Background
All councils are required to report their actual performance against measures and targets associated with the key strategic activities (KSA) set out in their four-year council plans. This requirement was introduced into the Local Government Act 1989 in 2003.
This Part details work underway to influence the development of indicators included in performance reports and reiterates our intention to further develop our audit of the performance reports in future periods.
Conclusion
Parliament can have confidence in the fair presentation of all performance reports that received clear audit opinions for 2011–12. However the relevance and appropriateness of performance report is not assured. The Department of Planning and Community Development (DPCD) has however committed to implementation of a reliable performance reporting framework within two years.
Findings
- Councils have some way to go in preparing performance reports that are sufficient to satisfy the information needs of local residents and ratepayers.
- DPCD has commenced work in developing a compulsory performance reporting framework for the sector on relevance and appropriateness.
Recommendations
- That the Department of Planning and Community Development should continue its work in developing regulations that establish the minimum standards for the form and content of performance statements.
- That councils should:
- critically review their strategic and service objectives so that they are clearly expressed, aligned and measurable
- critically review the performance information in their annual reports for relevance, balance, appropriateness and clear alignment with their objectives.
3.1 Introduction
The Audit Act 1994 empowers the Auditor-General to audit any performance indicators in the report of operations of an audited entity to determine whether they:
- are relevant to any stated objectives of the entity
- are appropriate for the assessment of the entity’s actual performance
- fairly represent the entity’s actual performance.
The annual attest audit on the performance reports of local councils currently expresses an opinion as to whether the actual results reported present fairly and have been prepared in accordance with section 132 of the Local Government Act 1989 (the Act). However, currently an opinion is not expressed on the relevance or appropriateness of the performance information as they generally fail key tests of usefulness.
This Part details the work underway on the development of a performance reporting framework for councils and reiterates our intention to extend our audit of the performance reports in the future.
3.2 Performance reporting by councils
Councils are required to prepare performance statements under section 132 of the Act and to report annually on their performance against the measures and targets related to the key strategic activities (KSAs) established in their financial budgets.
3.3 Audit opinions issued
By the statutory date of 30 September 2012, 77 clear audit opinions had been issued on council performance statements for 2011–12 (77 clear, two qualified in 2010–11).
Clear opinions were issued for Buloke Shire Council and Central Goldfields Shire Council on 2 October 2012 and 23 October 2012 respectively.
3.4 Performance reporting developments
When performance reporting for the sector was being established, VAGO focused on auditing whether the reports fairly presented performance and complied with the legislative requirements. However, our report Local Government: Results of the 2010–11 Audits (2011–12:14) indicated our intention for the Auditor‑General, consistent with his audit mandate, to express an opinion on the relevance and appropriateness of council’s performance indicators.
In April 2012 we tabled a report Performance Reporting by Local Government (2011–12:27), which assessed the effectiveness of local government performance reporting arrangements and the adequacy of statewide initiatives to reform local government performance reporting. The report recommended a framework that provides a holistic picture of financial and non-financial performance that is outcome focused, based on established models, and capable of implementation without unnecessarily increasing the reporting burden on local government.
The framework was based on the Report on Government Services (RoGS), produced by the Productivity Commission Secretariat for the Steering Committee for the Review of Government Services, as it is a mature model that demonstrates the feasibility of reporting common benchmarks and metrics across disparate jurisdictions. The model offers an opportunity to expedite addressing the longstanding challenge of performance reporting in the sector by building on an authoritative and established approach.
RoGS provides a blueprint for developing indicators that is consistent with our 2008 report Performance Reporting by Local Government (2007–08:27). However, the necessary indicators—including data sets and quality assurance arrangements—are not yet in place at councils, and considerable work remains to address these gaps, which impair accountability for performance and represent major obstacles to effectively address recurring performance deficiencies at councils.
3.4.1 Future audit approach
Our April 2012 report set out a time frame for encouraging the sector to consult with stakeholders and, in consultation with a steering committee, produce a pilot report within the first two years.
In the years ending 30 June 2013 and 2014, we will report our opinion on the relevance and appropriateness of performance indicators to councils via management letters to encourage the further development, while continuing to express a public opinion on their fair representation.
By 30 June 2015 councils will be expected to have fully implemented the reporting framework, providing a suite of measures that are relevant and appropriate for assessing the council’s performance and that fairly represent that performance. The audit opinion will address the fair presentation, relevance and appropriateness of the performance indicators. Where this standard is not met, a qualified audit opinion may be issued on the performance statement. The framework for audit assessment of performance indicators is in Appendix C.
3.4.2 Progress during 2011–12
In response to our report Performance Reporting by Local Government (2011–12:27), the Department of Planning and Development (DPCD), through Local Government Victoria (LGV), commenced detailed planning of a two year project to implement a performance reporting regime for local government.
LGV has secured a commitment for two years’ funding toward the implementation of a performance reporting framework and has recruited a dedicated project manager. LGV has also begun detailed scoping of the design principles for the proposed framework—including accountability, project governance, draft indicators, and reporting requirements and presentation—with sector consultation to commence shortly.
Recommendations
- That the Department of Planning and Community Development should continue its work in developing regulations that establish the minimum standards for the form and content of performance statements.
That councils should:
- critically review their strategic and service objectives so that they are clearly expressed, aligned and measurable.
- critically review the performance information in their annual reports so that it is relevant, balanced, appropriate and clearly aligned with their objectives.
4 Financial results
At a glance
Background
Accrual-based financial statements enable an assessment of whether local government entities are generating sufficient surpluses from operations to maintain services, fund asset maintenance and retire debt.
This Part analyses the financial results of Victoria’s 79 local councils and 11 regional library corporations (RLCs) for the year ended 30 June 2012.
Findings
- The overall operating result for councils decreased from a $1.11 billion surplus in 2010–11 to a $1.03 billion surplus in 2011–12.
- An increase of $672 million in revenue (9 per cent) was largely offset by $752 million (12 per cent) in expenses, primarily driven by increases in employee benefits arising from a $367 million funding call on the local government defined benefit plan.
- The overall operating result for RLCs deteriorated from a surplus of $2.16 million in 2010–11 to a deficit of $3.06 million in 2011–12.
- RLCs continue to rely heavily on council contributions and government to fund their operations—council contributions represent 80 per cent of RLCs revenue. Without this funding they cannot generate sufficient funds to meet their financial obligations.
4.1 Introduction
The preparation of accrual-based financial statements enable an assessment of whether local government entities are generating sufficient surpluses from operations to maintain services, fund asset maintenance and retire debt.
The financial objective for councils and regional library corporations (RLCs) should be to generate sufficient resources from operations to meet financial obligations, fund asset replacement and fund new asset acquisitions. The ability of councils and RLCs to do this depends largely on their expenditure management and revenue maximisation practices. This is reflected in the composition and rate of change of their operating revenue and expenses.
4.2 Financial results: councils
The overall operating result for councils decreased 7 per cent from a $1.11 billion surplus in 2010–11 to a $1.03 billion surplus in 2011–12. Fourteen councils reported an operating deficit for the year.
4.2.1 Operating revenue
Councils generated $8.18 billion in operating revenue in 2011–12, an increase of 9 per cent on the $7.51 billion collected in 2010–11. The increase was largely driven by increases of 8 per cent in rates and charges and 18 per cent in government grants.
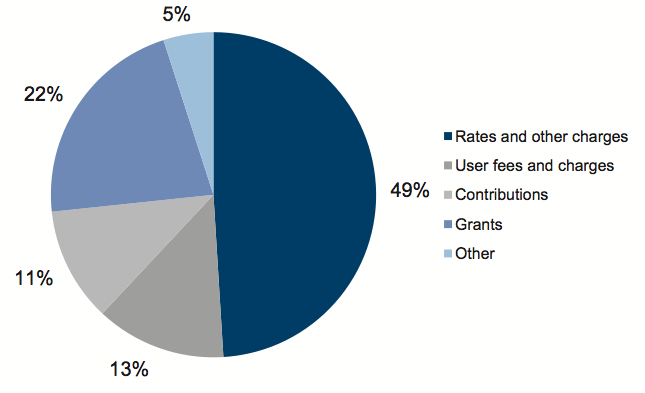
The composition of operating revenue was largely consistent with 2010–11. Figure 4A shows the composition of operating revenue for councils for 2011–12.
Figure
4A
Council revenue composition, 2011–12
Source: Victorian Auditor-General’s Office.
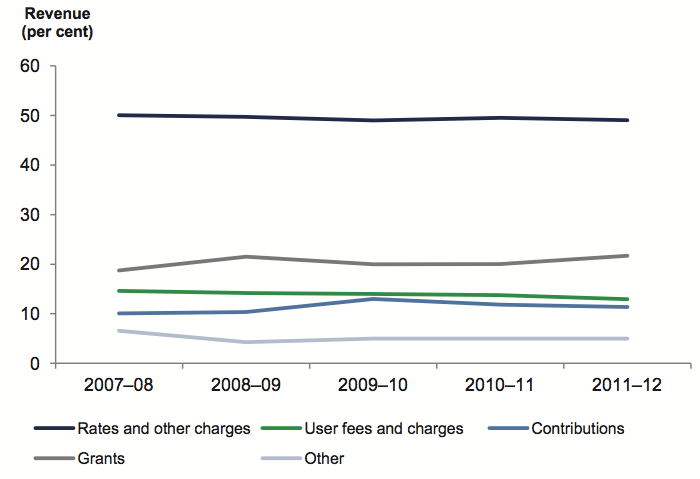
Forty-nine per cent of council revenue for 2011–12 came from rates and other charges (50 per cent in 2010–11). This was consistent with the five-year trend shown in Figure 4B.
Figure
4B
Council revenue composition, five-year trend
Source: Victorian Auditor-General’s Office.
Grants received increased to 22 per cent of revenue in 2011–12 compared with 20 per cent in 2010–11. This was due to the early payment by the Victorian Grants Commission of $263 million, which comprised of two 2012–13 quarterly grant instalments.
4.2.2 Operating expenditure
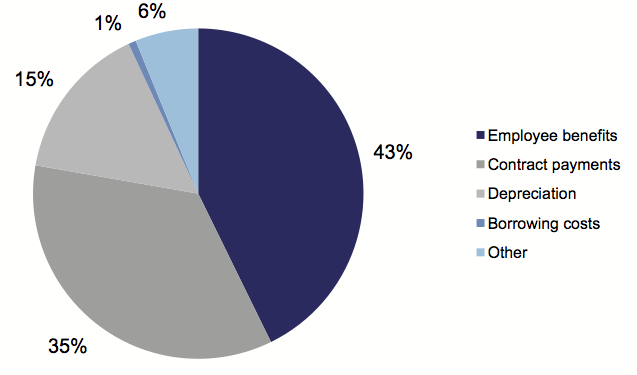
The total operating expenditure of the 79 councils was $7.15 billion in 2011–12 ($6.40 billion in 2010–11). Figure 4C shows the composition of operating expenditure for 2011–12.
Figure 4C
Council expenditure composition, 2011–12
Source: Victorian Auditor-General’s Office.
The largest component of expenditure in 2011–12 was employee benefits at 43 per cent (39 per cent 2010–11). The 4 per cent increase in employee benefits was largely offset by a 3 per cent reduction in contract payments, which represents 35 per cent of expenditure in 2011–12.
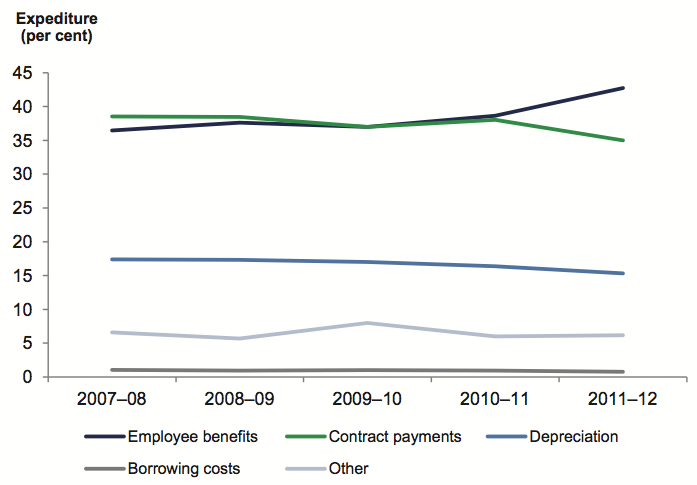
The trend in expenditure components over the past five years is shown in Figure 4D.
Figure
4D
Council expenditure composition, five-year trend
Source: Victorian Auditor-General’s Office.
Employee benefits increased substantially in 2011–12 because of funding calls made by the local authorities superannuation fund provider to address funding shortfalls in defined benefit plans. In 2011–12 total employee benefits increased to $3.06 billion from $2.47 billion. Of the increase, $367 million related to the defined benefit funding call (2010–11 $71 million).
4.3 Financial results: regional library corporations
The overall operating result for RLCs declined from a $2.16 million surplus in 2010–11 to a deficit of $3.06 million in 2011–12. A net increase of $4.61 million from council contributions and grants was more than offset by an $8.30 million increase in employee benefit expenses.
Eighty per cent of RLCs revenue comes from councils, so RLCs remain heavily dependent upon ongoing council support to fund their operations.
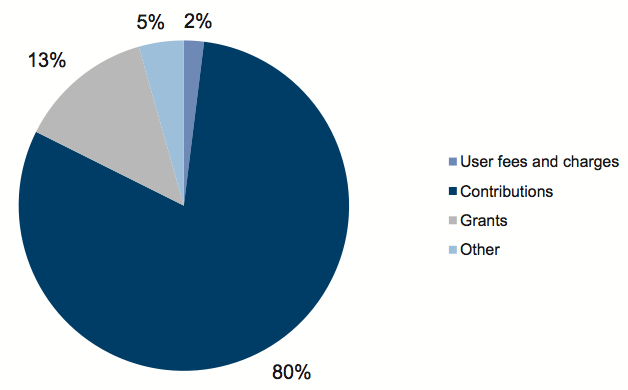
4.3.1 Operating revenue
In 2011–12, RLCs had revenue of $78.2 million ($74.1 million in 2010–11). Eighty per cent of revenue was from council contributions (76 per cent in 2010–11). Figure 4E shows the overall composition of operating revenue for RLCs in 2011–12.
Figure
4E
Regional library corporations—revenue composition, 2011–12
Source: Victorian Auditor-General’s Office.
The trend in revenue composition over the past four years is shown in Figure 4F.
Figure
4F
Regional library corporations—revenue composition, five-year trend
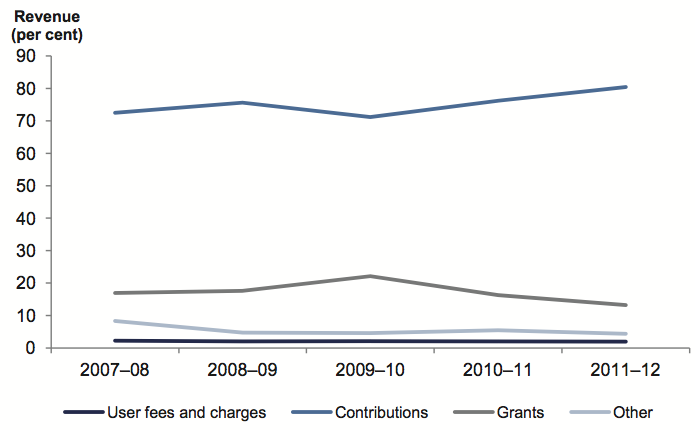
Source: Victorian Auditor-General’s Office.
Figure 4F shows that RLCs continue to rely heavily on council contributions and, to a lesser extent, government grants to fund their operations. Income from user fees and charges has remained at 2 per cent throughout the five-year period.
Government grants to RLCs have continued to decrease from 22 per cent of revenue since 2009–10 to 13 per cent in 2011–12.
4.3.2 Operating expenditure
In 2011–12, RLCs had expenditure of $81.2 million ($72.0 million in 2010–11). Figure 4G shows the composition of expenditure for the year.
Figure
4G
Regional library corporations—expenditure composition, 2011–12
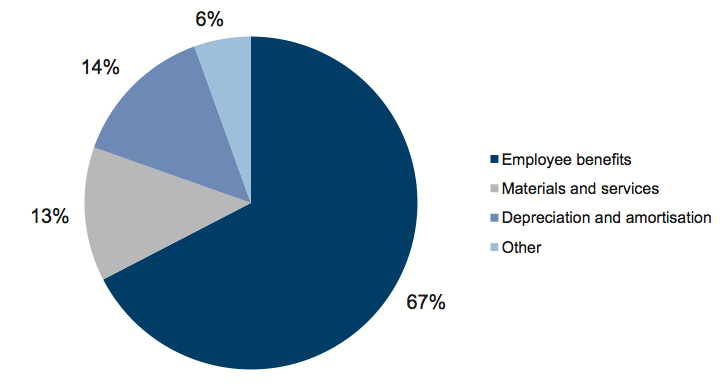
Source: Victorian Auditor-General’s Office.
The largest component of expenditure was employee benefits, at 67 per cent (65 per cent in 2010–11). All other expenditure has largely remained at 2010–11 levels.
RLC expenditure components over the past five years are shown in Figure 4H.
Figure
4H
Regional library corporations—expenditure composition, five-year trend
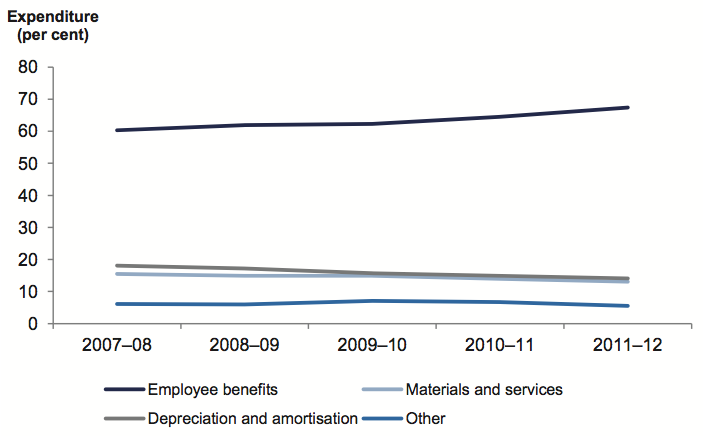
Source: Victorian Auditor-General’s Office.
Over the five years, the highest expenditure item was employee benefits, which have increased since 2007–08, while other types of expenditure have either remained constant or decreased slightly.
The continued dependence on councils for continued financial support poses significant sustainability challenges for RLCs currently and into the future.
As signalled in our 2010–11 report, Central Highlands Regional Library Corporation ceased operations and is in the process of liquidation. Library services have been incorporated into Ballarat City Council and are provided under a shared services model.
5 Financial sustainability
At a glance
Background
To be financially sustainable, entities need to be able to meet current and future expenditure as it falls due. They also need the ability to absorb foreseeable changes and materialising risks without significantly changing their revenue and expenditure policies. This Part provides our insight into the financial sustainability of local councils based on our analysis of the trends in key financial indicators over a five-year period.
Conclusion
The overall financial sustainability risk for local councils in 2011–12 remained low, consistent with 2010–11. However, councils face an ongoing challenge to maintain spending on capital works and existing assets at sufficient levels.
Findings
In 2011–12 the number of councils with a financial sustainability risk assessed as high decreased from two to one, and councils with a medium risk from six to five, with Buloke Shire Council again rated as high, Glen Eira City Council improved from high to low risk, and Whittlesea City Council improved from medium to low risk.
5.1 Introduction
To be financially sustainable, councils need to be able to meet current and future expenditure as it falls due. They must also absorb foreseeable changes and financial risks that materialise, without significantly changing their revenue and expenditure policies.
Financial sustainability should be viewed from both the short-term and long-term perspective. Short-term indicators relate to the ability of an entity to maintain positive operating cash flows in the near future, or the ability to generate an operating surplus in the next financial year. Long-term indicators focus on strategic issues such as the ability to fund significant asset replacement or reduce long-term debt.
Insight into the financial sustainability of local councils is obtained from analysing trends in the six key financial sustainability indicators over the past five years. The analysis reflects on the position of individual councils, the five categories of councils (inner metropolitan, outer metropolitan, regional city, large shire and small shire) and the sector as a whole. Appendix E describes the sustainability indicators, the risk assessment criteria used and the significance of these.
The assessment of financial sustainability assists in identifying trends that either warrant attention or highlight positive results.
To form a definitive view of any entity’s financial sustainability, a holistic analysis that goes beyond financial indicators would be required including an assessment of the entity’s operations and environment. These non-financial considerations are not examined in this report.
5.2 Financial sustainability
5.2.1 Overall assessment
The sector as a whole has maintained its financial sustainability year on year. Analysis of the six indicators show that councils as a whole had a low financial sustainability assessment risk, but they face an ongoing challenge to maintain spending on capital works and existing assets at sufficient levels.
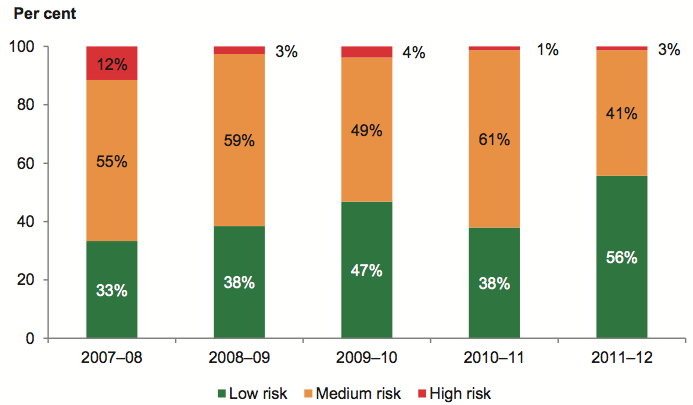
Figure 5A shows that the number of councils with a financial sustainability risk assessment of high decreased from two in 2010–11 to one in 2011–12. The number of councils assessed as having a low sustainability risk also improved, from 71 in 2010–11 to 73 in 2011–12.
Figure 5A
Two-year financial sustainability risk assessment, by council category
|
2011–12 |
2010–11 |
|||||
|---|---|---|---|---|---|---|
|
Council |
High |
Medium |
Low |
High |
Medium |
Low |
|
Inner metropolitan |
– |
– |
17 |
1 |
– |
16 |
|
Outer metropolitan |
– |
2 |
12 |
– |
3 |
11 |
|
Regional city |
– |
1 |
10 |
– |
1 |
10 |
|
Large shire |
– |
1 |
15 |
– |
– |
16 |
|
Small shire |
1 |
1 |
19 |
1 |
2 |
18 |
|
Total |
1 |
5 |
73 |
2 |
6 |
71 |
|
Per cent |
1 |
6 |
93 |
3 |
7 |
90 |
Source: Victorian Auditor-General’s Office.
Figure 5B shows that overall financial sustainability risk for councils since 2007–08 has reduced. Eighty-one per cent of councils in 2007–08 were assessed as having a low sustainability risk compared to 93 per cent in 2011–12.
Figure 5B
Five-year financial sustainability risk assessment
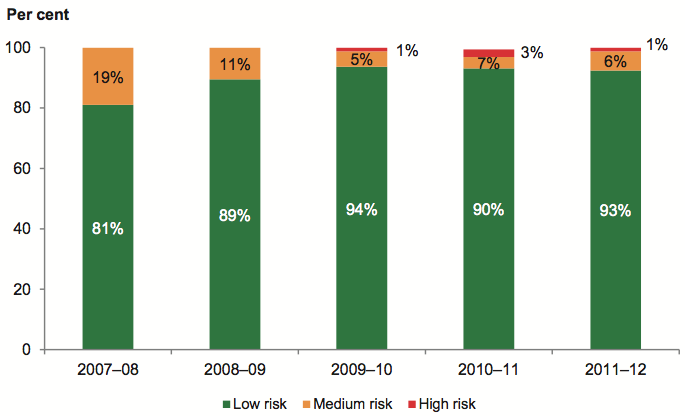
Source: Victorian Auditor-General’s Office.
5.2.2 Assessment of financial sustainability risk by council category
The overall risk assessments for each of the five categories of councils are presented below. Detailed results of our sustainability risk assessments for each category and each council can be found in Appendix E.
Inner metropolitan councils
The overall financial sustainability risk for inner metropolitan councils for 2011–12 was low. No councils were assessed as high risk compared with one in 2010–11.
In 2010–11 Glen Eira City Council was assessed as high risk due to its liquidity ratio, as a result of its decision to use its cash assets to fund the construction of the Glen Eira Sports and Aquatic Centre. Glen Eira’s liquidity position improved from 0.95 in 2010–11 to 1.55 in 2011–12 and was therefore assessed as low risk.
Outer metropolitan councils
The overall financial sustainability risk for outer metropolitan councils was low for 2011–12. In 2011–12, two councils were assessed as medium risk compared with three in 2010–11.
The renewal gap continues to be a challenge for the 14 outer metropolitan councils, with one council rated as high risk, the same as in 2010–11. Eight councils were rated as medium risk (10 councils, 71 per cent in 2010–11).
Councils in this category service the growth corridors of Melbourne and therefore have high infrastructure needs that require greater focus on maintaining assets at serviceable levels.
Regional city councils
The overall financial sustainability risk for regional city councils was low for 2011–12. However, Wodonga City Council was assessed as medium risk, as has been the case since 2007–08, when council committed to selling its industrial development land known as LOGIC. In 2011–12 the council reconsidered the likelihood of the sale of LOGIC and reclassified its cost from ‘assets held for sale within 12 months’ to ‘non‑current’. The reclassification caused a decrease in the liquidity ratio from 4.67 in 2010–11 to 1.55 in 2011–12.
Wodonga’s indebtedness average improved from 93 per cent in 2010–11 to 73 per cent in 2011–12 due to the reduction of existing non-current borrowings in the reporting year.
Large shire councils
The overall financial sustainability risk for large shire councils was low for 2011–12. The capital replacement indicator for 11 of the 16 councils was assessed as medium risk, highlighting the challenges large shire councils face in maintaining the level of capital spending against the rate of depreciation on existing assets.
Small shire councils
The overall financial sustainability risk for small shire councils was low for 2011–12. However, Buloke Shire Council was again assessed as high risk (high, 2010–11).
Buloke reported a positive underlying result for 2011–12 as a direct result of a one-off non-recurrent capital grant received on account of the 2010–11 floods. However, as the council had recorded large underlying deficits in the preceding two years, the overall sustainability risk assessment for Buloke remains high, with minor improvements in average underlying results offset by a deteriorating liquidity ratio. The position of the council is appropriately disclosed in the 2011–12 financial report.
5.3 Five-year trend analysis
This section analyses and comments on the trends in six sustainability indicators for the past five years. The indicators reflect each entity’s funding and expenditure policies, and show whether these policies are sustainable.
Financial sustainability should be viewed from both a short- and long-term perspective. Short-term indicators relate to the council’s ability to maintain a positive operating cash flow and adequate cash holdings, and to generate an operating surplus over time. The indicators of this are the underlying result and liquidity.
Long-term indicators signify whether there is adequate funding available to cover long‑term debt and for spending on asset replacement to enable the entity to maintain the quality of service delivery, and to meet community expectations and the demand for services. The long-term indicators are indebtedness, self‑financing, capital replacement and renewal gap.
5.3.1 Underlying result
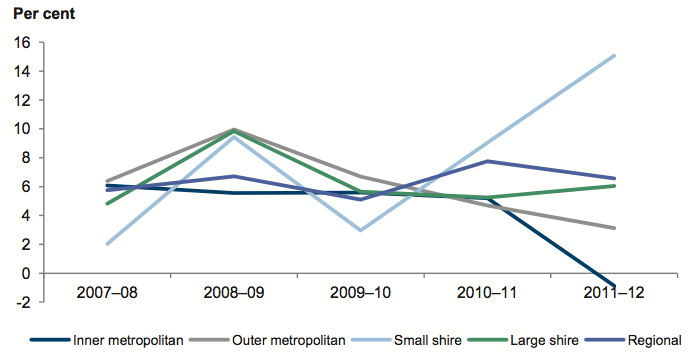
The average underlying result fluctuated from 2007–08 to 2010–11 but deteriorated in three of five council categories in 2011–12, most notably in inner metropolitan councils. Figure 5C shows the average underlying result for all councils since 2007–08.
Figure 5C
Average underlying result
Source: Victorian Auditor-General’s Office.
The key driver was a $421 million funding call made by the local authorities superannuation fund provider to address a funding shortfall in the defined benefit fund, of which the portion for local government was $367 million.
The underlying results for inner metropolitan and outer metropolitan councils declined in 2011–12. Inner metropolitan councils experienced the greatest decline, from a surplus of $130.5 million in 2010–11 to a deficit of $5.9 million in 2011–12. This was due to inner metropolitan councils having a higher proportion of members under the defined benefit funding scheme.
Small shire and large shire councils reported increases in underlying result. The greatest improvement was for small shire councils, with their underlying result increasing 12 per cent since 2009–10 due to natural disaster funding received for floods and bushfires.
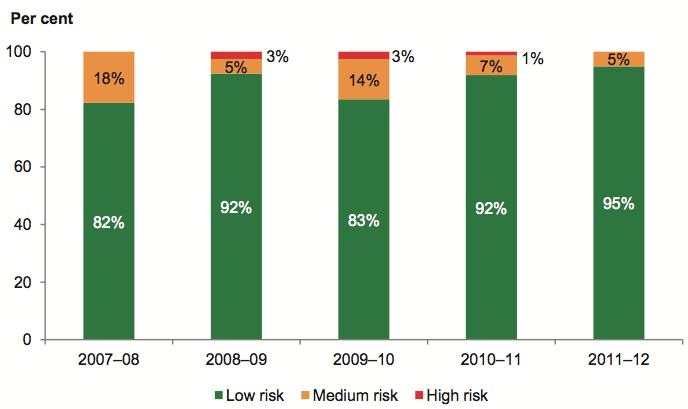
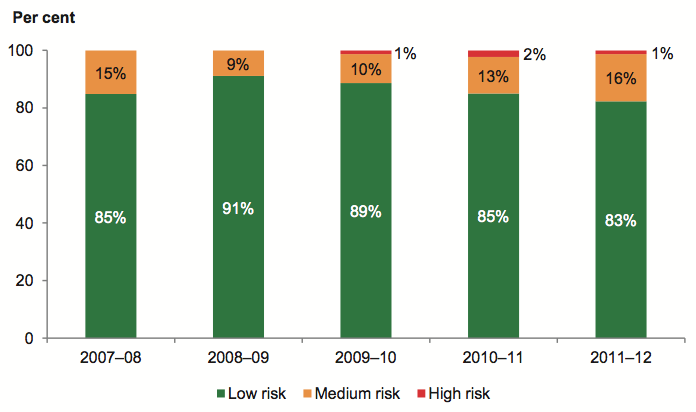
Figure 5D shows that the underlying result of 5 per cent of councils was assessed as high or medium risk for in 2011–12 (8 per cent in 2010–11).
Figure 5D
Underlying result risk assessment
Source: Victorian Auditor-General’s Office.
The proportion of councils assessed as medium risk decreased from 14 per cent to 5 per cent since 2009–10. The proportion of councils assessed as high risk also decreased over the three-year period, from 3 per cent in 2009–10 to none in 2011–12. The improvement has largely been driven by the receipt of two quarterly instalments from the Victorian Grants Commission in June 2012 for 2012–13, and by natural disaster grants paid to small shire councils during 2011–12.
The proportion of councils assessed as low risk increased to 95 per cent from 82 per cent over the five-year period.
In 2011–12, 22 councils recorded an underlying deficit (eight in 2010–11). Figure 5E shows that the small shire, inner metropolitan and outer metropolitan categories had the greatest percentage of entities with underlying deficits.
Figure 5E
Percentage of councils with an underlying deficit
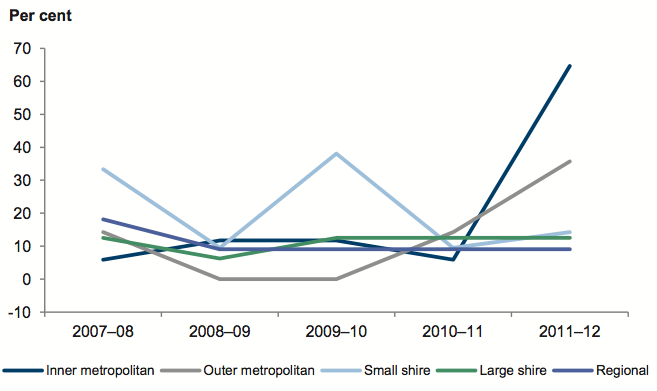
Source: Victorian Auditor-General’s Office.
Sixty-five per cent of inner metropolitan councils and 36 per cent of outer metropolitan councils reported underlying deficits. These two categories were most affected by the defined benefit funding call.
5.3.2 Liquidity
Figure 5F shows that, overall, the ability of councils to repay their short-term financial obligations improved over the five-year period. The average liquidity ratio for all councils is above 1.50, indicating no immediate concerns at the overall sector level.
Figure 5F
Average liquidity ratio
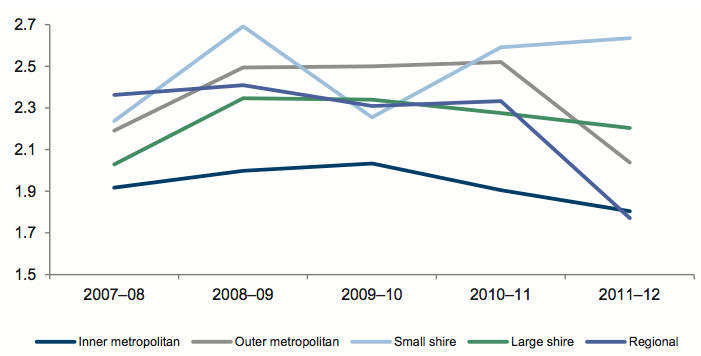
Source: Victorian Auditor-General’s Office.
The average liquidity ratio decreased from 2.33 in 2010–11 to 2.09 in 2011–12. All councils except small shire councils reported a lower average liquidity ratio for the year. In June 2012 cash balances increased by $263 million due to early funding of 2012–13 grants from the Victorian Grants Commission. This was largely offset by increases in current trade payables and provisions.
Figure 5G shows that the proportion of councils assessed as high risk decreased from 2 per cent in 2010–11 to 1 per cent in 2011–12. Councils assessed as medium risk increased from 13 per cent in 2010–11 to 16 per cent in 2011–12.
Figure 5G
Liquidity risk assessment
Source: Victorian Auditor-General’s Office.
The proportion of councils assessed as low risk has steadily declined since 2008–09, but remains significant.
5.3.3 Indebtedness
Figure 5H shows the average indebtedness of councils over the five-year period.
Figure 5H
Average indebtedness
Source: Victorian Auditor-General’s Office.
Inner metropolitan councils continue to have the lowest indebtedness of all categories, and have the greatest capacity to increase revenue through fees and charges. As a result, the risk that inner metropolitan councils will not service their debt is low.
Conversely, large councils continue to have the highest indebtedness. These councils have limited discretionary revenue options, and so need to actively manage and monitor their debt.
While average indebtedness ratios were largely stable between 2007–08 and 2010–11, there was a marked increase in 2011–12 for all councils. A 3 per cent increase in user-generated revenue across the sector was offset by the decision of some councils to defer payment of the defined benefit superannuation call beyond 12 months.
Figure 5I shows that the proportion of councils in the medium- and high-risk categories steadily increased from 10 per cent in 2007–08 to 19 per cent in 2011–12. Councils need to remain focused on maintaining their debt at sustainable levels.
Figure 5I
Indebtedness risk assessment
Source: Victorian Auditor-General’s Office.
5.3.4 Self-financing
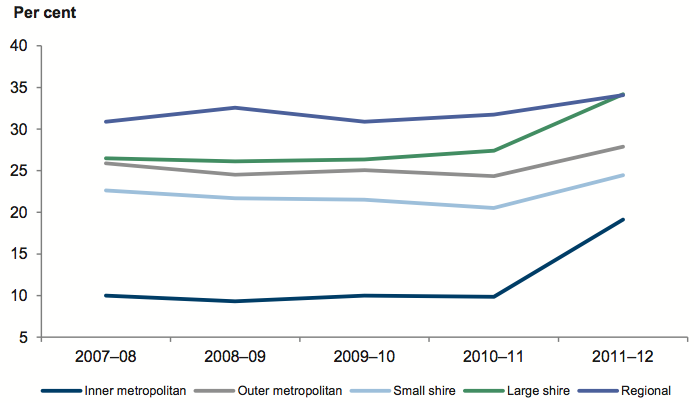
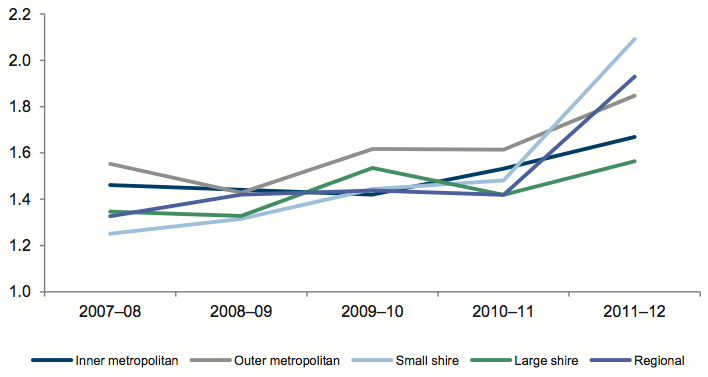
The self-financing indicator across all council categories has been consistently over 20 per cent for the past five years, as shown in Figure 5J. This indicates that the sector can effectively replace consumed assets over the longer term using income generated from operations.
Figure 5J
Average self-financing by council category
Source: Victorian Auditor-General’s Office.
Figure 5J shows two substantial increases in the average self-financing ratio by council category over the five-year period. Both increases relate to early receipt of Victorian Grants Commission grant payments. In June 2009 councils received an advance of $113 million, representing one quarter’s grant funding, and in June 2012 councils received an advance of two quarters’ funding, amounting to $263 million.
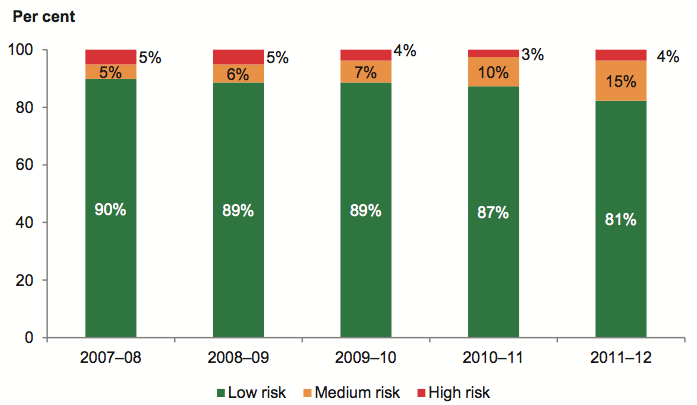
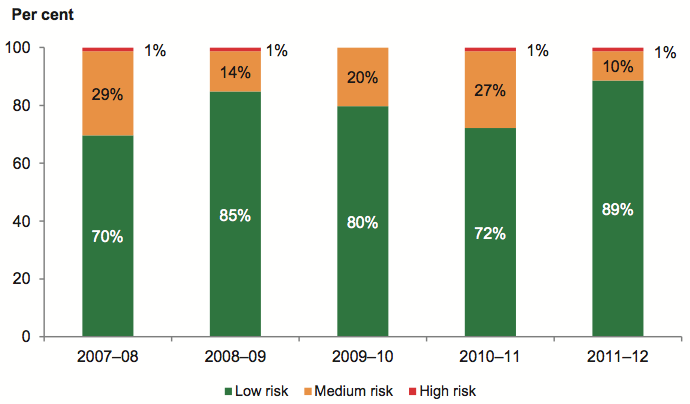
Figure 5K shows a marked improvement in self-financing risk, with 89 per cent of councils now rated as low risk compared with 72 per cent in 2010–11. The proportion of councils rated as medium risk reduced from 27 per cent in 2010–11 to 10 per cent in 2011–12 as councils previously rated as medium risk moved into the low risk category.
Figure 5K
Self-financing risk assessment
Source: Victorian Auditor-General’s Office.
5.3.5 Capital replacement
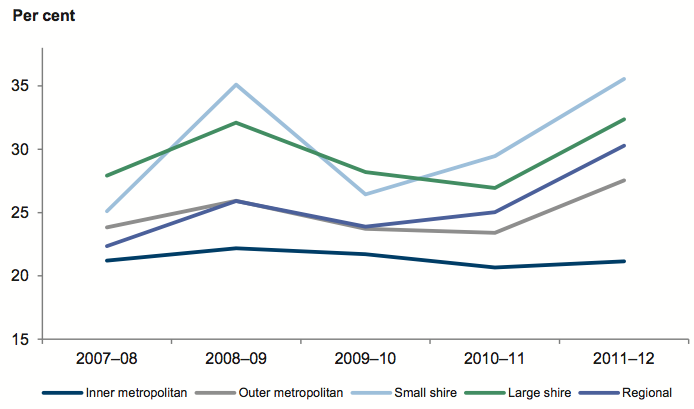
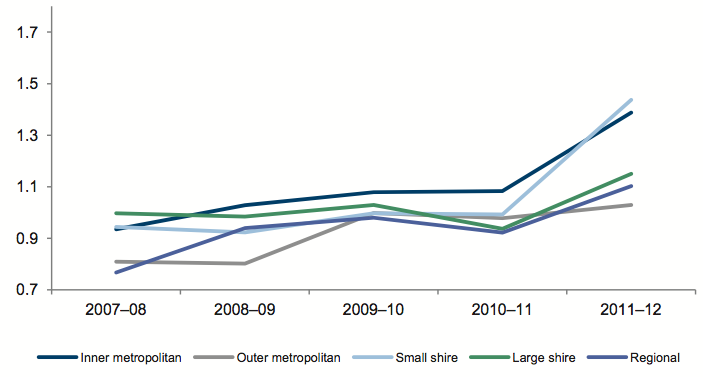
Figure 5L shows that the average capital replacement ratio across all council categories improved over the five years.
Figure 5L
Average capital replacement by council category
Source: Victorian Auditor-General’s Office.
Aggregate capital spending on infrastructure, property, plant and equipment has consistently and significantly exceeded aggregate depreciation and amortisation.
While small shire councils and regional councils were the most challenged categories in 2007–08, their spending has grown such that they have overtaken all other council categories. The marked improvement in their average capital replacement is a result of capital spending associated with natural disaster funding.
While outer metropolitan councils spend the most on assets, this needs to be assessed in conjunction with the renewal gap indicator. These councils service growth corridors, consequently their spending on new infrastructure can be high, driving a higher capital replacement result.
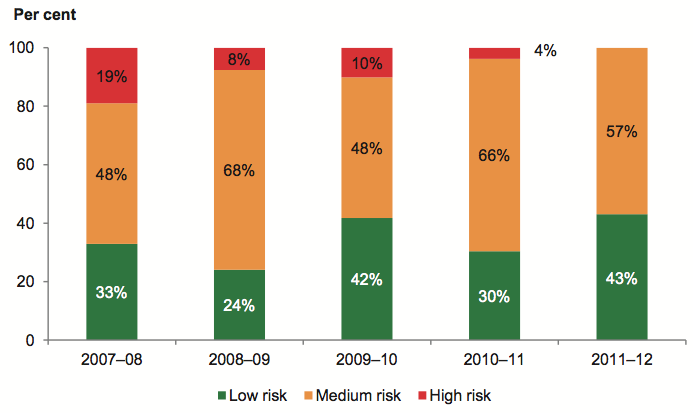
Figure 5M shows that 57 per cent of councils were rated as having medium capital replacement risk compared to 66 per cent in 2010–11. There were no high capital replacement risk councils in 2011–12 (4 per cent in 2010–11).
The proportion of councils assessed to be at low risk increased significantly in 2011–12.
Figure 5M
Capital replacement risk assessment
Source: Victorian Auditor-General’s Office.
5.3.6 Renewal gap
Figure 5N shows that the average renewal gap across small shire, inner metropolitan, and outer metropolitan councils improved over the five-year period.
Figure 5N
Average renewal gap
Source: Victorian Auditor-General’s Office.
In 2011–12, aggregate spending on renewal, restoration and replacement of existing infrastructure, property, plant and equipment exceeded the rate at which the assets depreciated.
Figure 5O
Renewal gap risk assessment
Source: Victorian Auditor-General’s Office.
Figure 5O shows that the proportion of councils with a high renewal gap risk increased from one per cent in 2010–11 to 3 per cent in 2011–12. The proportion of councils rated as low risk increased from 38 per cent in 2010–11 to 56 per cent in 2011–12. The greatest improvement has come from small shire councils, with six councils previously rated as medium, now low risk. This was due to the increased funding received by councils within this category for natural disaster recovery works.
While overall renewal gap risk has improved, councils need to remain focused on maintaining assets at a serviceable level.
6 Internal controls
At a glance
Background
Effective internal controls enable entities to meet their financial and governance objectives and deliver reliable, accurate and timely financial reports. This Part presents the results of our assessment of general internal controls and controls over budget development and management and outsourced arrangements at councils.
Conclusion
Internal controls at councils were adequate for producing reliable, accurate and timely financial reports. Nevertheless, a number of areas for improvement were identified.
Findings
- Seventy-two councils (92 per cent) did not acquit actual performance against the terms of the budget or strategic objectives set.
- Sixty councils (77 per cent) did not demonstrate links between their operational and capital budgets.
- Fifty-three councils (71 per cent) did not a prepare business case when determining whether to outsource waste management services.
- Most councils lacked a contingency to address the failure of outsourced waste management services.
Recommendations
That councils should:
- prepare and align financial and strategic budgets beyond the elected council’s four-year term to informed decisions about delivery of longer-term outcomes, and consider timely asset replacement with periodic review and acquittal of actual performance
- review and link the impact between their operational and capital works needs when preparing budgets with independent assessments of the underpinning assumptions
- develop and adhere to outsourcing policies and procedures that require preparation of robust and well evaluated business cases with rigorous assessments that align with Best Value Principles.
6.1 Introduction
Effective internal controls assist entities to reliably and cost-effectively meet their financial and governance objectives. Reliable internal controls are a prerequisite for the delivery of accurate and timely external and internal reports.
In our annual financial audits, we focus on the internal controls relating to financial reporting and assess whether entities have effectively managed the risk that their financial statements will not be complete and accurate. Poor internal controls diminish management’s ability to achieve an entity’s objectives, agreed service levels and compliance with relevant legislation. Poor internal controls also increase the risk of fraud, error and irregularity.
The councillors and management of each local council are responsible for developing and maintaining adequate systems of internal control to enable:
- preparation of accurate financial records and other information
- timely and reliable external and internal reporting
- appropriate safeguarding of public assets
- prevention or detection of fraud, errors and other irregularities.
In this Part we report on aspects of the internal controls across the state’s 79 local councils. We specifically address:
- general internal controls
- budget development and management
- outsourcing arrangements.
6.2 General internal controls
Internal controls at councils were adequate for producing reliable financial reporting. Nevertheless, we identified a number of instances where internal controls need to be strengthened.
The commonly identified areas for improvement were:
- information systems
- reconciliation reviews
- procurement processes
- segregation of duties.
Figure 6A sets out the financial areas and systems that had the highest occurrence of weaknesses in 2011–12. Forty-one per cent of the commonly identified areas for improvement related to information system change management.
Figure 6A
Top four control weaknesses
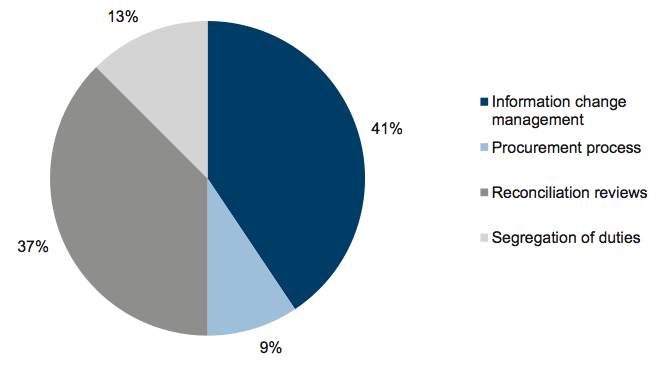
Source: Victorian Auditor-General’s Office.
6.2.1 Information systems
Ineffective change management can lead to failure of systems and loss of data, resulting in disruption of business continuity and service provision. The sector relies on information systems and their continuous upgrade and replacement to improve the quality of services it provides. Information relating to employees, customers and suppliers, and to the financial and operational aspects of the business needs to be accurate and complete and the supporting systems reliable. For these reasons, sound controls over change management of information systems are important.
Thirteen of 79 councils (16 per cent) had control weaknesses relating to:
- information systems change management documentation
- review of change management documents
- regular review of changed processes
- oversight of masterfile changes.
6.2.2 Reconciliation reviews
A financial report is compiled from information captured in an entity’s general ledger, with key general ledger balances supported by information in subsidiary ledgers such as accounts payable, fixed assets and payroll systems. Periodic reconciliation of the general ledger with subsidiary ledger balances enables confirmation of the completeness and accuracy of data recorded.
Timely preparation and independent review of reconciliations decreases the risk that errors may go undetected or may not be resolved in a timely manner, both of which can adversely affect the accuracy of financial reporting.
In 12 of 79 councils (15 per cent):
- key reconciliations were not prepared
- reconciliations were not independently reviewed
- when reconciliations did occur, they were not on a timely basis.
6.2.3 Procurement processes
Good internal controls require invoices for payment to be endorsed that goods and services have been received, and that invoices are matched to corresponding evidence of a commitment in the form of a purchase order raised prior to the goods or services being ordered. Gaps in these controls increase the risk of unauthorised payments or unauthorised procurement of goods or services.
Three of 79 councils (4 per cent):
- lacked purchase orders to support purchases of goods and services
- raised purchase orders after invoices were received.
6.2.4 Segregation of duties
Segregating responsibilities helps mitigate the risk of fraud by preventing employees or groups of employees from being able to perpetrate and conceal errors or fraud in the normal course of their duties. Transaction flows in raising and approving activities such as purchasing or salary processing should be designed such that the work of one individual is either independent of, or serves to check on the work of, another. Four of 79 councils (5 per cent) had a lack of segregation of duties in the payroll function.
6.3 Budget development and management
The Local Government Act 1989 (the Act) requires each council to prepare a budget annually, stating how the activities and initiatives to be funded will contribute to achieving the council’s objectives. The budget is to be put on public notice for 28 days and open for public submissions on any proposals it contains. A council is required to adopt and submit this budget to the Minister for Local Government through Local Government Victoria by 31 August each year.
The Act requires councils to ‘endeavour to achieve the best outcomes for the local community having regard to the long term and cumulative effects of decisions’. To meet the needs of their local communities and to provide services in line with the Best Value Principles stated in the Act, councils need to use their resources effectively and efficiently and manage their budgets soundly.
6.3.1 Budget development and management framework
The key elements of an effective budget development and management framework are detailed in Figure 6B. They draw on the Australian National Audit Office Developing and Managing Internal Budgets: Better Practice Guide June 2008 and the requirement contained in the Act that a council is to establish and maintain a budgeting and reporting framework that is consistent with the principles of sound financial management.
Figure 6B
Key elements of an effective budget development and management framework
|
Component |
Key elements |
|---|---|
|
Policy |
Budget development and management policy exists and:
Policy is approved by the council. |
|
Management practices |
Budgeting preparation is aligned with council roles and responsibilities. Stakeholders are engaged in budget development. Budget preparation process is planned and coordinated. Budget process is overseen and reviewed by management. Budget is constructed through methodologies including a mix of zero‑based and ‘top down/bottom up’ budgeting. Budget assumptions are independently reviewed for relevance and appropriateness. Operating and capital budgets are integrated. Controls around revising budgets are in place and operate. Actual revenue and expenditure against budget is reported to management every three months. Budget development and actual expenditure against approved budget is regularly reported to council. Practice is aligned with requirements of the Local Government Act 1989. |
|
Governance and oversight |
Budget is approved by council. Forecasts are used to manage gaps between budget estimates and actual results. Reports on actual performance to budget are considered regularly. Periodic review of timeliness and accuracy in budget processes are used to drive improvement. Policy is periodically reviewed and changes are approved by council. |
Source: Victorian Auditor-General’s Office.
6.3.2 Policy
A budget development and management policy enables senior management to articulate spending priorities and constraints, and communicate councils’ framework for budget development and decision-making. Forty-one of 79 councils (52 per cent) had a budget development and management policy or procedure and 13 of the 41 had all elements of better practice. Twenty-nine councils (37 per cent) had no policy or alternative procedure for budget development and management and nine (11 per cent) had policies in other areas that provided input to develop the budget.
Adequacy of established policies
All 41 councils with policies had elements of better practice in their policies. However, there is room for improvement, as:
- thirteen of the 41 (32 per cent) did not detail the reporting basis on which budgets were prepared
- nine (22 per cent) did not detail the treatment and expected impacts of one‑off or temporary conditions on the council
- seven (17 per cent) did not detail the circumstances under which departures from normal budgeting principles were permitted.
6.3.3 Management practices
Budgeting responsibilities
Budget preparation in all councils was coordinated by either the finance department or corporate services. All councils except one submitted their budgets to the Minister for Local Government within the legislated time frame during the 2010–11 budget cycle.
Budget construction
Better practice encourages a hybrid approach which is a combination of ‘bottom up’ and ‘top down’ approaches when developing budgets. This promotes greater commitment to, and ownership of, the budget setting process as all levels of management contribute. It also encourages a broad, organisation-wide perspective of the council’s key strategic objectives when senior management sets strategic targets and constraints that cascade down through the organisation.
A review of council budget development practices identified that:
- forty-two of 79 councils (53 per cent) used a hybrid approach where all levels of management contributed, with the guidance of senior management, who provided strategic targets
- twenty (25 per cent) used a ‘bottom-up’ approach, where supervisors and middle management prepared the budget for review by senior management
- seventeen (22 per cent) used a ‘top-down’ approach, where the strategic planning process at the senior management level drove the budget’s development.
Budget approach
Budget approaches varied across the councils:
- Forty-three of 79 councils (55 per cent) took a hybrid approach, using a combination of any of the four budgeting approaches below, where the organisation’s goals, priorities and outputs were linked and fully justified.
- Eighteen (23 per cent) used traditional or incremental budgeting—that is, the previous year’s budget or actual results provided the baseline for the following year’s budget, with adjustments made for known changes in activity levels or inflation.
- Twelve (15 per cent) used zero-based budgeting, where budget items were justified and prioritised as though the related activities were being undertaken for the first time.
- Five (6 per cent) used an activity-based budgeting that focuses on factors that drive costs and justifies expenditure on the activities necessary to deliver services or outputs to predetermined drivers.
- One (1 per cent) used performance-based budgeting, in which the activities required to achieve each output were identified and costed.
It is better practice to do zero-based budgeting periodically. This encourages challenges to the basis of the budget, so that it can be refocused around its strategic objectives and unnecessary expenditure can be cut. Seventy-eight councils in the past five years had prepared a zero-based budget and one had not.
Budget assumptions
A budget is underpinned by assumptions about how internal and external conditions are likely to affect forward estimates and forecasts. Seven councils (9 per cent) obtained independent reviews of the assumptions made in their budgets. Budget assumptions of all other councils were reviewed internally by council personnel.
Assumptions should be independently reviewed for relevance and appropriateness, as incorrect, uninformed or unrealistic assumptions can affect the accuracy, reliability and measurability of financial targets and budgets. In turn, this can impair a council’s ability to meet its strategic objectives.
Integration of operating and capital budgets
Capital budgeting should have a longer-term focus connected to councils’ strategic objectives and plans; however, our review found that the main criterion for capital budgeting was available government funding. Minimal consideration was given to the extent of asset depreciation or to the age of existing assets, which are necessary considerations in achieving an appropriate balance between maintaining older assets and investing in new assets.
The majority of councils (77 per cent) did not demonstrate links between their operational and capital budgets. Linking operational and capital budgets is prudent, better practice budget management, as it provides for appropriate consideration of maintenance, renewal and acquisition of assets.
Monitoring performance against budget
The budgets of all councils were aligned with the four-year term of their elected councils, and their councils’ four-year strategic objectives. Fifty-three per cent also had a strategic budget extending 10 years or longer.
However, 92 per cent did not acquit actual performance against their budgets or their strategic objectives.
Councils publish standard financial statements annually, consisting of a comprehensive income statement, balance sheet, cash flow statement and statement of capital works along with the original approved budget and the difference between their actual results and budget. Rather than acquitting performance against their strategic objectives, 69 councils used reporting on their annual standard statements as a means of monitoring budget to actual spending. In such instances, there were no other processes to check between actual performance and the achievement of council’s strategic objectives.
Revising budgets
Under the Act all councils must revise their budgets if there are material circumstances affecting the financial operations and position of the council. Budget updates are warranted when unforeseen events or significant changes render the original budget irrelevant.
The timeliness of the review of actual results to budget varied across councils:
22 per cent of councils reviewed actual to budget on an ad hoc basis, or yearly when preparing for statutory reporting
- 20 per cent reviewed actual to budget monthly
- 39 per cent reviewed actual to budget quarterly
- 19 per cent reviewed actual to budget half-yearly.
Although the Act allows it, only two councils revised their budgets in 2011–12, as there is no established threshold to trigger them to do so.
The main reason cited by councils for reviewing their budgets is that their borrowings have risen to a level above that approved. Councils then seek ministerial permission and the budget is formally varied.
6.3.4 Governance and oversight
Approval and review of policies and procedures
The authority and legitimacy of budget policies is obtained through approval by the chief executive officer and councillors. Budget development and management policies and procedures should be reviewed and updated periodically so that they accurately reflect the operational direction and strategic position of the council and better practice. Thirty‑two councils (41 per cent) had not reviewed their budget development and management policies and procedures in the past year.
Budget approval, monitoring and reporting
All councils reviewed their budgets annually and had them endorsed by councillors for statutory reporting purposes.
A dedicated committee with oversight of budget preparation, management and reporting can provide feedback if council is meeting its financial targets and council’s strategic directions. Sixty-eight of 79 councils used audit committees, finance committees or the full council to provide oversight through periodic reporting, which analysed budgets and actuals of the operating statement, balance sheet, cash flows statement and capital works in progress. Councillors at 11 councils (14 per cent) did not have formalised procedures to monitor the budget. Councillors should exercise an appropriate level of diligence and take all reasonable steps to oversee actual performance against budget.
6.3.5 Capital works
Councils acquit their capital spend through the statement of capital works. Councils have adopted a ‘compliance-centric’ approach in acquitting their actual capital works expenditure against budget.
Our report Local Government: Results of the 2007–08 Audits (2008–09:12) reported that 34 per cent of councils delivered fewer than 75 per cent of the projects in their capital works budgets in 2007–08. It has been four years since this report and Figure 6C shows there is still room for improvement in managing capital budgets.
Figure 6C
Capital spend versus 2011–12 Budget
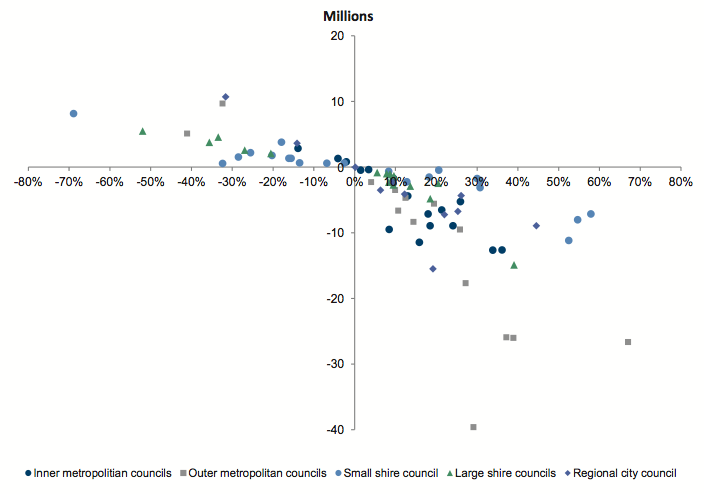
Source: Victorian Auditor-General’s Office.
Forty-five councils (57 per cent) departed from their approved capital works budgets by 10 per cent; of these, 37 departed by a variance greater than 20 per cent.
Variations from budget ranged from an underspend of $39.6 million to an overspend of $10.7 million. Sixty-one per cent of councils were within $5 million of their capital budget, with regional city, large and small shire councils most prolific in this range.
Fifty-eight per cent of councils carried forward capital works that included incomplete projects at reporting date and projects committed to from prior years. The remaining 42 per cent did not carry forward committed projects from prior years but re-prioritised their works based on emerging priorities of the council and funding.
6.4 Outsourcing
Councils provide a wide range of services to their communities, many of which cannot be provided by council staff. Councils need to determine how best to deliver these services by considering factors such as their capacity, capability, availability of resources and the comparative costs of service delivery. The Act requires councils to provide services in accordance with the Best Value Principles, which include service cost and quality standards, value-for-money, and community expectations and values. They also call for balance between affordability and accessibility of services.
Outsourcing framework
Councils are responsible for establishing controls over outsourced services. Effective outsourcing controls and processes include:
- comprehensive policies and procedures
- appropriate management practices
- sound governance and oversight.
The key elements of an effective outsourcing framework are detailed in Figure 6D.
Figure 6D
Key elements of an effective outsourcing framework
|
Component |
Key element |
|---|---|
|
Policy |
A policy for outsourcing exists and:
Policy is approved by council. |
|
Management practices |
Business case is assessed to determine whether to outsource or use internal resources. Appropriate attention is paid to legal matters when drafting or revising outsourcing arrangements. Agreements enable scrutiny of supplier records by the council and its auditors. Nature and level of commitments align with corporate plans. Strategies are in place to acquire and transfer knowledge regarding the outsourced activity. Independent checks of data integrity relating to outsourced arrangements are conducted (likely involving internal audit). Operational performance of the service is regularly monitored. Payments are only made in accordance with normal terms of trade and in line with the agreement. Inherent risks are identified and strategies are developed to mitigate them. Supplier performance is evaluated, assisted by system information captured. Post-evaluation of outsourcing activities is made against projected outcomes. Periodic reporting is made to council on outcomes, supplier performance and risk mitigation. |
|
Governance and oversight |
Policies and procedures are reviewed and updated regularly. Policies and procedures are considered and approved by council. Review of the business risks is undertaken and confirmation received that mitigation strategies are addressed in policies and procedures. Sub-committee is established to oversee the arrangements where outsourcing activities are significant. Progressive review of expected benefits is undertaken against actual results. Integrity of arrangements, compliance with legislative and contractual requirements, and provider performance is assessed by internal audit. |
Source: Victorian Auditor-General’s Office from VAGO better practice guide Public Sector Procurement: Turning Principles into Practice (October 2007) and the Local Government Act 1989.
6.4.1 Outsourcing policy
Policy
An effective policy needs to articulate the principles, processes and procedures that apply to all outsourced activities. We found:
- five councils (6 per cent) had specific outsourcing policies
- fifty-nine (75 per cent) considered outsourcing as part of their procurement, purchasing or tendering policies
- fifteen councils (19 per cent) did not address outsourcing in policies either independently or as part of procurement.
Adequacy of the outsourcing policy
Two councils had outsourcing policies that contained all the listed key elements of better practice. Of the 64 councils with specific outsourcing or other policies:
- fifty-four (69 per cent) referred to Best Value Principles as required in the Act
- forty-two (66 per cent) identified key legal aspects to be observed when entering agreements, including performance measures and access to the supplier’s records
- fifty-eight (91 per cent) addressed the roles and responsibilities of staff including financial delegations.
- thirty-seven (58 per cent) required staff to check that the service was delivered before payment was made
- forty-three (67 per cent) required regular reporting on the supplier’s performance.
However, of the 64:
- fifty-five (86 per cent) did not specify when it was appropriate to outsource
- fifty-eight (91 per cent) did not address accounting treatments and reporting disclosures.
6.4.2 Management practices
We conducted a detailed review of kerb collected waste management services, as these were common to all councils. Sixty-nine councils (87 per cent) had outsourced these services.
Business case
A business case should determine whether a particular service should be delivered with internal resources or procured externally. The outsourcing business case should:
- define the service being considered for outsourcing
- set out all technical and business requirements
- set out the expected outcome and its link to council’s strategic directions
- establish targets for assessing performance
- analyse alternatives and assess all options
- provide financial analysis and measurement against Best Value Principles
- conduct a risk assessment of the various options
- recommend the preferred option.
Only 23 councils of the 69 (29 per cent) had prepared a business case for the outsourced service.
All councils that prepared business cases had the majority of the above elements in their business case. However, six did not perform a financial comparison between outsourcing and providing the service in-house.
Contract and management oversight
A contract sets the parameters for monitoring the operational performance of an outsourced service. Accordingly, a contract should at a minimum:
- set performance standards
- specify metrics for measuring performance
- include clauses to deal with noncompliance or non-performance of the contract.
All contracts reviewed were sound and councils regularly monitored operational performance. However, most councils lacked a contingency for providing an alternative service if the contracted service failed.
6.4.3 Governance and oversight
Periodic review of policies and procedures
Councils should periodically review their policies and procedures so that they accurately reflect the operational direction and strategic position of the council and better practice and enable areas of emerging concern to be addressed. Section 186A(7) of the Act requires councils to review their policies at least once a year.
Of the 69 councils with outsourcing policies only eight councils had reviewed them in the last year.
Review of the business risks
The business risks of outsourcing need to be recognised, mitigation strategies developed and effectiveness of the strategies monitored. If not managed effectively, outsourcing can lead to excessive costs, supplier relationships can deteriorate and the council can suffer reputational damage.
Fifty-nine councils (75 per cent) had not identified risks inherent in outsourcing in their risk register or developed strategies to mitigate such risks.
Internal audit
Periodic reviews of the integrity of a council’s outsourcing activities, including compliance with policies and procedures, are necessary for identifying control weaknesses, potential process improvements and training needs. Reviews can also provide management and the councillors with assurance over the arrangements, and assist their monitoring arrangements and the achievement of desired outcomes.
Fifty-three councils (67 per cent) had not had an internal audit review of their outsourced arrangements and processes during the past three years.
Recommendations
That councils should:
- develop budget management policies and procedures to encourage consistency of practice
- prepare and align financial and strategic budgets beyond the elected council’s four-year term to inform delivery of longer-term outcomes, and consideration of timely asset replacement
- periodically review and acquit actual performance against the council’s budget and strategic objectives to inform budget management decisions and avoidance of overruns
- review the link and impact between their operational and capital works needs when preparing the budget so that sufficient provisions are made for maintenance and renewal of assets
- obtain independent assessments of the assumptions underpinning budgets to improve the soundness of budgeting outcomes and practices
- provide a reporting mechanism for councillors to regularly monitor actual council performance against set budget
- develop and maintain outsourcing policies and procedures that:
- mandate the preparation of robust business cases and require rigorous assessments of procurement options including outsourcing or insourcing any service
- mandate assessment of the alignment of outsourced arrangement with BestValue Principles
- address reporting disclosure matters
- develop formulated and tested contingencies for delivery of critical outsourced services in the event of provider failure
- identify and register risks inherent in outsourcing and develop mitigation strategies and monitor progress in managing those risks.
Appendix A. Audit status
Inner metropolitan councils and associated entities
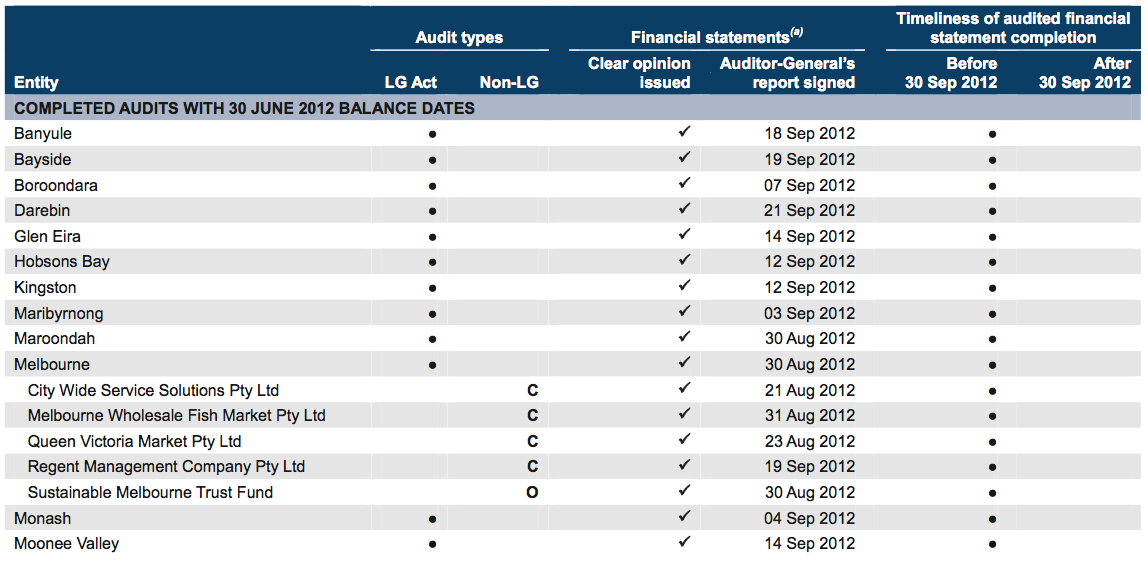
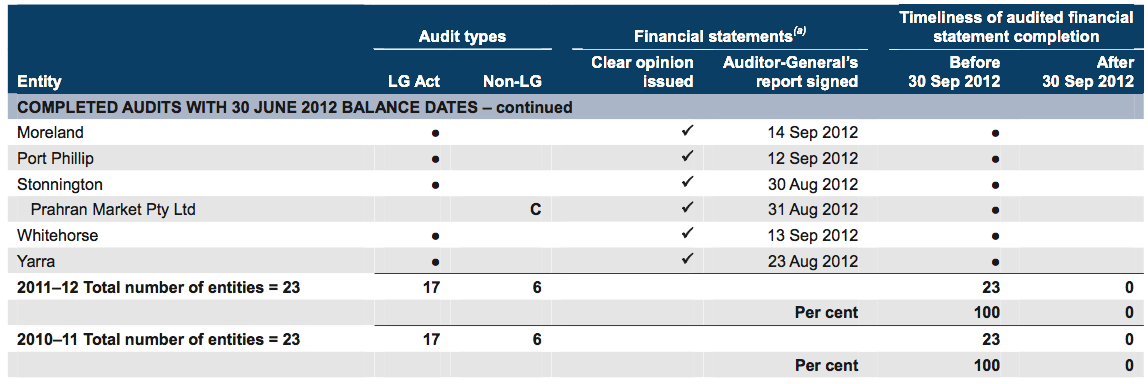
(a) Councils – includes financial, standard and performance statements.
Note: Non-LG audit types: C – Corporations Act 2001 and O – other reporting framework.
Source: Victorian Auditor-General’s Office.
Outer metropolitan councils
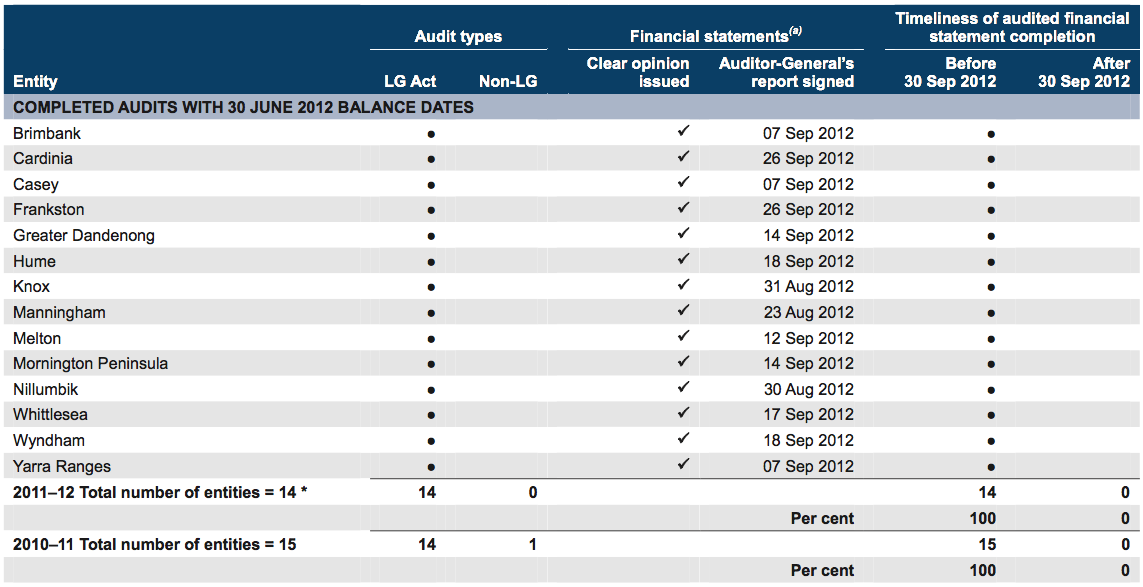
(a) Councils – includes financial, standard and performance statements.
Note: * The Manningham Centre Association is no longer a controlled entity of the Manningham Council.
Source: Victorian Auditor-General’s Office.
Regional city councils and associated entities
![Figure A1 Regional [KW2] city councils and associated entities](/reportAssets/20121128-Local-Government/figurea4.png)
(a) Councils – includes financial, standard and performance statements.
Note: Non-LG audit types: C – Corporations Act 2001.
Source: Victorian Auditor-General’s Office.
Large shire councils
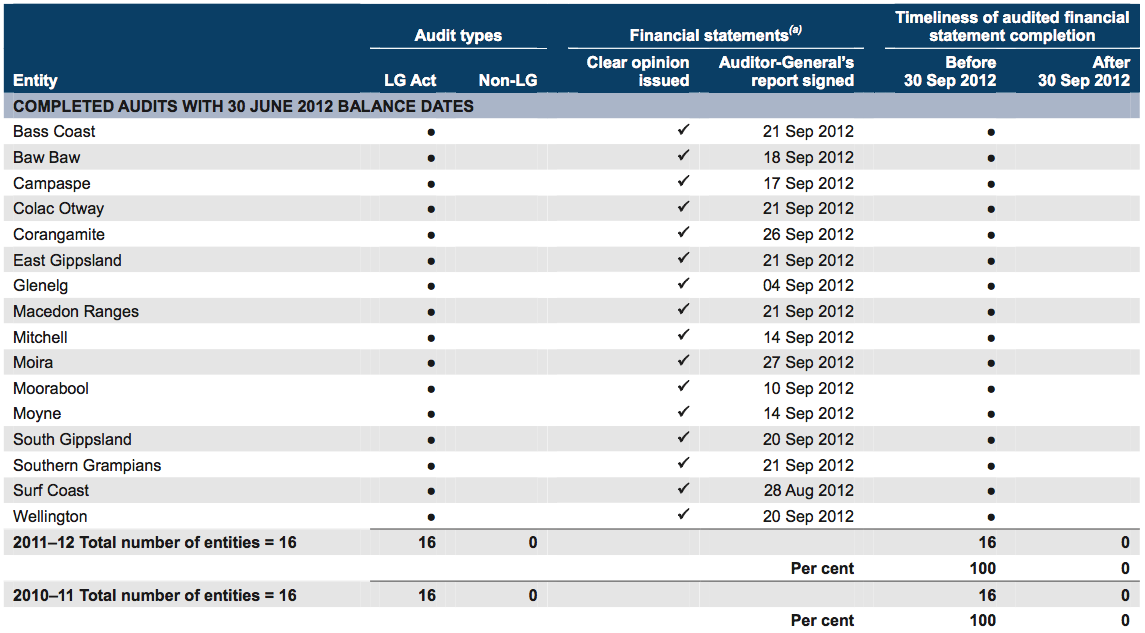
(a) Councils – includes financial, standard and performance statements.
Source: Victorian Auditor-General’s Office.
Small shire councils
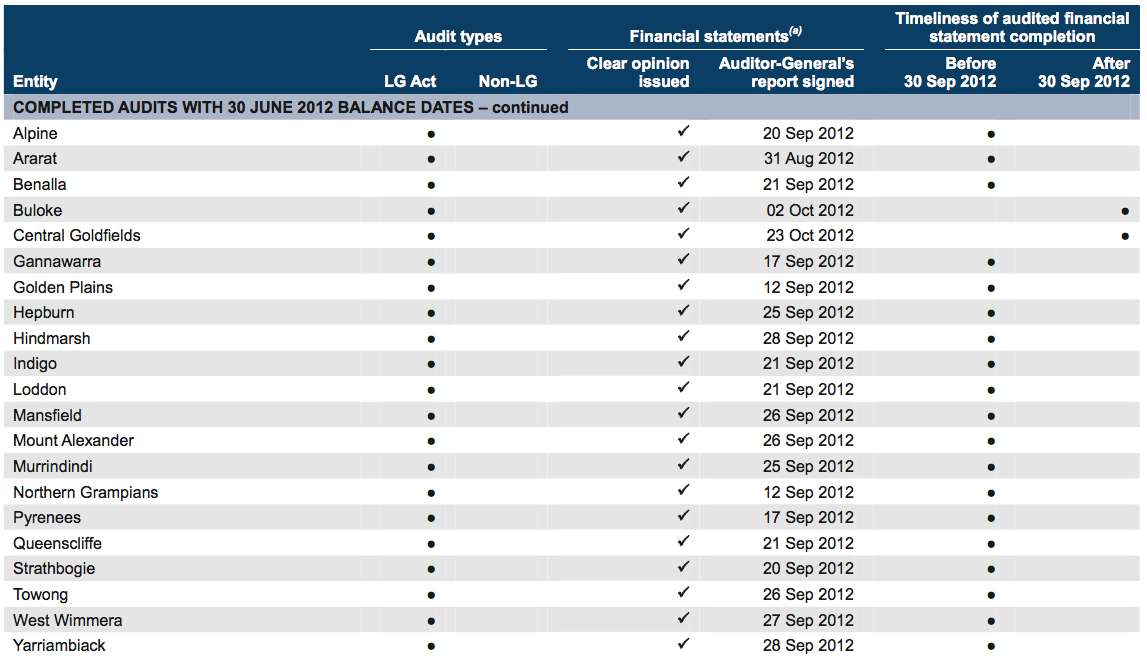
Small shire councils – continued
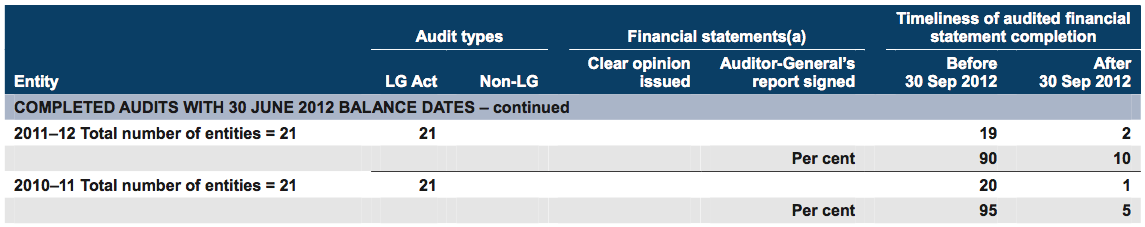
(a) Councils – includes financial, standard and performance statements.
Source: Victorian Auditor-General’s Office.
Regional library corporations
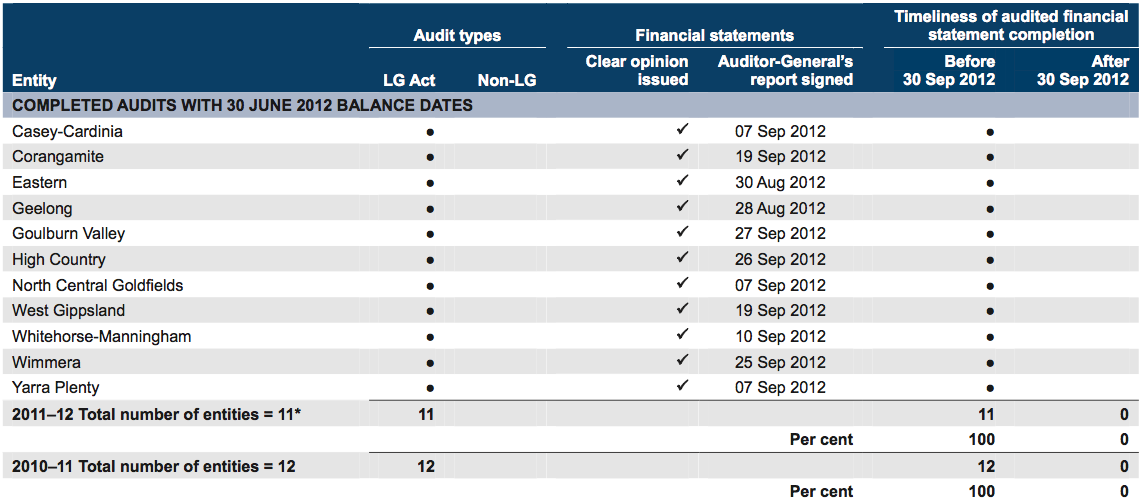
* Central Highlands has ceased operations and is in administration.
Source: Victorian Auditor-General’s Office.
Associated companies
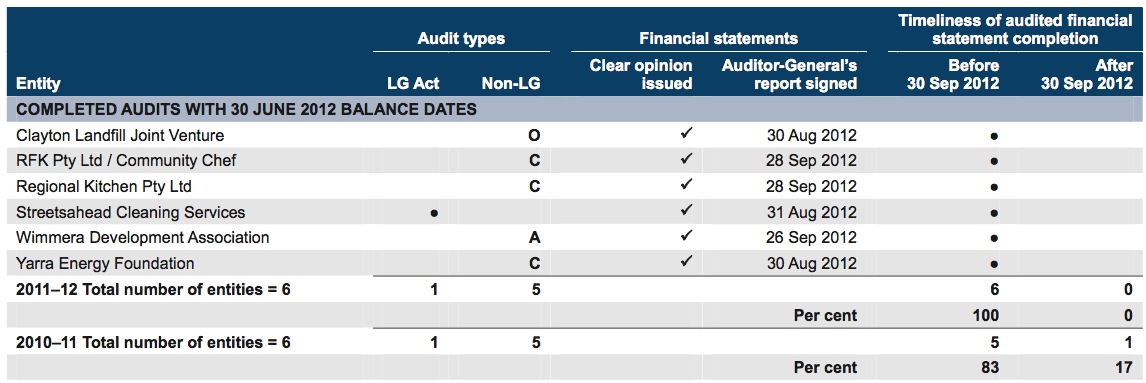
Note: Non-LG audit types: A – Associations Incorporation Act 1981, C – Corporations Act 2001 and O – other reporting framework.
Source: Victorian Auditor-General’s Office.
Overall totals
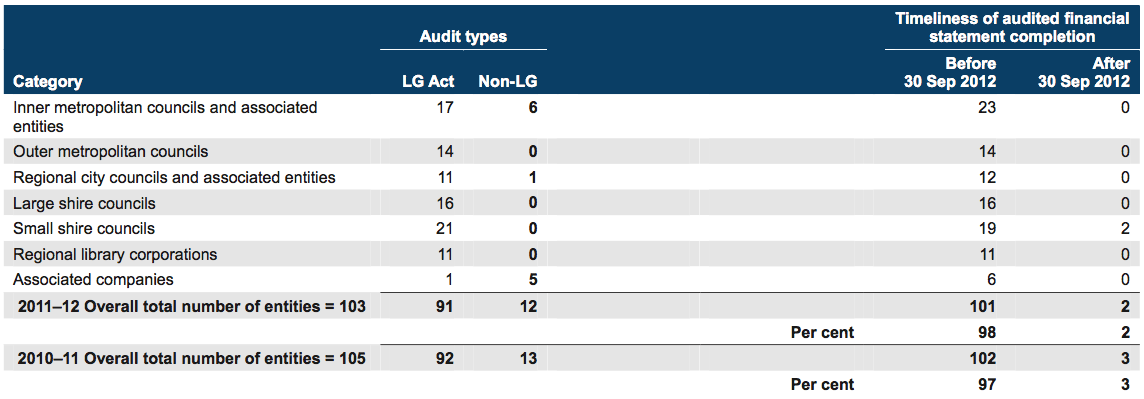
Source: Victorian Auditor-General’s Office.
Appendix B. VAGO reports on the results of audits
Figure B1
VAGO reports on the results of the 2011–12 financial audits
Report |
Description |
|---|---|
Auditor-General’s Report on the Annual Financial Report of the State of Victoria, 2011–12 |
The report provided the result of the audit of the state’s annual financial report. It addressed the quality and timeliness of financial reporting, explained significant financial results for the state and financial implications of significant projects and developments that occurred during 2011–12 and subsequent to year end. Tabled in Parliament on 14 November 2012. |
Public Hospitals: Results of the 2011–12 Audits |
The report provided the results of the audits of approximately 110 entities, addressed the timeliness of their financial reporting, their financial sustainability, reviewed the operations of their audit committees, aspects of how they managed capital projects and analysed self-generated hospital revenue. Tabled in Parliament on 14 November 2012. |
Water Entities: Results of the 2011–12 Audits |
The report provided the results of the audits of 20 entities and addresses the timeliness of their financial and performance reporting, their financial sustainability, aspects of how they manage risks and an analysis of water tariff revenue. Tabled in Parliament on 14 November 2012. |
Portfolio Departments and Associated Entities: Results of the 2011–12 Audits |
The report provided the results of the annual financial statement audits of approximately 210 entities. The report comments on the timeliness of their financial reporting, financial sustainability and reporting developments, and aspects of how the departments manage risks, appropriations and trust funds. Tabled in Parliament on 28 November 2012. |
Local Government: Results of the 2011–12 Audits This report. |
This report provides the results of the audits of approximately 100 entities in the local government sector. The report addresses the timeliness of their financial and performance reporting, their financial sustainability, and aspects of how they manage their budget processes and outsourced arrangements. Tabled in Parliament on 28 November 2012. |
Tertiary Education and Other Entities: Results of the 2012 Audits |
The report will provide the results of the annual financial audits of approximately 120 entities with a financial year other than 30 June 2012. The report will address the timeliness of their financial and performance reporting, their financial sustainability, a review of their utilisation of internal audit, and credit card security controls and usage. Proposed to be tabled in Parliament in May 2013. |
Source: Victorian Auditor-General’s Office.
Appendix C. Frameworks
Financial audit framework
The financial audit framework applied in the conduct of the 2011–12 audits of the local government sector is set out in Figure C1.
Figure C1
Financial audit framework
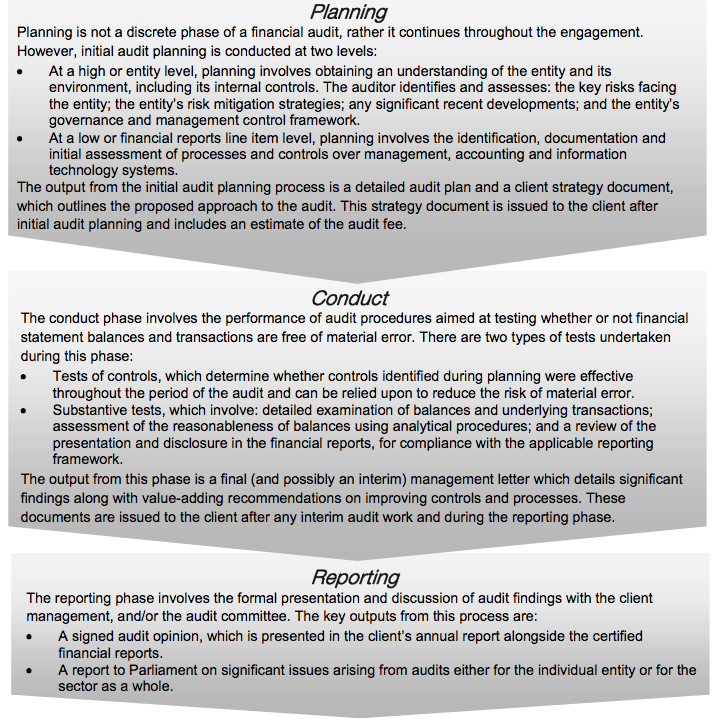
Source: Victorian Auditor-General’s Office.
Internal control framework
Figure C2 identifies the main components of an effective internal control framework.
Figure C2
Internal control framework
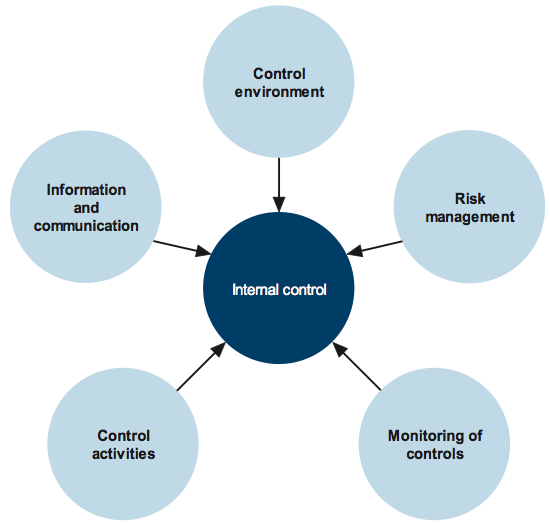
Source: Victorian Auditor-General’s Office.
Financial report preparation
Our assessment of council financial reporting performance against better practice was also based on criteria outlined in Figure C3.
Figure C3
Financial report preparation better practice
Key area |
Better practice |
|---|---|
Financial report preparation plan |
Establish a plan that outlines the processes, resources, milestones, oversight, and quality assurance practices required in preparing the financial report. |
Preparation of shell statements |
Prepare a shell financial report and provide it to the auditors early to enable early identification of amendments, minimising the need for significant disclosure changes at year-end. |
Materiality assessment |
Assess materiality, including quantitative and qualitative thresholds, at the planning phase in consultation with the audit committee. The assessment assists preparers to identify potential errors in the financial report. |
Monthly financial reporting |
Adopt full accrual monthly reporting to assist in preparing the annual financial report. This allows the year-end process to be an extension of the month-end process. |
Quality control and assurance procedures |
Require rigorous review of the supporting documentation, data and the financial report itself by an appropriately experienced and independent officer prior to providing it to the auditors. |
Supporting documentation |
Prepare high-standard documentation to support and validate the financial report and provide a management trail. |
Analytical reviews |
Undertake rigorous and objective analytical review during the financial report preparation process to help to improve the accuracy of the report. |
Reviews of controls/ self-assessment |
Establish sufficiently robust quality control and assurance processes to provide assurance to the audit committee on the accuracy and completeness of the financial report. |
Competency of staff |
Preparers of the financial report have a good understanding of, and experience in, applying relevant accounting standards and legislation. They should also have project management and interpersonal skills. |
Financial compliance reviews |
Undertake periodic compliance reviews to identify areas of noncompliance or changes to legislation that impact the financial report. |
Adequate security |
Protect and safeguard sensitive information throughout the process to prevent inappropriate public disclosure. |
Source: Victorian Auditor-General’s Office, and Australian National Audit Office Better Practice Guide Preparation of Financial Statements, June 2009.
Performance indicators assessment
Figure C4 identifies the audit assessment of council performance indicators.
Figure C4
Audit assessment of performance indicators
Principles |
Details |
|---|---|
Appropriate |
Performance indicators should be reported with appropriate context to allow community members to interpret results. Targets, trend data and an explanation of the result should be provided to allow members of the community without technical knowledge to draw meaningful conclusions about the performance of the council. |
Relevant |
To be comprehensive, indicators should be relevant to council objectives. Objectives should be clearly expressed and measurable, and there should be a clear nexus between objectives and performance indicators. Performance indicators should also cover all critical aspects of objectives and align with services. |
Balanced |
Performance indicators should cover the time, cost, quantity and quality of service provision, as well as the outcomes of council activity. A single indicator is typically not able to measure each of these aspects, therefore a suite of indicators is usually required to provide balanced performance information. |
Fairly represents |
To fairly represent performance, the information provided must be capable of measurement, represent what it purports to indicate consistently and without bias, and be accurate and auditable. |
Auditable |
The data supporting the performance indicators should be quantifiable, consistent and verifiable. The information upon which the indicators are based is collected, recorded and analysed in such a way that the conclusions drawn from it can be verified. |
Source: Victorian Auditor-General’s Office.
Appendix D. Acquittal audits
Figure D1
Acquittal opinions issued for 30 June 2012 year
Acquittal opinion |
||
|---|---|---|
Council |
Nation Building Program |
Date signed |
COMPLETED AQUITTALS WITH 30 JUNE 2012 BALANCE DATES |
||
Ararat Rural City Council |
Yes |
01 Oct 2012 |
Ballarat City Council |
Yes |
02 Oct 2012 |
Banyule City Council |
Yes |
26 Oct 2012 |
Bass Coast Shire Council |
Yes |
15 Nov 2012 |
Baw Baw Shire Council |
Yes |
17 Oct 2012 |
Bayside City Council |
Yes |
01 Nov 2012 |
Benalla Rural City Council |
Yes |
17 Oct 2012 |
Boroondara City Council |
Yes |
16 Oct 2012 |
Brimbank City Council |
Yes |
26 Oct 2012 |
Buloke Shire Council |
Yes |
30 Oct 2012 |
Campaspe Shire Council |
Yes |
19 Sep 2012 |
Cardinia Shire Council |
Yes |
18 Oct 2012 |
Casey City Council |
Yes |
31 Oct 2012 |
Central Goldfields Shire Council |
Yes |
31 Oct 2012 |
Corangamite Shire Council |
Yes |
12 Oct 2012 |
Darebin City Council |
Yes |
26 Oct 2012 |
East Gippsland Shire Council |
Yes |
31 Oct 2012 |
Frankston City Council |
Yes |
31 Oct 2012 |
Gannawarra Shire Council |
Yes |
19 Sep 2012 |
Glen Eira City Council |
Yes |
19 Sep 2012 |
Glenelg Shire Council |
Yes |
30 Oct 2012 |
Golden Plains Shire Council |
Yes |
01 Oct 2012 |
Greater Bendigo City Council |
Yes |
29 Oct 2012 |
Greater Dandenong City Council |
Yes |
19 Oct 2012 |
Greater Geelong City Council |
Yes |
24 Oct 2012 |
Greater Shepparton City Council |
Yes |
29 Oct 2012 |
Hepburn Shire Council |
Yes |
15 Oct 2012 |
Hindmarsh Shire Council |
Yes |
31 Oct 2012 |
Hobsons Bay City Council |
Yes |
12 Nov 2012 |
Horsham Rural City Council |
Yes |
09 Oct 2012 |
Kingston City Council |
Yes |
24 Oct 2012 |
Knox City Council |
Yes |
24 Sep 2012 |
Indigo Shire Council |
Yes |
30 Oct 2012 |
Latrobe City Council |
Yes |
01 Oct 2012 |
Loddon Shire Council |
Yes |
02 Oct 2012 |
Macedon Ranges Shire Council |
Yes |
19 Sep 2012 |
Manningham City Council |
Yes |
19 Oct 2012 |
Mansfield Shire Council |
Yes |
17 Oct 2012 |
Maribyrnong City Council |
Yes |
31 Oct 2012 |
Maroondah City Council |
Yes |
02 Oct 2012 |
Melbourne City Council |
Yes |
09 Oct 2012 |
Melton Shire Council |
Yes |
09 Oct 2012 |
Mildura Rural City Council |
Yes |
02 Oct 2012 |
Mitchell Shire Council |
Yes |
07 Nov 2012 |
Moira Shire Council |
Yes |
17 Oct 2012 |
Monash City Council |
Yes |
19 Sep 2012 |
Moonee Valley City Council |
Yes |
01 Oct 2012 |
Moorabool Shire Council |
Yes |
02 Oct 2012 |
Mount Alexander Shire Council |
Yes |
02 Oct 2012 |
Moyne Shire Council |
Yes |
17 Oct 2012 |
Nillumbik Shire Council |
Yes |
28 Sep 2012 |
Northern Grampians Shire Council |
Yes |
12 Sep 2012 |
Port Phillip City Council |
Yes |
24 Oct 2012 |
Pyrenees Shire Council |
Yes |
27 Sep 2012 |
South Gippsland Shire Council |
Yes |
26 Oct 2012 |
Southern Grampians Shire Council |
Yes |
26 Oct 2012 |
Stonnington City Council |
Yes |
29 Oct 2012 |
Strathbogie Shire Council |
Yes |
18 Oct 2012 |
Swan Hill Rural City Council |
Yes |
02 Oct 2012 |
Towong Shire Council |
Yes |
17 Oct 2012 |
Wangaratta Rural City Council |
Yes |
02 Oct 2012 |
Warrnambool City Council |
Yes |
31 Oct 2012 |
Wellington Shire Council |
Yes |
26 Oct 2012 |
West Wimmera Shire Council |
Yes |
02 Oct 2012 |
Whitehorse City Council |
Yes |
19 Sep 2012 |
Wodonga City Council |
Yes |
02 Oct 2012 |
Yarra City Council |
Yes |
05 Oct 2012 |
Yarra Ranges Shire Council |
Yes |
31 Oct 2012 |
Yarriambiack Shire Council |
Yes |
15 Oct 2012 |
Total issued |
69 |
|
Source: Victorian Auditor-General’s Office.
Appendix E. Financial sustainability
Indicators reflect short- and long-term sustainability and are measured by:
- underlying result—councils generate enough revenue to cover operating costs (including the cost of replacing assets reflected in depreciation expense)
- liquidity—councils have sufficient working capital to meet short-term commitments
- self-financing—councils generate sufficient operating cash flows to invest in asset renewal and repay any debt that may have been incurred in the past
- indebtedness—councils are not overly reliant on debt to fund capital programs
- capital replacement—councils have been replacing assets at a rate consistent with their consumption
- renewal gap—councils have been maintaining existing assets at a consistent rate.
Figure
E1
Financial sustainability indicators for councils
Indicator |
Formula |
Description |
|---|---|---|
Underlying result (per cent) |
Adjusted net surplus/ total underlying revenue |
A positive result indicates a surplus. The larger the percentage, the stronger the result. A negative result indicates a deficit. Operating deficits cannot be sustained in the long term. Underlying revenue does not take into account non-cash developer contributions and other one-off (non‑recurring) adjustments. |
Liquidity |
Current assets/ current liabilities |
Measures the ability to pay existing liabilities in the next 12 months. A ratio higher than 1:1 means there is more cash and liquid assets than short‑term liabilities. |
Self-financing (per cent) |
Net operating cash flows/ underlying revenue |
Measures the ability to replace assets using cash generated by the entity’s operations. The higher the percentage, the more effectively this can be done. |
Indebtedness (per cent) |
Non-current liabilities/ own-sourced revenue |
Comparison of non-current liabilities (mainly comprised of borrowings) to own-sourced revenue. The higher the percentage, the less able to cover non‑current liabilities from the revenues the entity generates itself. Own-sourced revenue is used (rather than total revenue) because it does not include capital grants, which are usually tied to specific projects. |
Capital replacement |
Capital expenditure/ depreciation |
Comparison of the rate of spending on infrastructure with its depreciation. Ratios higher than 1:1 indicate that spending is faster than the depreciation rate. This is a long-term indicator, as capital expenditure can be deferred in the short‑term if there are insufficient funds available from operations, and borrowing is not an option. |
Renewal gap |
Renewal and upgrade expenditure/depreciation |
Comparison of the rate of spending on existing assets through renewing, restoring, and replacing existing assets with depreciation. Ratios higher than 1:1 indicate that spending on existing assets is greater than the depreciation rate. Similar to the investment gap, this is a long‑term indicator, as capital expenditure can be deferred in the short term if there are insufficient funds available from operations, and borrowing is not an option. |
Source: Victorian Auditor-General’s Office.
Figure
E2
Risk assessment criteria for financial sustainability indicators
Risk |
Underlying result |
Liquidity |
Indebtedness |
Self-financing |
Capital replacement |
Renewal gap |
|---|---|---|---|---|---|---|
High |
Negative 10% or less |
Equal to or less than 1.0 |
More than 60% |
Less than 10% |
Equal to or less than 1.0 |
Equal to or less than 0.5 |
Insufficient revenue is being generated to fund operations and asset renewal. |
Insufficient current assets to cover liabilities. |
Potentially long-term concern over ability to repay debt levels from own‑source revenue. |
Insufficient cash from operations to fund new assets and asset renewal. |
Spending on capital works has not kept pace with consumption of assets. |
Spending on existing assets has not kept pace with consumption of these assets. |
|
Medium |
Negative 10% to zero |
1.0–1.5 |
40–60% |
10–20% |
1.0–1.5 |
0.5–1.0 |
A risk of long‑term run‑down to cash reserves and inability to fund asset renewals. |
Need for caution with cash flow, as issues could arise with meeting obligations as they fall due. |
Some concern over the ability to repay debt from own‑source revenue. |
May not be generating sufficient cash from operations to fund new assets. |
May indicate spending on asset renewal is insufficient. |
May indicate insufficient spending on renewal of existing assets. |
|
Low |
More than zero |
More than 1.5 |
40% or less |
20% or more |
More than 1.5 |
More than 1.0 |
Generating surpluses consistently. |
No immediate issues with repaying short-term liabilities as they fall due. |
No concern over the ability to repay debt from own‑source revenue. |
Generating enough cash from operations to fund assets. |
Low risk of insufficient spending on asset renewal. |
Low risk of insufficient spending on asset base. |
Source: Victorian Auditor-General’s Office.
The overall financial sustainability risk assessment is calculated using the ratings determined for each indicator as shown in Figure E3.
Figure
E3
Overall financial sustainability risk assessment
|
|
High risk of short-term and immediate sustainability concerns indicated by either:
|
|
|
Medium risk of longer-term sustainability concerns indicated by either:
|
|
|
Low risk of financial sustainability concerns—there are no high-risk indicators. |


Source: Victorian Auditor-General’s Office.
A trend analysis uses actual figures for the previous five years and a trend analysis using forecast figures for the following three years. The sustainability indicators are colour coded in line with the risk assessment criteria. The legend in Figure E4 is used in presenting the results of our assessments.
Figure
E4
Legend for financial sustainability tables
|
|
Downward trend |
|
|
No substantial trend |
|
|
Upward trend |


Source: Victorian Auditor-General’s Office.
Inner metropolitan councils
Figure E5
Financial sustainability risk assessment results 2011–12
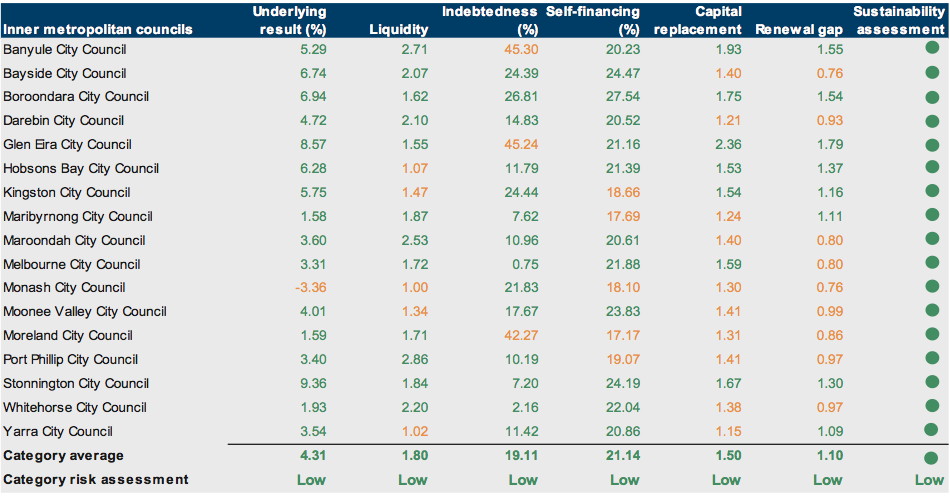
Source: Victorian Auditor-General’s Office.
Figure
E6
Underlying result (%) 2008–2011
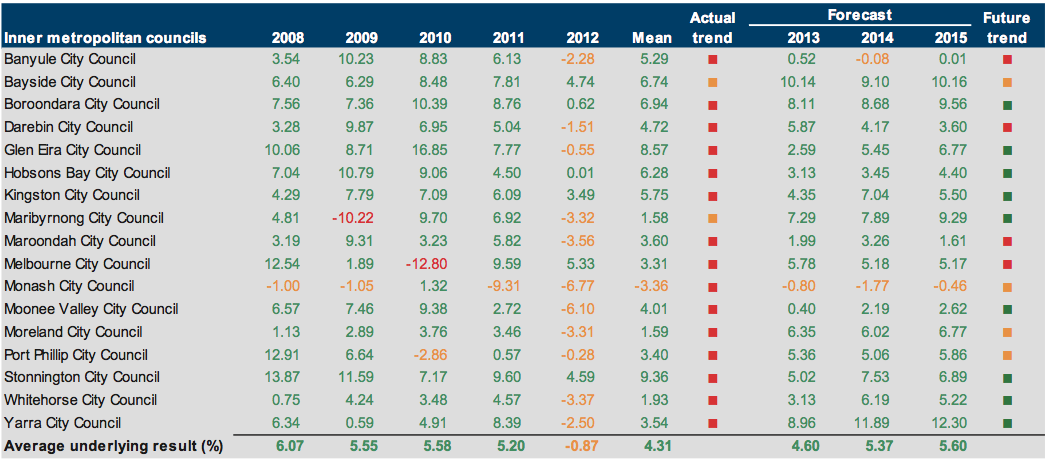
Source: Victorian Auditor-General’s Office.
Figure
E7
Liquidity (ratio) 2008–2012
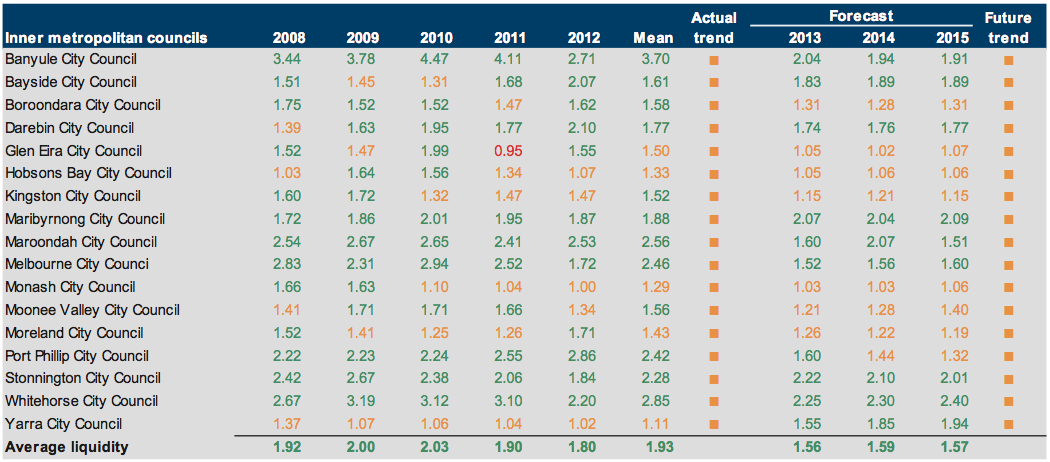
Source: Victorian Auditor-General’s Office.
Figure
E8
Indebtedness (%) 2008–2012
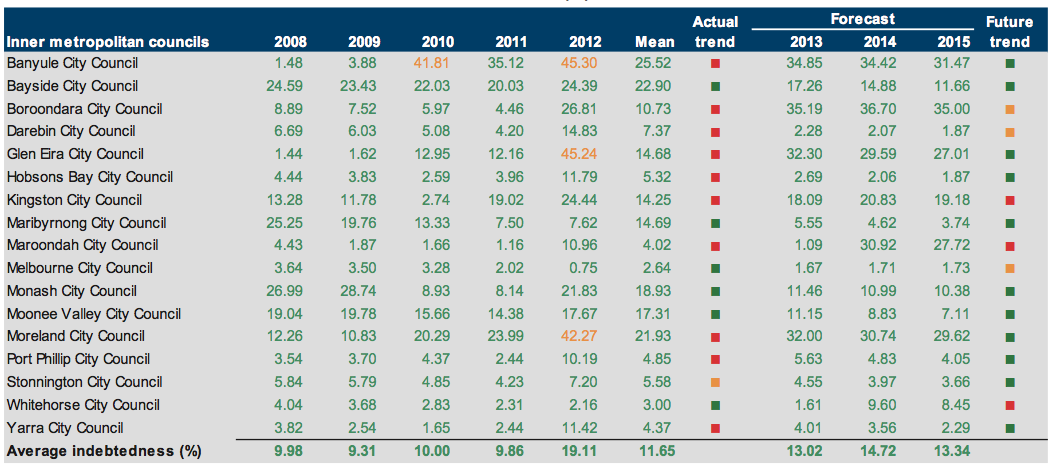
Source: Victorian Auditor-General’s Office.
Figure
E9
Self-financing (%) 2008–2012
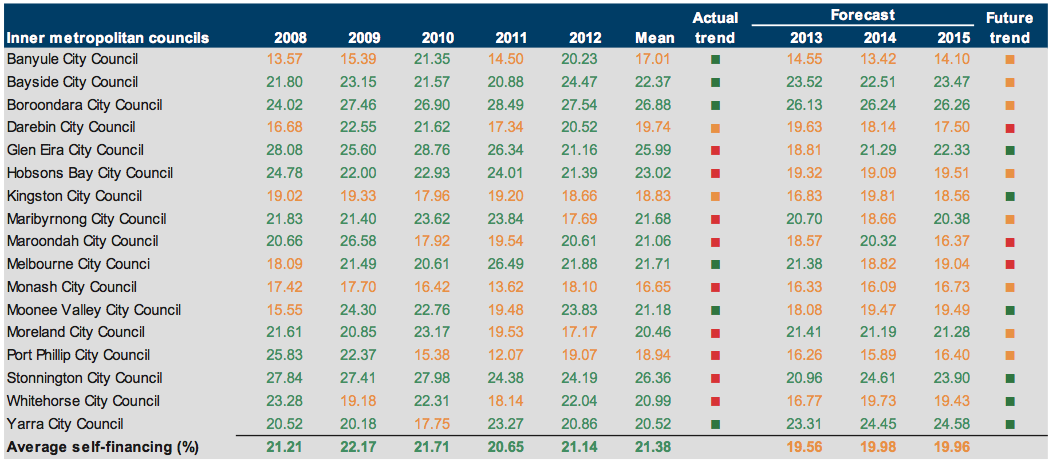
Source: Victorian Auditor-General’s Office.
Figure
E10
Capital replacement (ratio) 2008–2012
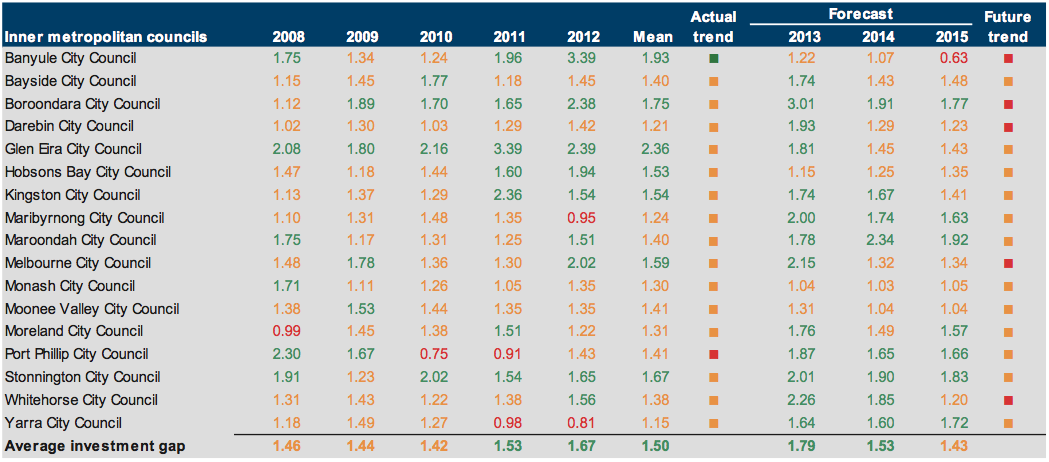
Source: Victorian Auditor-General’s Office.
Figure
E11
Renewal gap (ratio) 2008–2012
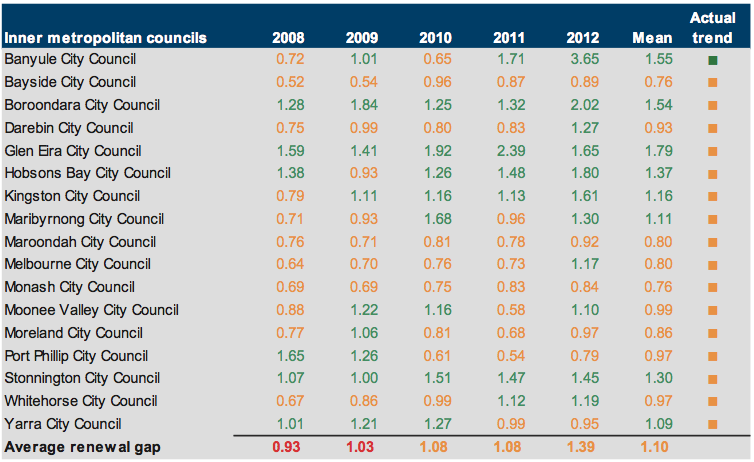
Source: Victorian Auditor-General’s Office.
Outer metropolitan councils
Figure
E12
Financial sustainability risk assessment results 2011–12
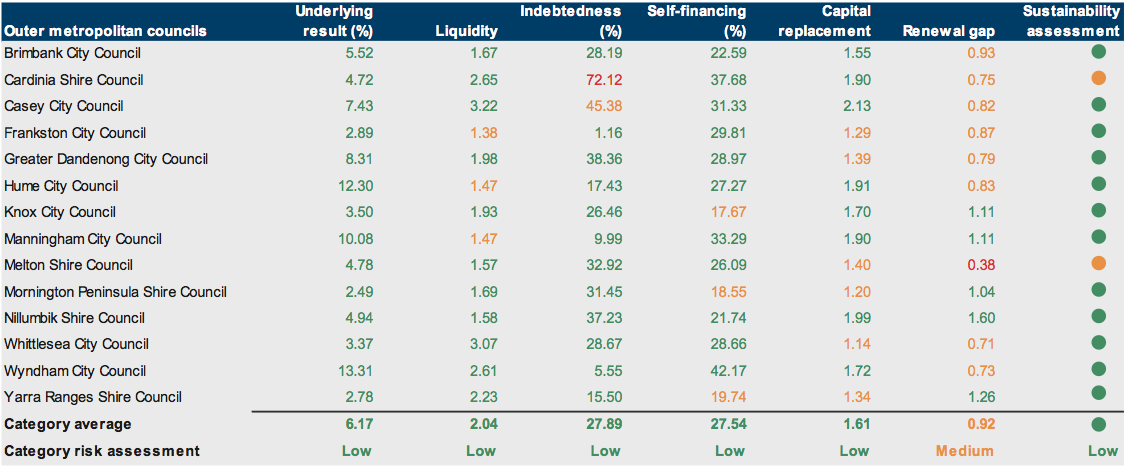
Source: Victorian Auditor-General’s Office.
Figure
E13
Underlying result (%) 2008–2012
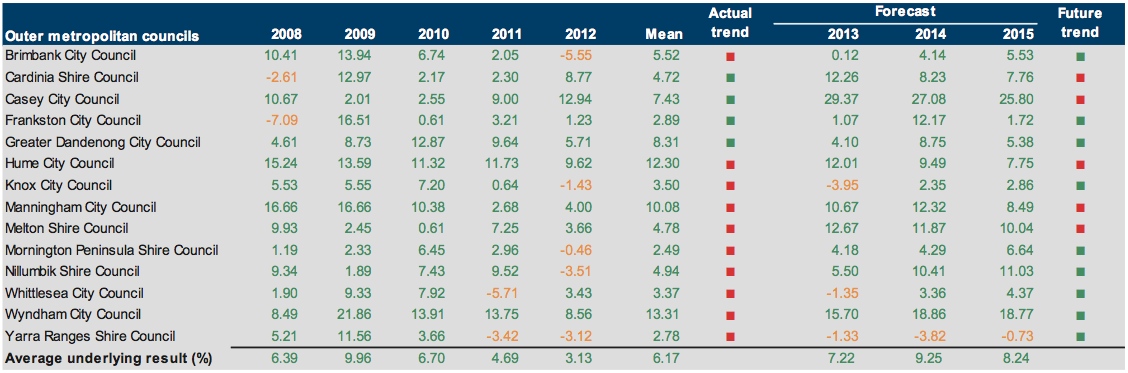
Source: Victorian Auditor-General’s Office.
Figure
E14
Liquidity (ratio) 2008–2012
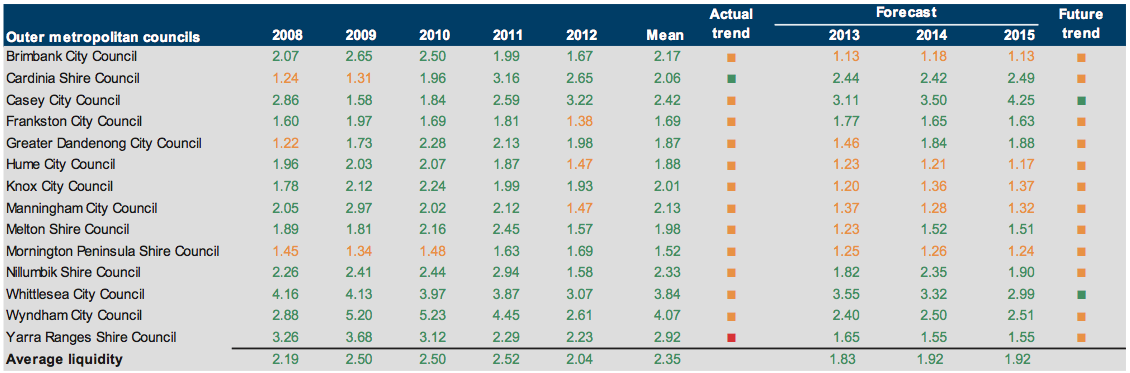
Source: Victorian Auditor-General’s Office.
Figure
E15
Indebtedness (%) 2008–2012
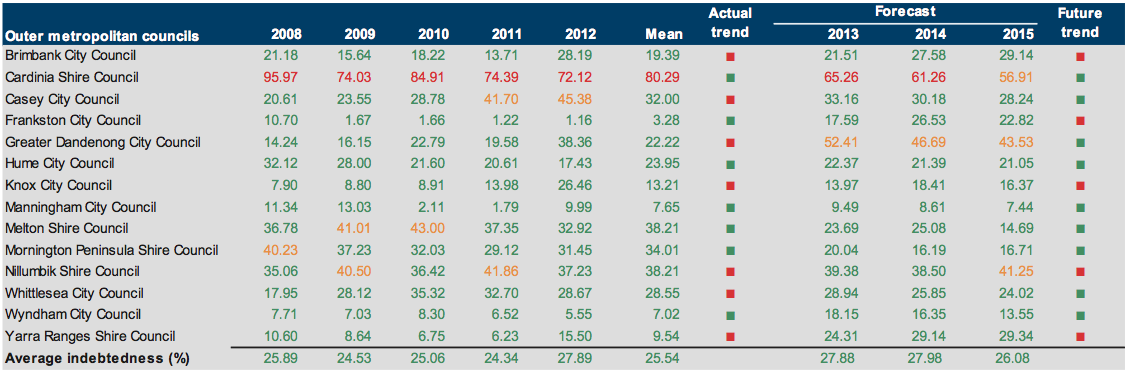
Source: Victorian Auditor-General’s Office.
Figure
E16
Self-financing (%) 2008–2012
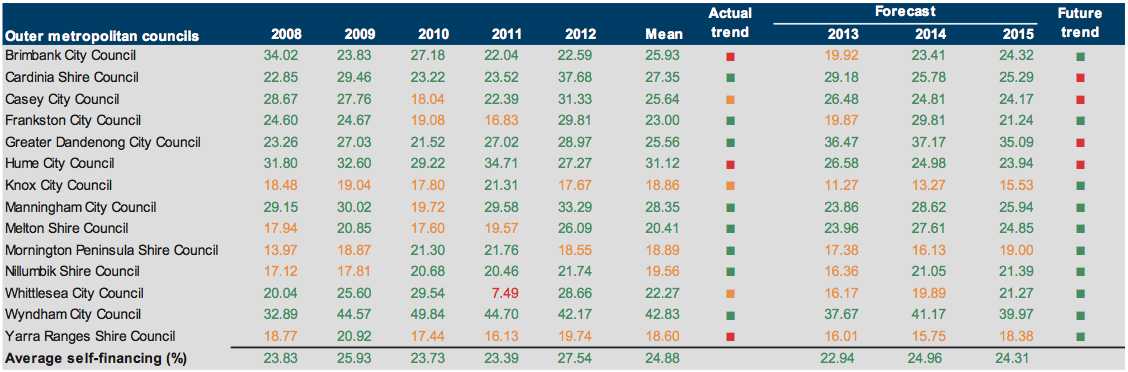
Source: Victorian Auditor-General’s Office.
Figure
E17
Capital replacement (ratio) 2008–2012
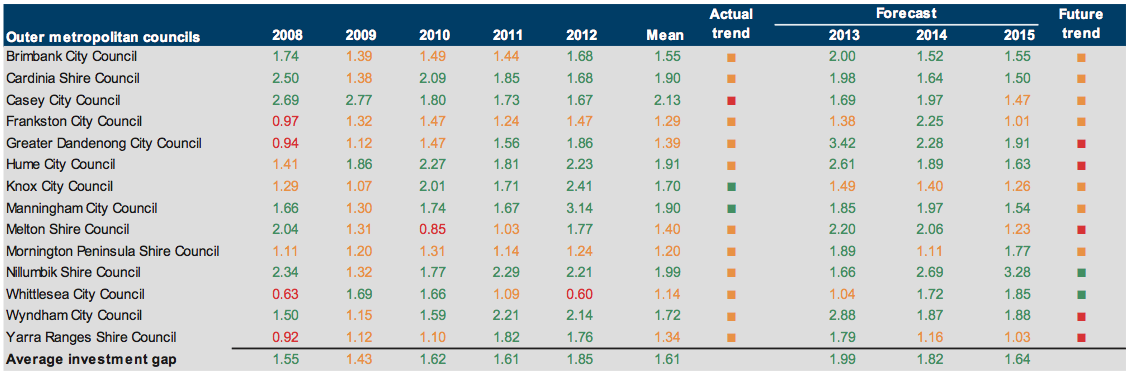
Source: Victorian Auditor-General’s Office.
Figure
E18
Renewal gap (ratio) 2008–2012
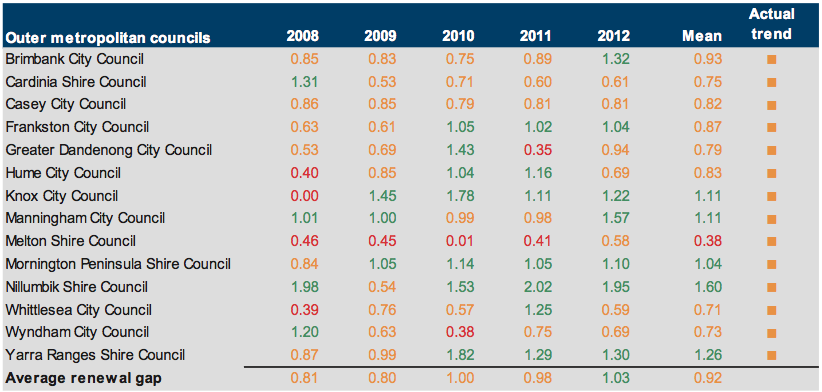
Source: Victorian Auditor-General’s Office.
Regional city councils
Figure
E19
Financial sustainability risk assessment results 2011–12
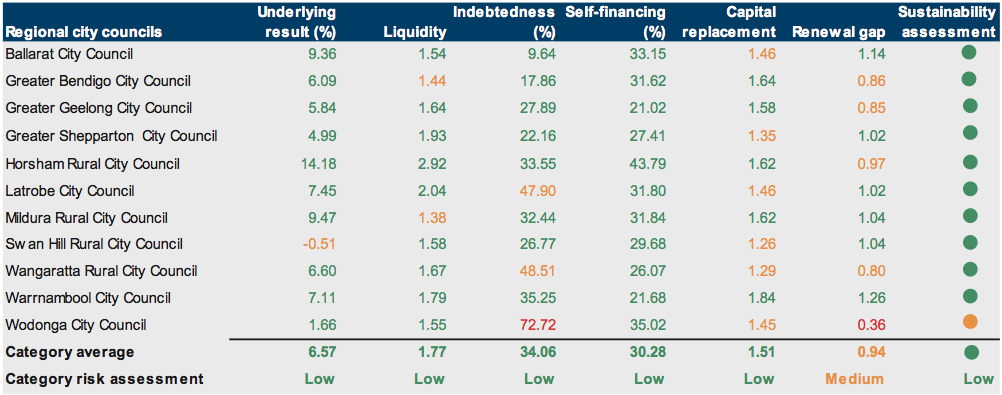
Source: Victorian Auditor-General’s Office.
Figure
E20
Underlying result (%) 2008–2012
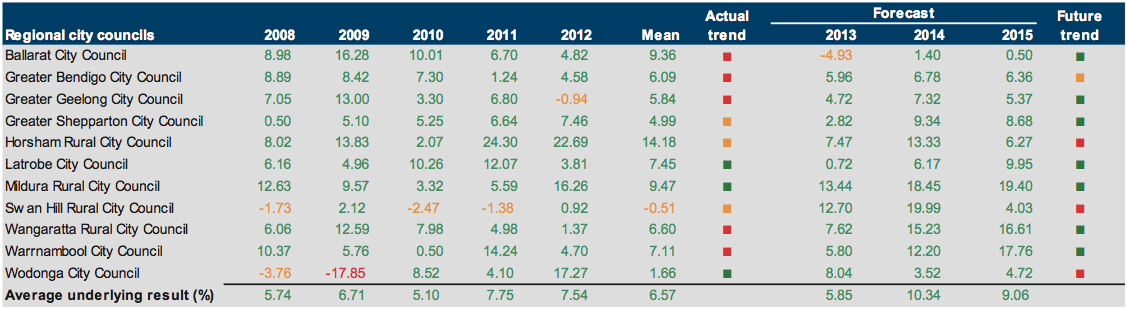
Source: Victorian Auditor-General’s Office.
Figure
E21
Liquidity (ratio) 2008–2012
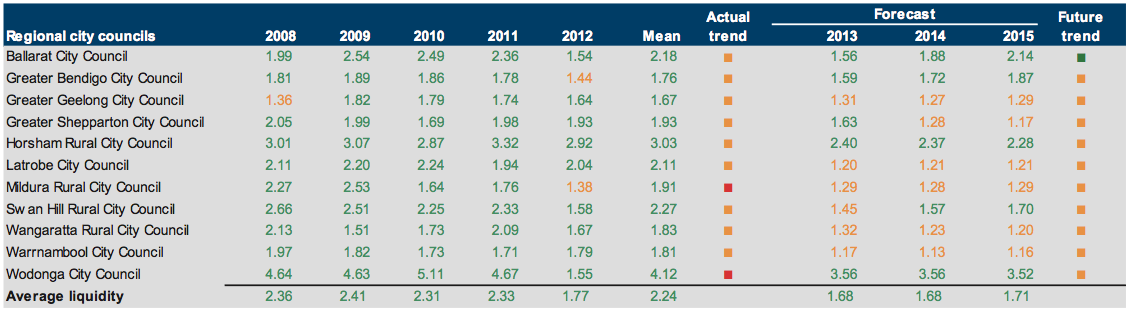
Source: Victorian Auditor-General’s Office.
Figure
E22
Indebtedness (%) 2008–2012
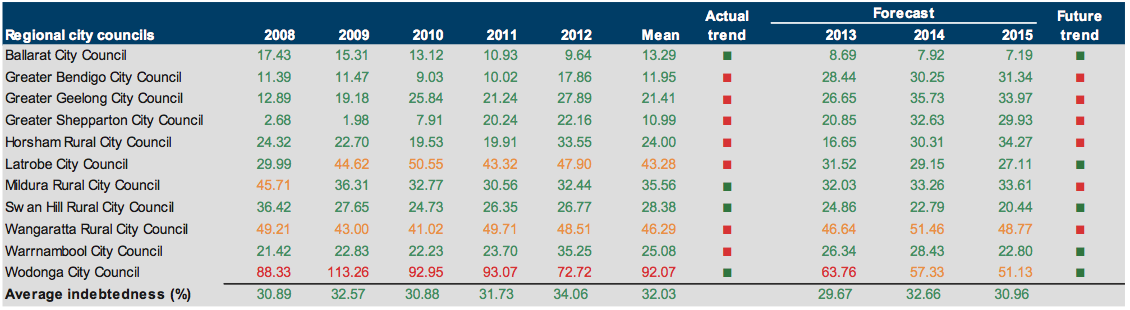
Source: Victorian Auditor-General’s Office.
Figure
E23
Self-financing (%) 2008–2012
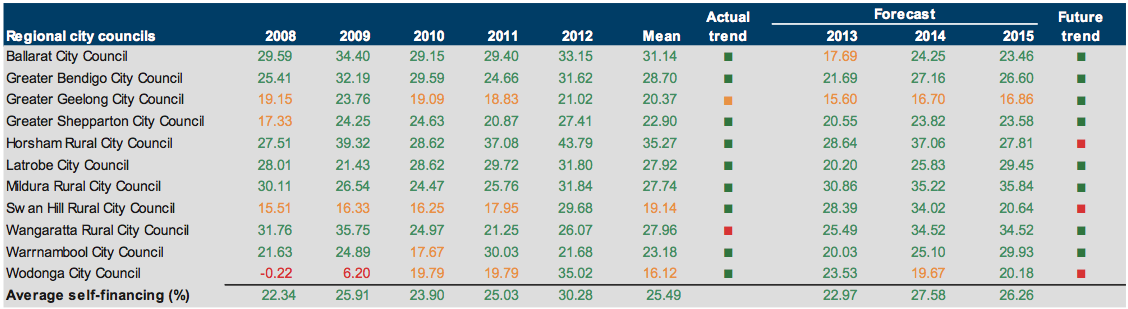
Source: Victorian Auditor-General’s Office.
Figure
E24
Capital replacement (ratio) 2008–2012
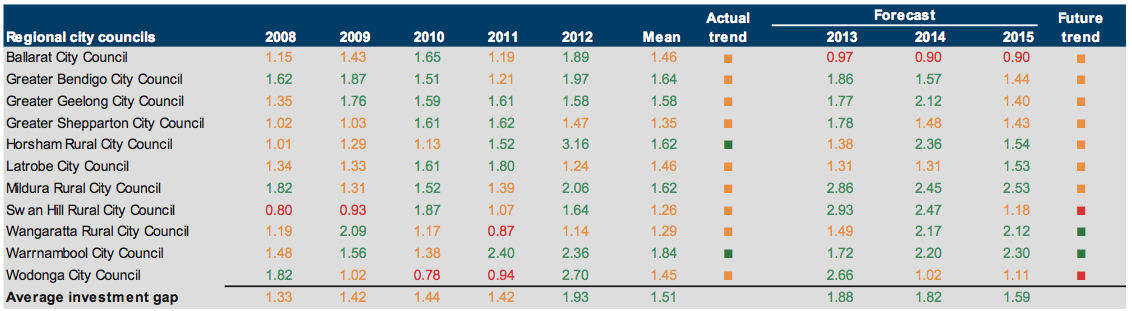
Source: Victorian Auditor-General’s Office.
Figure
E25
Renewal gap (ratio) 2008–2012
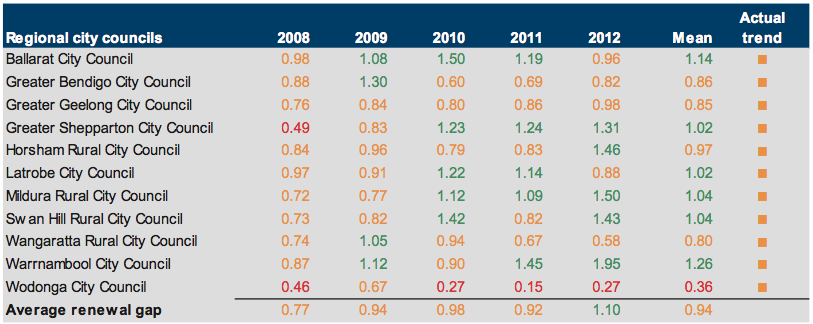
Source: Victorian Auditor-General’s Office.
Large shire councils
Figure
E26
Financial sustainability risk assessment results 2011–12
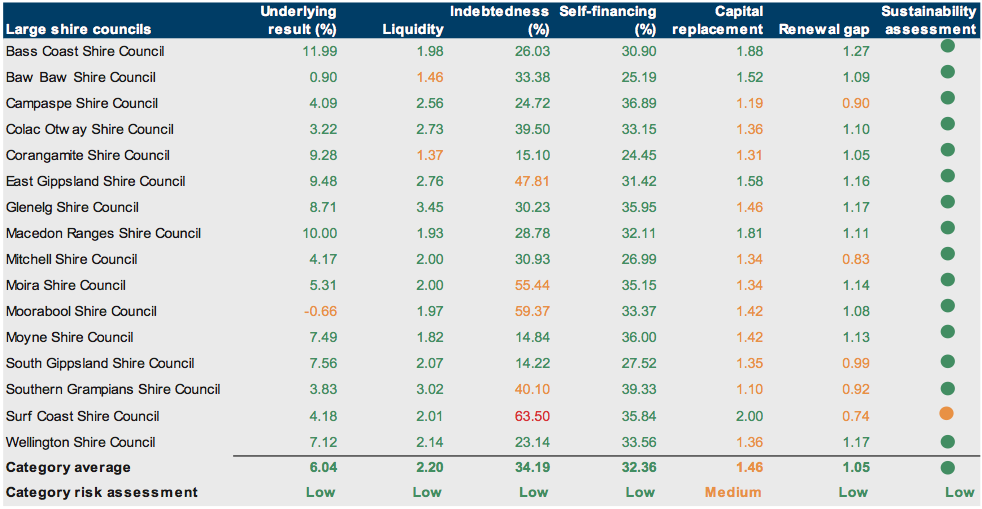
Source: Victorian Auditor-General’s Office.
Figure
E27
Underlying result (%) 2008–2012
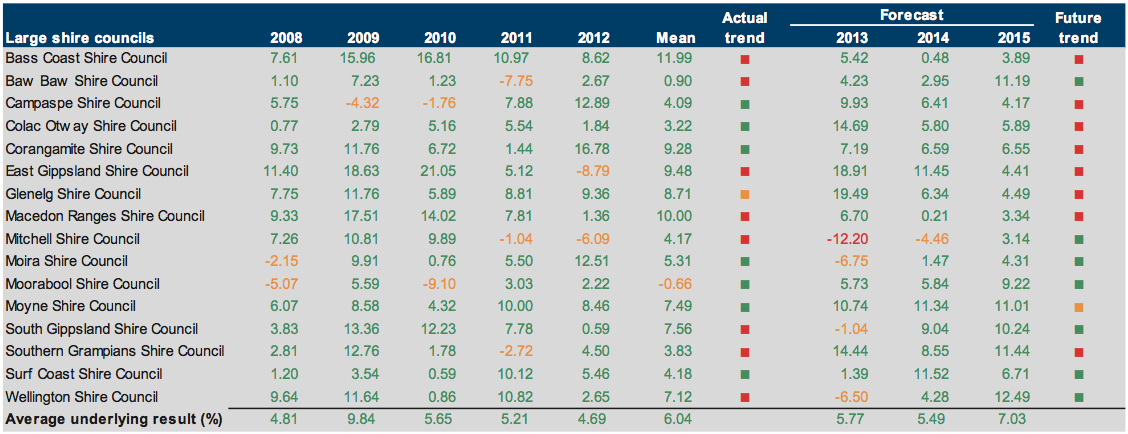
Source: Victorian Auditor-General’s Office.
Figure
E28
Liquidity (ratio) 2008–2012
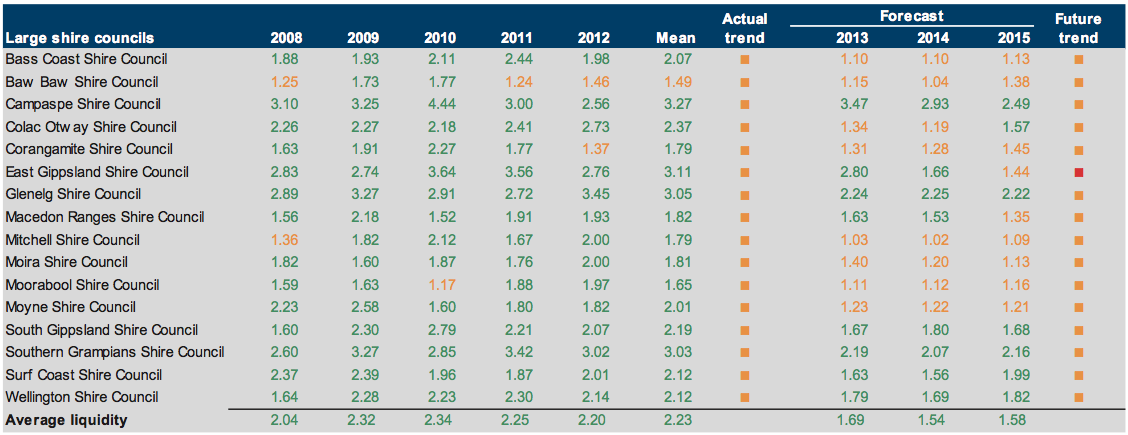
Source: Victorian Auditor-General’s Office.
Figure
E29
Indebtedness (%) 2008–2012
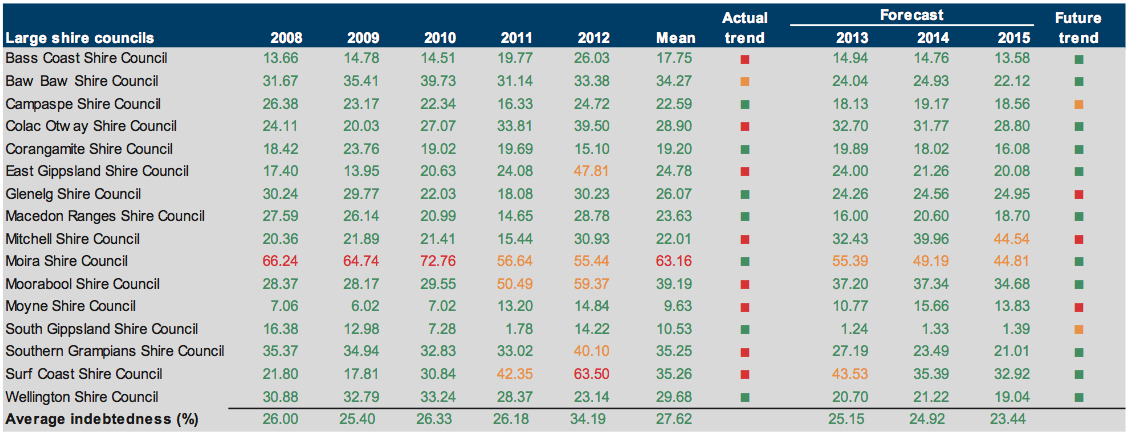
Source: Victorian Auditor-General’s Office.
Figure
E30
Self-financing (%) 2008–2012
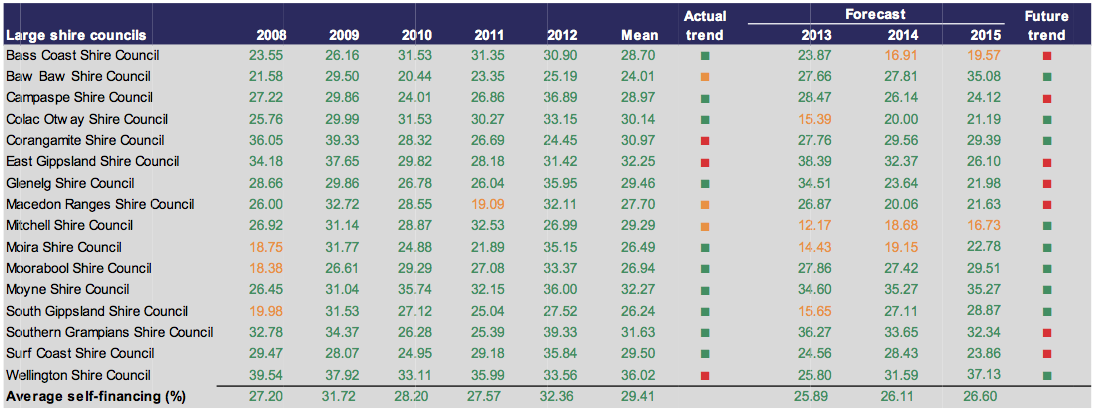
Source: Victorian Auditor-General’s Office.
Figure
E31
Capital replacement (ratio) 2008–2012
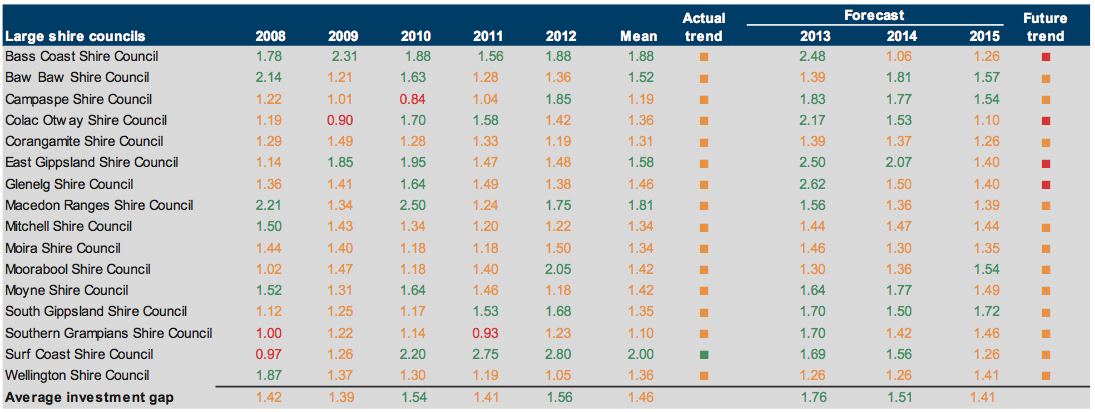
Source: Victorian Auditor-General’s Office.
Figure
E32
Renewal gap (ratio) 2008–2012
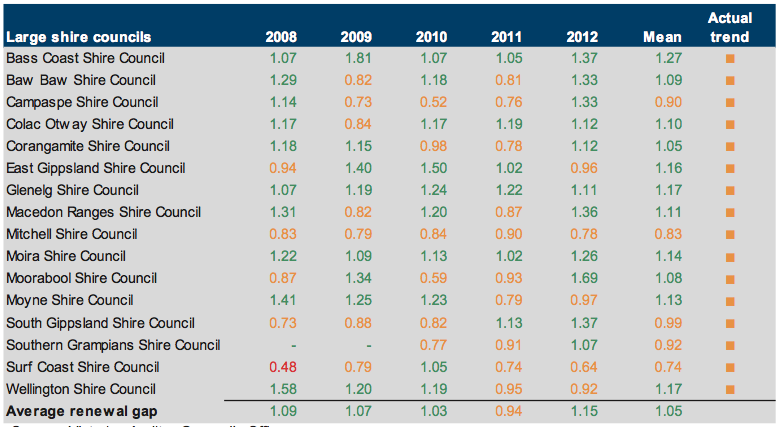
Source: Victorian Auditor-General’s Office.
Small shire councils
Figure
E33
Financial sustainability risk assessment results 2011–12
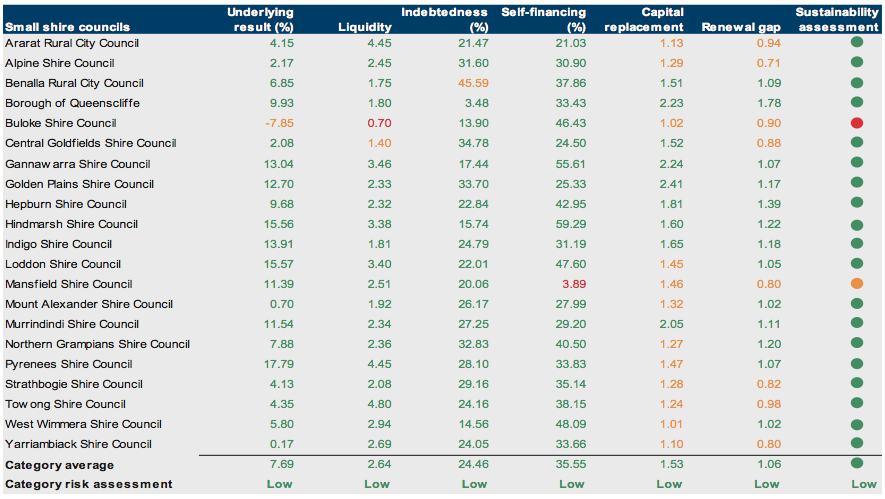
Source: Victorian Auditor-General’s Office.
Figure
E34
Underlying result (%) 2008–2012
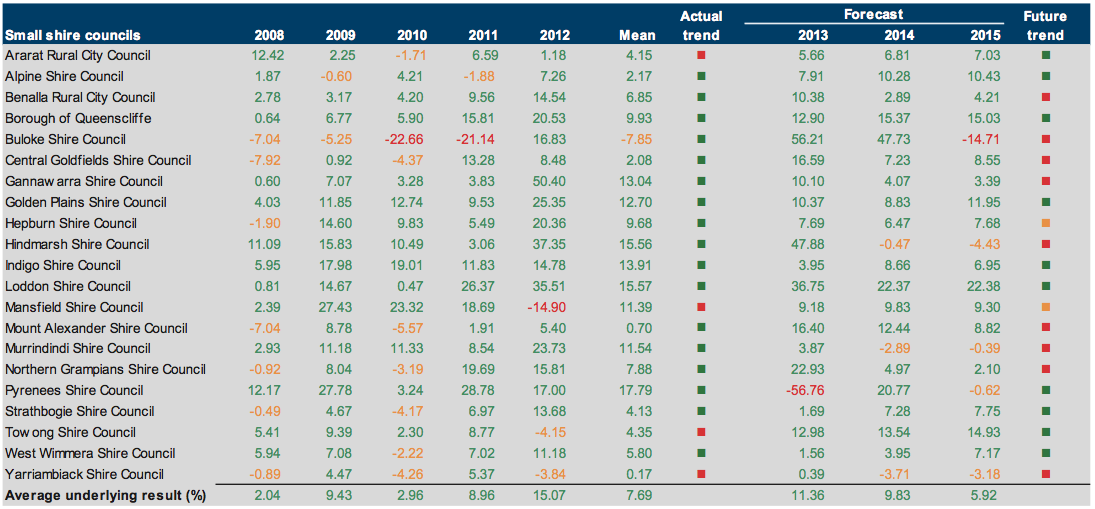
Source: Victorian Auditor-General’s Office.
Figure
E35
Liquidity (ratio) 2008–2012
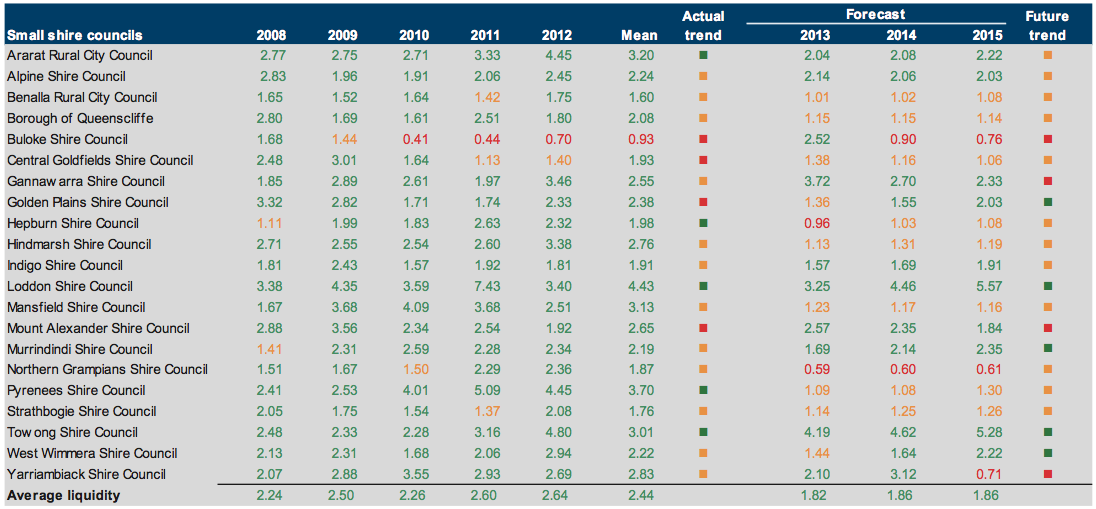
Source: Victorian Auditor-General’s Office.
Figure
E36
Indebtedness (%) 2008–2012
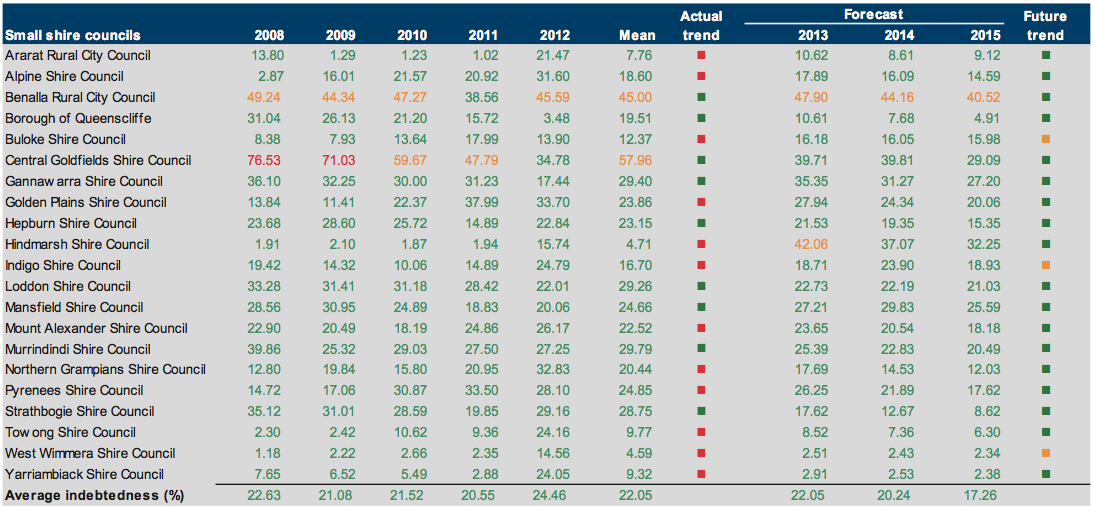
Source: Victorian Auditor-General’s Office.
Figure
E37
Self-financing (%) 2008–2012
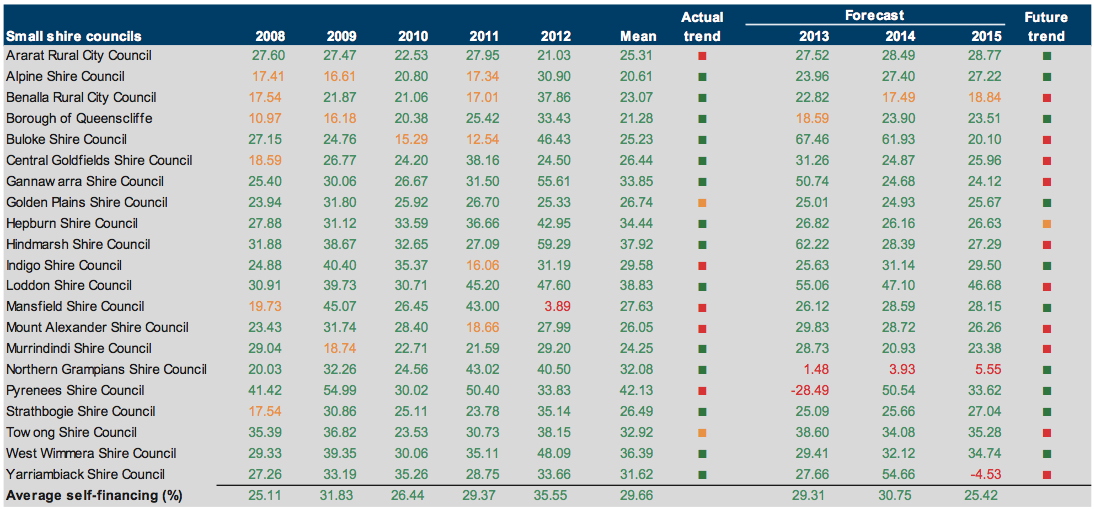
Source: Victorian Auditor-General’s Office.
Figure
E38
Capital replacement (ratio) 2008–2012
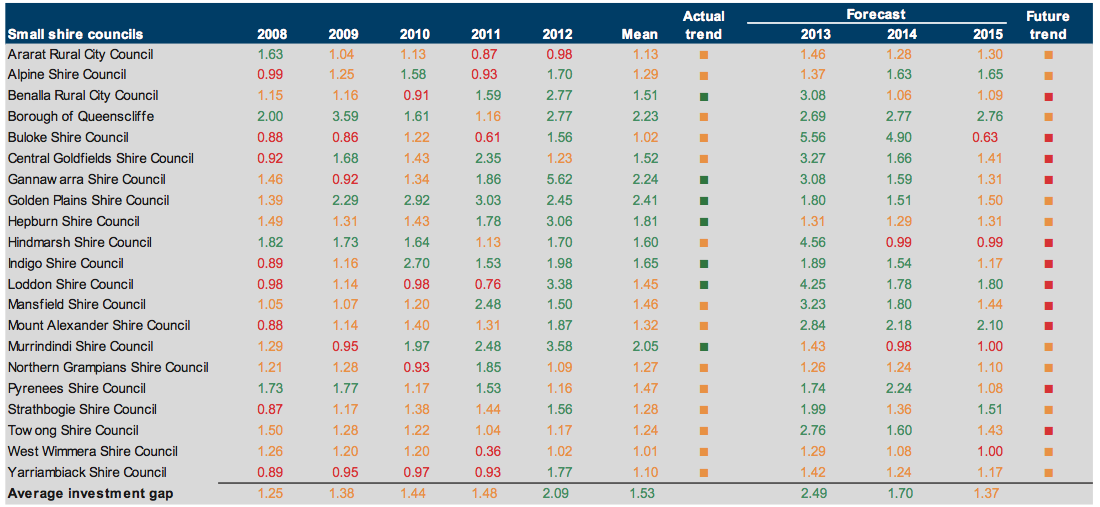
Source: Victorian Auditor-General’s Office.
Figure
E39
Renewal gap (ratio) 2008–2012
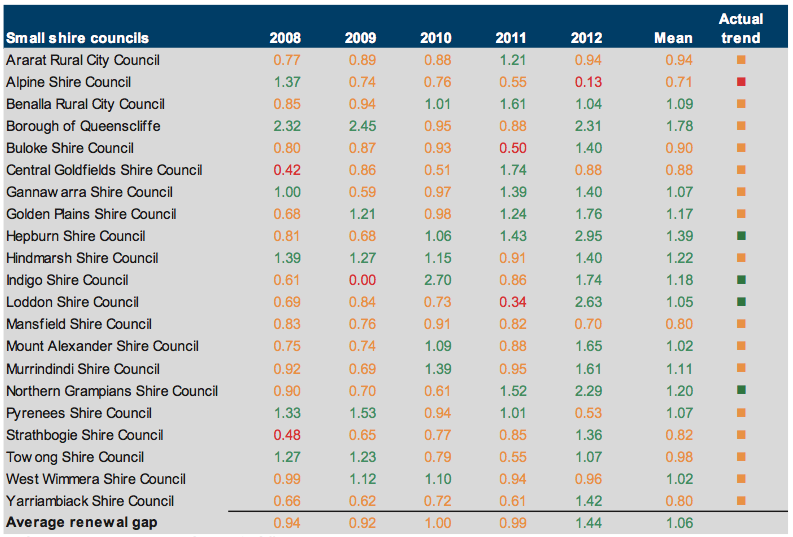
Source: Victorian Auditor-General’s Office.
Appendix F. Glossary
Glossary
Appropriate
Measures or indicators are appropriate if they provide users with sufficient information to assess the extent to which an entity has achieved a pre-determined target, goal or outcome.
Asset
A resource controlled by an entity as a result of past events, and from which future economic benefits are expected to flow to the entity.
Audit Act 1994
An Act of the State of Victoria that establishes the:
- operating powers and responsibilities of the Auditor-General
- the operation of his office - the Victorian Auditor-General’s Office (VAGO)
- nature and scope of audits conducted by VAGO
- relationship of the Auditor-General with the Public Accounts and Estimates Committee as the representative body of Parliament
- Auditor-General’s accountability to Parliament for discharge of the position’s responsibilities.
Auditor’s opinion
Written expression within a specified framework indicating the auditor’s overall conclusion on the financial (and performance) reports based on audit evidence obtained.
Clear audit opinion – financial statement
A positive written expression indicating that the financial statement has been prepared in accordance with the requirements of the relevant legislation and Australian accounting standards.
A clear or unqualified audit opinion is provided when the financial statement presents fairly the transactions and balances for the reporting period in accordance with the relevant legislative framework.
Clear audit opinion – financial report
A positive written expression provided when the financial report has been prepared and presents fairly the transactions and balances for the reporting period in accordance with the requirements of the relevant legislation and Australian Accounting Standards.
Also referred to as an unqualified audit opinion.
Clear audit opinion – performance report
A positive written expression provided when the performance report has been prepared and presents fairly the performance indicators and results of performance for the reporting period in accordance with the requirements of the relevant legislation.
Also referred to as an unqualified audit opinion.
Clear audit opinion – standard statements
A positive written expression provided when the standard statements have been prepared for the reporting period in accordance with the requirements of the relevant legislation.
Also referred to as an unqualified audit opinion.
Corporations Act 2001
An Act of the Commonwealth of Australia that sets out the laws dealing with business entities in Australia at federal and interstate levels. It focuses primarily on companies, although it also covers some laws relating to other entities such as partnerships and managed investment schemes.
Council
A group of councillors, who are the elected representatives of people who are residents in the council’s district or ratepayers of the council.
Deficit
Total expenditure exceeds total revenue, resulting in a loss.
Depreciation
The systematic allocation of a fixed asset’s capital value as an expense over its expected useful life to take account of normal usage, obsolescence, or the passage of time.
Emphasis of matter
An auditor’s report can include an emphasis of matter paragraph that draws attention to a disclosure or item in the financial report that is relevant to the users of the auditor’s report but is not of such nature that it affects the auditor’s opinion (i.e. the auditor’s opinion remains unmodified).
Employee leave liabilities
Employees’ accrued service entitlements, including all accrued costs related to employment comprising of wages and salaries, leave entitlements, redundancy payments and superannuation contributions.
Equity or net assets
Residual interest in the assets of an entity after deduction of its liabilities.
Expense
Outflows or other depletions of economic benefits in the form of incurrence of liabilities or depletion of assets of the entity, other than those relating to contributions by owners, that results in a decrease in equity during the reporting period.
Financial report
Structured representation of the financial information, which usually includes accompanying notes, derived from accounting records and intended to communicate an entity’s economic resources or obligations at a point in time or the changes therein for a period in accordance with a financial reporting framework.
Financial sustainability
An entity’s ability to manage financial resources so it can meet its spending commitments both at present and into the future.
Financial year
The period of 12 months for which a financial report (and performance report) is prepared.
General purpose financial statements
Statements that provide information about the financial position, performance and changes in financial position of an entity that is useful to a wide range of users.
Going concern
An entity which is expected to be able to pay its debts as and when they fall due, and continue in operation without any intention or necessity to liquidate or otherwise wind up its operations.
Governance
The control arrangements in place at an entity that are used to govern and monitor its activities in order to achieve its strategic and operational goals.
Internal audit
A function of council’s governance framework that examines and reports to management on the effectiveness of risk management, control and governance processes.
Independent auditor’s report
An expression of the independent auditor’s opinion on an entity’s financial (and performance) report.
Internal control
Processes affected by an entity’s structure, work and authority flows, people and management information systems, designed to assist the entity accomplish specific goals and objectives. Internal controls are a means by which an entity’s resources are directed, monitored and measured. They play an important role in preventing and detecting error and fraud and protecting the entity’s resources.
Joint venture
A contractual agreement joining together two or more parties for the purpose of executing a particular business undertaking. All parties agree to share in the profits and losses of the enterprise.
Liability
A present obligation of the entity arising from past events, the settlement of which is expected to result in an outflow of resources from the entity.
Local Government Act 1989
An Act of the State of Victoria that establishes the:
- purpose of councils
- powers that will enable councils to meet the needs of their communities
- accountable system of local government
- reform of law relating to local government in Victoria.
Masterfile
A database of records pertaining to one of the main subjects of an information system, such as customers, employees and vendors. Masterfiles contain descriptive data that does not often change, such as name and address and bank account details.
Performance report
A statement containing predetermined performance indicators and targets and actual results against these for that financial year, with an explanation for any significant variance between the results and the targets.
Qualified audit opinion – financial report
A qualification is issued when the auditor concludes that an unqualified opinion cannot be expressed due to one of the following reasons:
- disagreement with those charged with governance
- conflict between applicable financial reporting frameworks
- limitation of scope.
A qualified opinion shall be expressed as being except for the effects of the matter to which the qualification relates.
Qualified audit opinion – performance report
A qualification is issued when the auditor concludes that an unqualified opinion cannot be expressed due to the non-compliance with the Local Government Act 1989.
Relevant
Measures or indicators used by an entity are relevant if they have a logical and consistent relationship to an entity’s objectives and are linked to the outcomes to be achieved.
Revaluation
Recognising a reassessment of values for non-current assets at a particular point in time.
Revenue
Inflows of funds or other enhancements or savings in outflows of service potential, or future economic benefits in the form of increases in assets or reductions in liabilities of the entity, other than those relating to contributions by owners which result in an increase in equity during the reporting period.
Risk
The chance of a negative impact on the objectives, outputs or outcomes of the entity.
Stakeholder
A person, group, or organisation that has direct or indirect stake in an organisation because it can affect or be affected by the organisation’s actions, objectives and policies.
Standard statements
Specific purpose financial statements that compare actual financial performance reported on in the principle financial statements with budget. Where there are significant variations between actual and budgeted performance the variance is explained.
Steering committee
Provides oversight and strategic direction for key organisational processes or risk.
Surplus
Total revenue exceeds total expenditure resulting in a profit.
Unqualified audit opinion – financial report
A positive written expression provided when the financial report has been prepared and presents fairly the transactions and balances for the reporting period in accordance with the requirements of the relevant legislation and Australian accounting standards.
Also referred to as a clear audit opinion.
Unqualified audit opinion – performance report
A positive written expression provided when the performance report has been prepared and presents fairly the performance indicators and results of performance for the reporting period in accordance with the requirements of the relevant legislation.
Also referred to as a clear audit opinion.
Unqualified audit opinion – standard statement
A positive written expression provided when the standard statement has been prepared for the reporting period in accordance with the requirements of the relevant legislation.
Also referred to as a clear audit opinion.
Appendix G. Audit Act 1994 section 16—submissions and comments
In accordance with section 16(3) of the Audit Act 1994 a copy of this report, or relevant extracts from the report, was provided to all councils and the Department of Planning and Community Development with a request for submissions or comments.
The submissions and comments provided are not subject to audit nor the evidentiary standards required to reach an audit conclusion. Responsibility for the accuracy, fairness and balance of those comments rests solely with the agency head.