Major Projects Performance Reporting 2025
Report snapshot
Can Parliament and the community use public information to assess major projects’ progress and the reasons for significant variations?
Why we did this review
Parliament and the community need transparent, useful information about major projects to hold the government and public entities to account.
This is our fifth annual review of major projects’ performance reporting. We examined whether there is transparent, accurate and meaningful public information about the progress of major projects.
Our earlier reviews found entities do not publicly report on major projects' performance in a way that is consistent, transparent and useful to Parliament and the community.
Key background information

Source: VAGO.
What we concluded
Public information about major projects does not always give Parliament and the community the information they need to fully assess projects' progress and the reasons for significant variations.
Budget Paper 4: State Capital Program (BP4), which is the main consolidated source of public information about major projects, does not give a complete picture of how major projects are performing. This is because it does not always include meaningful information about changes to cost, scope and completion dates.
Other public information on major projects' progress can be useful, but it is not always easy for Parliament or the community to access. Information is not consolidated and in some cases is not available for all major projects.
The Department of Treasury and Finance (DTF) has taken steps to improve major projects reporting by implementing parts of recommendations from our previous reviews.
DTF developed the Capital Investment Dashboard to interactively present BP4 information and improved its guidance to entities about how to report project changes in BP4.
Since we began this series of reviews, public information about major projects performance is more accessible but key elements of our recommendations to address public reporting limitations have not been implemented. Fully implementing all previous recommendations would make publicly reported major projects performance information more transparent and useful.
In this review, we made one recommendation to DTF about improving public reporting on major projects by fully implementing our previous recommendations or requiring entities to report on existing major projects in their annual reports.
Data dashboard
View the dashboard full screen
Dashboard data
1. Our key findings
What we examined
Our review followed one line of inquiry:
1. Do public sector entities provide accurate and reliable information on major projects' progress and significant variations to cost, time, scope and benefits?
To answer this question, we examined public reporting about major projects, including Budget Paper 4: State Capital Program (BP4), reports to the Public Accounts and Estimates Committee (PAEC) and project-specific websites.
We identified 110 major projects from BP4 2025–26 with a total estimated investment (TEI) over $100 million. Of these, 92 major projects are separate initiatives in BP4 and the remaining 18 are sub-packages of larger major projects.
Sub-package
Some major projects can be split into sub-packages (or sub-projects), which contribute to the project's overall goal.
For example, 85 by 2025 (Level Crossing Removal) (metropolitan various), which is one of the government's programs to remove level crossings, splits its works into smaller sub-packages to remove specific level crossings.
We surveyed the 14 public sector entities delivering these projects:
- Coliban Region Water Corporation
- Court Services Victoria
- Department of Education
- Department of Energy, Environment and Climate Action
- Department of Jobs, Skills, Industry and Regions
- Department of Justice and Community Safety
- Department of Transport and Planning
- Homes Victoria
- Melbourne Arts Precinct Corporation
- Melbourne Water Corporation
- South East Water Corporation
- SEC Victoria
- Suburban Rail Loop Authority
- Victorian Infrastructure Delivery Authority.
In our survey we asked entities about their major projects. It included questions about:
- TEI and actual expenditure (to the survey date)
- estimated completion date
- scope changes
- self-assessment ratings.
We included the following entities in our review but did not survey them:
- Department of Health
- North East Link State Tolling Corporation
- State Sports Centres Trust
- VicTrack.
BP4 2025–26 lists these entities as the responsible entity for a major project or projects, although a different agency delivers those projects.
We also examined the Department of Treasury and Finance (DTF) because it:
- prepares BP4
- publishes the Capital Investment Dashboard
- oversees high value high risk (HVHR) projects
- provides guidance to entities and advice to ministers on major projects.
Our review provides limited assurance about the progress of the major projects and includes data entities provided in their survey responses. We are examining the Suburban Rail Loop in more detail in another review, Delivering the Suburban Rail Loop, which is planned to table in 2026.
Appendix A lists agencies’ formal letters of response to this review along with their recommendation action plans. Appendix G shows entities' responses to our survey.
We have rounded monetary values throughout this report. In some instances this may result in minor inconsistencies in sums and percentages calculated from rounded values. We recommend examining the full dataset in Appendix G.
Identifying what is working well
In our engagements we look for what is working well – not only areas for improvement.
Sharing positive outcomes allows other public agencies to learn from and adopt good practices. This is an important part of our commitment to better public services for Victorians.
Terms used in this report
Capital project
A capital project is a project that builds, improves or maintains public assets or infrastructure.
Major project
A major project is a new, existing or completed capital project with a TEI over $100 million.
Public Accounts and Estimates Committee
PAEC is a Victorian Parliament committee made up of upper and lower house members from the main political parties. It holds the government to account by scrutinising public accounts and Budget estimates through its inquiries.
Total estimated investment
TEI is the project cost reported in the Budget papers. This includes the base cost estimate, the base risk estimate (the expected cost of managing risks) and the excess risk estimate (additional money allocated above the base risk estimate).
Background information
Capital projects
Victoria's capital projects aim to provide the community with the infrastructure they need to travel, live and access services, such as healthcare, schools and recreation facilities.
Major projects are capital projects with a TEI over $100 million. They are complex and take several years to complete.
The Victorian Government is not the only funding source for Victoria's major projects. The Australian Government contributes funding for some projects, and some projects are also funded by private contributions and user fees.
The Victorian Government reports on capital expenditure, including major projects, in BP4. New and existing capital projects in BP4 2025–26 are worth $212.7 billion in total. This is $4.2 billion more than new and existing capital projects in BP4 2024–25.
DTF estimates that $23.8 billion was spent on capital projects during 2024–25.
Changes to projects' time, cost and scope
Sometimes a project's cost, estimated completion date or scope changes over time. Changes happen for many reasons, such as when the government increases a project's scope to deliver additional benefits to Victorians. A scope change can sometimes affect the project's cost or estimated completion date.
If an entity needs to change a project's scope, TEI or estimated completion date, it must seek government or ministerial approval for the change.
A project's TEI or estimated completion date may also change in BP4 from one year to another because of how projects are funded and developed.
For example, the government may fund an entity to develop a project's business case then provide more funding in a future Budget. Or, if a project does not have a confirmed budget because it is still in planning and commercial negotiation, an entity may provide an indicative TEI to BP4 that it will update later.
Figure 1: Reasons a project’s time, cost and scope can change
| Project element | Reasons for change |
|---|---|
| Estimated completion date |
|
| Cost |
|
| Scope |
|
Source: VAGO.
Major project performance public information
Parliament and the community need meaningful, timely and comprehensive information if they are to hold the government and public entities accountable for the money they spend on major projects. To be most useful, public reporting needs to:
- be in an easily accessible central location
- be accurate and easy to understand
- explain a project's progress, including how it is tracking against its approved TEI, estimated completion date, scope and benefits
- give meaningful explanations when a project's TEI, estimated completion date or scope changes.
Previous major projects performance reviews
Our 4 previous major projects reviews found that some entities we examined did not always consistently and transparently report on their major projects' performance.
We found that BP4 reporting was not comprehensive. We had concerns with project performance analysis and expected projects benefits measurement and assessment.
Previously, we made:
- 12 recommendations to DTF
- 2 recommendations jointly to DTF and the entities we surveyed
- one recommendation to entities we surveyed.
Major Projects Performance Reporting 2024 found that entities' internal reporting on major projects was high quality and meaningful. The internal reporting we reviewed in 2024 discussed challenges to progress and government approved changes to cost, time and scope.
We also found that DTF's quarterly advice to ministers about major projects performance was comprehensive and analysed project risks and systemic issues.
But public reporting did not give this level of detail.
Because of this gap, we focused this review on public reporting and did not examine entities' internal reporting and reporting to DTF, or DTF's reporting to the government.
Comparing changes to projects between 2024 and 2025
Major Projects Performance Reporting 2024 surveyed 15 entities about 113 major projects worth $145.5 billion. We surveyed 89 of those projects again this year.
We asked the same questions in this review as we did for Major Projects Performance Reporting 2024. This means we can compare survey results to see what has changed since 2024.
Figure 2: Number of major projects in scope for 2024 and 2025

Source: VAGO.
Appendix D lists the projects in scope for this review.
Survey data analysis
We explore data from our surveys in more detail in Section 4. Our data analysis has insights into:
- project and TEI distribution across sectors
- current expenditure
- changes to TEI, time and scope
- self-assessment ratings
- project stage
- investment lifecycle documents.
We used this data to update our interactive major projects dashboard, which is a companion product for this report. The updated dashboard can be found at www.audit.vic.gov.au/report/major-projects-performance-reporting-2025.
What we found
This section focuses on our key finding:
1. Public reporting does not always provide enough information to give Parliament and the community a complete understanding of major projects' performance.
Our full recommendation, including the entity's response, is at the end of this section.
Consultation with agencies
When reaching our conclusions, we consulted with the audited agencies and considered their views.
You can read their full responses in Appendix A.
Key finding 1: Public reporting does not always provide enough information to give Parliament and the community a complete understanding of major projects’ performance
Public reporting does not always give complete information on major projects’ progress and significant variations to cost, time, scope and benefits.
There are multiple public sources of information about major projects. But there is no easily accessible central source that consistently gives Parliament and the community the information they need to fully understand how projects are performing.
Budget papers do not always clearly explain changes to projects
BP4 footnotes provide an explanation to Parliament and the community about any changes to capital investments. But they do not always include the underlying factors driving significant variations.
DTF gave entities guidance in 2025 about how to report changes to their projects for BP4 2025–26 footnotes. We found that some footnotes in BP4 2025–26 gave detailed, meaningful explanations about why a project changed, in line with DTF's guidance. But we also found footnotes that did not fully explain why a TEI or completion date had changed.
We also found that 5 projects had a change in TEI since the 2024–25 Budget but their footnotes did not disclose this.
This means that BP4 reporting does not always give Parliament and the community a full picture of how major projects are performing and the reasons for changes.
DTF introduced the Capital Investment Dashboard in 2022 in response to our first major projects performance review, which we tabled in 2021. The Capital Investment Dashboard presents BP4 information in an interactive format. As the Capital Investment Dashboard is based on BP4, it has the same limitations as data reported in BP4.
Other major projects reporting adds to public understanding but has limitations
Entities also report on their major projects in their annual reports, to PAEC and through capital-project-specific websites. While this adds to public understanding, these reports' usefulness is limited because:
- annual reports only contain limited performance information about completed projects, not existing ones
- the public may not be aware of reporting to PAEC or how to access it
- capital project websites provide useful updates on how a project is progressing, and reasons for a change in timing. But they are not a performance reporting mechanism and do not give information about how a project is tracking against its TEI or estimated completion date
- these reporting forms are not collected in one place, so the public may need to access multiple sources to find all the information they need about a major project.
DTF has made changes but there are opportunities for improvement
Over the last 4 years, our major projects assurance reviews have found a similar lack of detail in public reporting, limiting the community's ability to understand how major projects are progressing.
DTF has taken steps to implement our previous recommendations about public major projects performance reporting. DTF introduced the Capital Investment Dashboard and made some improvements to it. It also strengthened its guidance to entities about BP4 reporting, requiring them to provide more detail about changes to projects.
But DTF has not yet fully implemented key recommendations we made last year about expanding BP4’s scope or developing a standalone major projects performance report. It has also not fully implemented parts of key recommendations about the Capital Investment Dashboard. Our 2024 recommendations about public reporting remain relevant.
Addressing this finding
To address this finding, we made one recommendation to DTF about improving public reporting on major projects by fully implementing our previous recommendations or requiring entities to report on existing major projects in their annual reports.
2. Our recommendation
We made one recommendation to address our findings. The Department of Treasury and Finance has accepted the recommendation in principle.
| Agency response | ||||
|---|---|---|---|---|
| Finding: Public reporting does not always provide enough information to give Parliament and the community a complete understanding of major projects’ performance | ||||
| Department of Treasury and Finance | 1 | Ensure there is meaningful annual public reporting on all existing major projects with a total estimated investment of over $100 million that gives Parliament and the community a clear understanding of underlying reasons for significant changes to total estimated investment, completion date, scope and benefits by either:
| Accepted in principle | |
3. Public reporting on major projects
Public reporting does not always give Parliament and the community a complete understanding of how major projects are progressing and the reasons for significant variations.
In BP4, entities explain key information about their capital projects in a footnote. But not all BP4 2025–26 footnotes gave meaningful explanations for why a project's TEI, completion date or scope had changed, even though DTF’s reporting guidance requires entities to provide them.
Although entities report useful major projects information in other ways, such as to PAEC inquiries and in annual reports and on websites, this information is not consolidated and is not always easy to find.
DTF has made improvements to public reporting on major projects since we began this review series. But more work is needed to fully implement our previous recommendations to improve major projects performance reporting transparency.
Covered in this section:
- Public major projects reporting
- Reporting on major projects in BP4
- Capital Investment Dashboard
- Previous recommendations to DTF
- Other reporting on major projects
Public major projects reporting
Sources
There are several sources of public reporting on major projects. The main sources are:
- BP4
- reporting to PAEC inquiries
- entity annual reports
- entity websites and social media, and capital-project-specific websites, such as the Victoria's Big Build website.
Budget Paper 4: State Capital Program
BP4 is the most comprehensive source of information about Victoria's capital projects for Parliament and the community.
DTF told us that although BP4 gives information about capital projects' time and cost targets, its main purpose is to give an overview of capital investments that public entities will deliver in the coming financial year, in context of the whole state Budget.
DTF compiles BP4 every year from information that entities provide about their capital projects, and the Treasurer tables it in Parliament.
| For ... | BP4 2025–26 gives the ... |
|---|---|
new and existing projects
|
|
completed projects
|
|
Practical completion
A project reaches practical completion when most or all construction is finished.
Financial completion
After practical completion, projects move into the financial completion phase, which is when an asset may be operational before any disputes, warranties and defects have been resolved with construction contractors. After resolution, a project is financially complete.
In BP4, entities explain key information about their capital projects in a footnote. This includes changes to a project over the last year, such as a change in TEI or estimated completion date.
Reporting on major projects in BP4
BP4 reporting
BP4 does not always give Parliament and the community the information they need to understand how projects are tracking against their approved cost, time, scope and benefits.
Our Major Projects Performance Reporting 2024 review found that entities were not clearly explaining project changes in Budget paper footnotes. This was because entities mainly reported in BP4 what had changed with their projects rather than why the change happened.
Another BP4 reporting limitation is that footnotes only report what has changed for a project since the previous year's Budget. To find a project's original TEI or estimated completion date, Parliament and the community would need to find the BP4 from the year the project first appeared, or use DTF’s Capital Investment Dashboard.
Project changes
We analysed BP4 2025–26 footnotes to see whether they give Parliament and the community enough information to understand changes to major projects.
Some footnotes gave detailed, meaningful explanations of why a project changed. But we also found footnotes that did not:
- fully explain why a TEI or estimated completion date had changed
- mention that a TEI had changed.
Meaningful information
BP4 footnotes do not always give clear explanations of why a TEI or completion date has changed, and what it means for the future of the project.
We found examples of footnotes using set phrases to describe changes to TEI or completion date that do not give readers any insight about the reason/s why the change occurred.
| The BP4 footnote said … | but this does not explain … |
|---|---|
the completion date changed 'to align with a revised project schedule' for 12 projects
|
|
| funding was 'reprioritised' to or from the project for 9 projects | whether funding has been reprioritised due to cost overruns and if so, whether the project's scope or benefits are at risk. |
| funding was reclassified as 'operating' or 'capital' 'in line with accounting standards' for 14 projects |
|
Our 2025 survey asked entities:
- to self-assess how their projects are tracking against approved time, cost, scope and benefits
- whether their projects have had a government-approved scope change that affected TEI or estimated completion date.
We compared the reasons for project changes in BP4 footnotes to what entities told us in our survey. The explanations entities gave for TEI and completion date changes were generally consistent between BP4 and survey responses.
But we found 2 projects where the BP4 footnote could have been clearer that TEI or completion date changes were related to scope changes.
| For ... | the BP4 footnote said … | and the survey attestation said … |
|---|---|---|
Road Blitz to Get Families Home Sooner and Safer (statewide)
| the TEI increased due to more Australian Government and third-party contributions | there was a scope change to include additional works. |
| Western treatment plant 5 West nutrient removal plant (Werribee) | the estimated completion date has been revised to align with a revised project schedule | the TEI and completion date increased due to underestimated pipework scope and additional infrastructure requirements identified during construction. |
Reporting in more detail on the reasons for the scope changes in BP4 would help Parliament and the community understand why the project changed, and the increased benefits they can expect the project to deliver.
Working well: Better practice BP4 footnotes
High-rise Redevelopment Program (metropolitan)
'The project name has changed from ‘Public Housing Revitalisation Program’ when it was published in the 2024–25 Budget. The TEI has increased by $420.487 million due to the increased scope of works for redevelopment of towers at Malvern Road, South Yarra and Highett Street, Richmond as well as walk-ups at the Richmond Estate announced in September 2024.'
New Tarneit railway station (Tarneit)
'The TEI has increased by $39.406 million due to market escalation, change in scope and station design to futureproof the station. The estimated completion date has been revised to quarter 3 2026–27 to reflect a revised forecast for practical completion obtained after contract award. The project remains on track for commencement of operations in 2026.'
Source: DTF, BP4 2025–26 (pages 132 and 166).
TEI and completion date changes
We compared the TEI and estimated completion dates from BP4 2024–25 and BP4 2025–26 for the projects in scope of our review to see if they had changed. We checked BP4 2025–26 footnotes for 50 projects with a TEI or completion date change to see if they disclosed the changes.
All existing projects with a change to the estimated completion date disclosed this in their footnotes. But 5 projects with a TEI change did not disclose that change in their footnotes.
These 5 projects all belonged to the same water corporation. The lack of disclosure of the TEI change means that the public may be unaware that the project's cost has changed.
Ten projects in our review are listed as 'completed' in BP4 2025–26 and report a financial completion date, rather than a practical completion date. Completed projects do not usually report their actual practical completion date in BP4.
This means that Parliament and the community must look at entities' annual reports to find out whether the project met its approved timelines.
DTF guidance about BP4 footnotes
DTF provides guidance to public entities about what information to include in BP4 footnotes. According to DTF's guidance for reporting for BP4 2025–26:
'It is essential for a capital project to include a footnote in BP4 if there is a key change to report on the project since the prior budget year. Furthermore, a footnote should also include additional information that is considered ‘of significance’ for a project, even if that project’s fundamentals are unchanged from the prior budget year.'
The guidance for reporting changes to TEI and completion date asked entities to outline detailed reasons for these changes and provided examples of how to do so.
Despite DTF requesting transparent and meaningful information about project changes, we found that the published BP4 2025–26 footnotes did not always align with DTF's guidance. We did not review the information for footnotes that entities provided to DTF.
DTF collates information from entities to prepare BP4 for the Treasurer, but there are no formal requirements for what BP4 must contain. DTF advised that any content in BP4 is published at the Treasurer’s discretion.
Capital Investment Dashboard
Capital Investment Dashboard
DTF also publishes the Capital Investment Dashboard on its website. The dashboard gives an overview of major projects as reported in BP4 from 2015–16 to 2025–26.
DTF first published the Capital Investment Dashboard in June 2022 in response to a recommendation from our 2021 review.
The Capital Investment Dashboard increases major projects transparency by letting viewers explore information from BP4. DTF told us it is not intended as a project performance tracking tool.
As the Capital Investment Dashboard is based on BP4 data, it has the same limitations as BP4.
| Because the Capital Investment Dashboard … | it does not … |
|---|---|
| only provides information about changes to a project's TEI, completion date or scope if it appears in the BP4 footnote | give readers additional insight into the underlying reasons for variations to major projects. |
| does not present historical information about approved TEI and completion dates for projects on an individual project page | allow readers to easily track changes to projects over time – readers must view each year separately on the BP4 tab to see historical information. |
| is updated annually alongside the release of the state Budget | give timely updates about the progress of projects. |
| does not list the entity responsible for delivering the project when this is different from the entity listed in BP4 | easily allow Parliament and the community to hold entities to account for how their major projects are performing. |
DTF advised that its Capital Investment Dashboard includes more information about major projects than dashboards from other Australian states and territories and comparable international jurisdictions. But there are still opportunities to increase the information the dashboard gives to Parliament and the community.
Previous recommendations to DTF
Improving BP4 reporting
Our previous reviews recommended ways to improve BP4 reporting.
Major Projects Performance Reporting 2024 recommended that DTF expand the scope of BP4 or develop an additional major projects report and dashboard to include:
- progress analysis against cost, time, scope and benefits
- more transparency and accountability by describing any relevant root cause factors that have caused a change in a project’s previously approved cost, time, scope or benefits, as well as the impact of the change
- data and assessments that have been certified and endorsed by relevant entities’ accountable officers.
DTF accepted the recommendation in principle and set a target completion date of mid-2026. DTF told us that it has taken steps to implement the recommendation by working with project delivery entities to enhance reporting. This includes its updated guidance on BP4 2025–26 footnotes.
As the timeline for implementing this recommendation has not elapsed yet, we cannot make conclusions about the impact of DTF's work to respond to it. The recommendation remains relevant. If fully implemented, it would provide Parliament and the community with the meaningful information they need to understand changes to major projects and how they are progressing.
Improving the Capital Investment Dashboard
We made recommendations in our 2022 and 2023 Major Projects Performance Reporting reviews to increase the Capital Investment Dashboard's transparency. DTF accepted these recommendations in principle. It has updated the dashboard annually since first publishing it in 2022, and told us that it has improved the dashboard by:
- adding proportional expenditure for projects
- updating TEI for projects with a TEI marked 'TBC' in previous Budget papers
- enhancing the user experience to make navigation easier.
But it has not implemented all aspects of our previous recommendations. The dashboard does not:
- contain at least the same data fields as the Victorian Government IT Dashboard, or our Major Projects Performance Reporting dashboards
- have a quarterly update schedule
- show scope, cost and time variance analysis against previously reported results
- identify project delivery entities in addition to the agencies identified in the Budget papers
- give red, amber and green ratings and explanations for each project
- have data for all years available to download.
Implementing these aspects of our previous recommendations would strengthen the Capital Investment Dashboard and provide Parliament and the community with more information to assess the progress of Victoria's major projects.
Other reporting on major projects
Entity annual reports
Entities include some information about major projects in their annual reports. But this information does not always give readers enough information to understand what is happening with projects in progress. This is because:
- entities will sometimes provide an update on their projects as part of their explanation of their activities for the year. But this tends to focus on project updates rather than a project's performance against its approved TEI and completion date
- entities report on projects when they reach practical or financial completion. But this only tells readers how a project performed once it is finished.
DTF produces a model report, which sets out the requirements entities must follow when preparing disclosures for their annual reports under the Standing Directions 2018 under the Financial Management Act 1994. Entities do not have to include information about changes to existing projects in their annual reports.
This is a missed opportunity to provide more public information about how major projects are performing from the entity that is accountable for delivery.
Reporting to PAEC
Entities complete a questionnaire for PAEC twice a year to assist the committee with its annual inquiries into financial and performance outcomes and Budget estimates. The completed questionnaires, transcripts and presentations from hearings and final inquiry reports are available on PAEC's website.
PAEC's inquiry into the 2024–25 financial and performance outcomes is in progress, with hearings held in November 2024. The completed questionnaires for 2024–25 asked entities for additional information on major projects performance compared to BP4. This includes:
- for existing projects with changes to TEI, completion date and scope, providing the TEI, completion date and scope at announcement as well as the revised values and the reason for changes
- for completed projects, the TEI and estimated completion date at announcement, the actual values and the reason for variance
- for HVHR projects, the gateway review stage and date completed, the date the business case was completed and a link to the business case if publicly available.
This information adds to the publicly available information on the progress of major projects and the reasons for variations to cost, scope or schedule.
We found that the information entities provided in their PAEC questionnaires was broadly consistent with their responses to our survey and the information in BP4. There are some minor differences between actual expenditure reported to PAEC and in our survey.
But each entity's questionnaire is only available as a separate document that is accessed from the PAEC inquiry's website. This means:
- it is time consuming to access information for multiple entities' projects
- if a person is seeking information about a particular project, they need to know which entity is responsible for it.
The public may also be less likely to access reporting to PAEC inquiries because they may not be aware that it exists.
PAEC also published a dashboard as part of its inquiry into the 2024–25 financial and performance outcomes. PAEC’s dashboard gives more transparency about how departments are performing, although it does not include information about the performance of major projects.
Project-specific websites
There are several websites that provide information to the public about Victoria's major projects:
- Victoria's Big Build website, which has information about transport-related projects, such as roads, rail, the Level Crossing Removal Project, the Metro Tunnel Project, the West Gate Tunnel Project and the Suburban Rail Loop
- Development Victoria's website, which has information about projects that build spaces for the community, such as sports and arts centres, property development and urban renewal projects.
These websites are intended to inform the community about construction, disruption and consultation updates, and what the project aims to achieve. They are not designed to be an accountability mechanism to measure project performance.
But we found examples of detailed, meaningful reporting on the reasons for variation to TEI and completion dates that filled in gaps from BP4 reporting on the Victoria's Big Build and Development Victoria websites.
Working well: Victoria's Big Build website provides additional project information
The Western Highway duplication – Ballarat to Stawell (regional various) project attested in its survey that the project had a scope change affecting TEI and completion date due to delays because of legal challenges. The BP4 footnote did not reflect this. It reads: 'The estimated completion date is to be confirmed once planning activities are completed. The TEI includes $499.380 million of Commonwealth Government funding’.
The Victoria's Big Build website provides additional context about the delays. The delivery entity had to vary the project design and develop a new cultural heritage management plan to protect culturally important sites.
4. Exploring major projects performance data
We surveyed 14 agencies about how 110 major projects are performing against their expected cost, completion date and scope.
Since last year's review, this includes 16 new major projects, 84 existing projects and 10 completed projects that are collectively worth $149.33 billion. Four projects did not attest a TEI because their TEIs are still to be confirmed.
We found little net change to the 89 projects we surveyed in both 2024 and 2025. The total TEI for these projects increased by $169.03 million, or 0.12 per cent. Since last year’s review, there were 67 additional quarters added to estimated completion dates across the 89 projects. Fifty-seven projects did not report changes to their completion dates, 3 projects reported a decrease and 17 reported an increase.
This section explores insights from the survey data, including changes to these projects' cost, time and scope to date.
Covered in this section:
Insights from survey data
Major projects by sector
Figure 3 shows which sector the 110 major projects we surveyed in 2025 and the 89 major projects we surveyed in 2024 belong to.
For both years, the transport sector has the most projects, about half of all projects surveyed, followed by health and human services.
In 2025, there were 19 health projects and 9 human services projects to build and improve social housing.
Eleven of the new projects listed in BP4 2025–26 that we surveyed in 2025 are in the transport sector, 3 in education and training, and one each in the energy and health and human services sectors.
Figure 3: Count of all major projects surveyed in 2025 and in both 2024 and 2025, by sector

Source: VAGO.
Entities' self-assessments
We asked entities to assess their projects' performance against currently approved cost, time, scope and benefits.
Figure 4 shows that most projects reported they were on time, in scope, within budget and had well-developed benefits measurement systems (green). See Appendix E for rating definitions.
Figure 4: Entities' self-assessment ratings for major projects surveyed in 2025

Note: 109 of the 110 major projects we surveyed provided a self-assessment rating. The Victorian Infrastructure Delivery Authority did not provide a self-assessment rating for the Melbourne Airport Rail (metropolitan various) project. It advised this was because the project has not yet established its scope, cost or timelines.
Source: VAGO, based on entities' attested survey data.
Changes to self-assessment ratings
For 88 of the 89 projects we surveyed in both 2024 and 2025, we compared entities' self assessment ratings to see if they had changed. Figure 5 shows that most self-assessment ratings stayed the same from 2024 to 2025.
Figure 5: Changes to entities self-assessment ratings from 2024 to 2025

Note: We excluded the Melbourne Airport Rail (metropolitan various) project from this analysis because it did not provide a self assessment rating in 2024 or 2025.
Source: VAGO, based on entities' attested survey data.
We asked entities to assess their projects against current approved parameters. This means that an entity can rate their project green despite a scope, TEI or estimated completion date change since the 2024 survey, or since the project first appeared in BP4, if the changes are approved.
Total estimated investment
Figure 6 shows the total TEI for the major projects we surveyed in 2025 by sector. Four projects did not have a confirmed TEI in BP4 and also did not attest a TEI in our survey.
An entity may give a project's TEI as 'to be confirmed' in BP4 because:
- the project does not have a finalised budget yet
- disclosing the TEI would make it difficult for the entity to complete commercial negotiations.
For the transport projects we surveyed with sub-packages worth over $100 million, entities provided us with the budget allocated for each sub-package from the main projects’ total TEIs. We subtracted the value of the sub-packages from the overall project’s TEI to give a TEI for the main project, excluding the sub-packages. Entities manage the sub-packages’ budgets within the main project’s TEI and report to government on the main TEI.
Transport has the largest proportion of the total TEI of the major projects we surveyed, making up 83.4 per cent ($124.53 billion of a $149.33 billion total). This is because the transport sector has the most projects and many of its projects have high TEIs because they are large, complex initiatives.
Health and human services has the second highest proportion of the total TEI ($18.51 billion, or 12.4 per cent). Of this:
- $12.59 billion is allocated to health projects
- $5.92 billion is allocated to human services projects (housing).
Figure 6: Total major projects' TEI distribution across sectors in BP4 2025–26 for all projects surveyed in 2025 ($ billion)

Note: The TEIs used in this analysis were either published in the BP4 2025–26 and attested to or updated and attested to in our 2025 survey. One project (Suburban Rail Loop East – Main Works (metropolitan various) did not disclose a TEI in BP4 2025–26. We used the TEI that the Suburban Rail Loop Authority attested to in our 2024 survey, after verifying with the Suburban Rail Loop Authority that this figure was still correct.
Source: VAGO, based on information from BP4 2025–26 and entities' attested survey data.
High-cost major projects
Figure 7 shows that of the 110 major projects we surveyed in 2025, 21 projects have TEIs over one billion.
Figure 7: Major projects with TEIs over $1 billion surveyed in 2025

Source: VAGO, based on information from BP4 2025–26 and entities' attested survey data.
Six transport projects we surveyed are worth over $5 billion each. These 6 projects are worth $80.7 billion combined, making up 54.0 per cent of all projects we surveyed this year’s total TEI.
The 15 projects with a TEI between one and $5 billion are worth $36.4 billion combined, which is 24.4 per cent of the total TEI of all projects we surveyed this year.
TEI changes from 2024 to 2025
The total TEI for the 89 projects we surveyed in 2024 and 2025 increased by approximately $169.03 million, or 0.12 per cent, from 2024 to 2025.
Between our 2024 and 2025 surveys, the TEI for:
- 38 projects did not change
- 33 projects decreased by $2.68 billion
- 15 projects increased by $2.84 billion.
Figure 8 shows the total TEI change by sector between 2024 and 2025 for the 89 projects we surveyed in both years.
Figure 8: Change in total TEI between 2024 and 2025, for major projects we surveyed in both years, by sector ($ million)

Note: This analysis uses our 2024 survey data and TEI values agencies attested to in 2025. In some cases, these values may be updated from TEI values published in BP4.
Source: VAGO, based on BP4 2025–26 and entities' attested survey data.
Health and human services had the highest increase, at $883.82 million, a 5 per cent increase from the 2024 total TEI. This is largely because:
- the New Melton Hospital (Cobblebank) TEI is $487.7 million more than the estimated TEI published in BP4 2024–25 before the government settled commercial arrangements. The extra funding includes 25 years of operating costs under a public–private partnership model. The 2025–26 TEI sets a baseline for the project, instead of changing the previously reported TEI
- the High-rise Redevelopment Program (metropolitan) TEI increased by $420.5 million to include more works in the project scope.
Some projects had a large TEI increase between 2024 and 2025 because they were combined with other projects and absorbed their TEI. For example, the National water grid fund (statewide) TEI now includes $156.56 million from the National Water Infrastructure Development Fund – National Partnerships Agreement project.
The total transport projects TEI decreased by $503.01 million from 2024 survey attestations to 2025 (a 0.4 per cent decrease). This includes TEI decreases to:
- 85 level crossing removals (by 2025) (Level Crossing Removal) (metropolitan various): $99.4 million
- Twenty-five more level crossing removals (by 2030) (Level Crossing Removal) (metropolitan various): $60.72 million.
BP4 2025–26 footnotes give the reason for the changes to the level crossing removal TEIs as reclassification of capital expenditure to operating expenditure in line with accounting standards.
Changes to original TEI
For projects we surveyed in 2025, all sectors except justice and emergency services reported an increase in their total TEI since their projects first appeared in BP4.
Figure 9 shows the change between the original TEI published in BP4 and TEI reported in BP4 2025–26, by sector for the 89 existing and completed BP4 2025–26 projects we surveyed with TEI values available.
Figure 9: Cost changes from original TEI by project sector for existing and completed major projects that reported both figures ($ million)

Source: VAGO, based on information from BP4 2025–26 and entities' attested survey data.
Transport reported the highest total TEI increase from the original total TEI ($8.02 billion). But this only represents a 7.3 per cent increase, which is the lowest proportional increase across sectors due to transport’s substantially higher total TEI of $124.53 billion total.
There is a total increase of $11.31 billion in TEIs across the life of these 89 projects. This is a $16.14 billion increase across 51 projects and a $4.83 billion decrease across 22 projects. The remaining 16 reported no change in TEI across the life of the project.
We reported on many of these changes to original TEIs in our previous reviews. In some cases, the changes to project TEIs happened several years ago.
Project expenditure
Figure 10 compares the total TEI for the projects we surveyed in each sector with their actual expenditure to date as at the time of survey attestation. Major projects have spent $75.5 billion of the total TEI of $149.33 billion (50.6 per cent).
Figure 10: TEI and current actual expenditure to survey attestation date by sector ($ billion)

Note: Some entities provided the actual expenditure for their projects after the survey attestation date and some provided actual expenditure to 30 June 2025.
Source: VAGO, based on entities' attested survey data.
Actual expenditure to date on:
- completed projects is over 95 per cent of the TEI ($2.88 billion of $3.01 billion)
- existing projects is approximately 52 per cent of the TEI ($72.06 billion of $138.23 billion)
- new projects is approximately 7 per cent of the total TEI ($567.2 million of $8.09 billion).
Funding sources
Figure 11 shows the distribution of funding sources by sector for 103 of the 110 major projects we surveyed. We excluded 7 projects from this analysis either because the information was not available, the funding arrangements were too complex to split between the 3 funding sources, or because the funding arrangements are currently commercially sensitive.
Victorian Government funding makes up 84.0 per cent of the total TEI for the projects surveyed here ($124.21 billion of $147.93 billion), while Australian Government funding contributes 10.5 per cent ($15.53 billion), and other sources of funding (private, philanthropic or user fees) contributes 5.5 per cent ($8.20 billion).
Figure 11: Funding sources

Note: We excluded 6 projects that either did not have an attested TEI or had commercially sensitive funding arrangements. We also excluded one water project (National water grid fund (statewide)) because we could not reliably assign funding sources due to funding arrangement complexity.
Source: VAGO, based on entities' attested survey data.
Water corporations reported that water user fees fully funded all water sector major projects we surveyed, for the projects we examined (excluding the National water grid fund (statewide) project).
Figure 12: Major projects funding sources from 2025–26 ($ million)
| Sector | State | Federal | Other | Total |
|---|---|---|---|---|
| Culture, sport and community* | 1,854.79 | 30.00 | 267.40 | 2,152.19 |
| Education and training | 366.65 | 0.00 | 0.00 | 366.65 |
| Energy | 363.93 | 0.00 | 0.00 | 363.93 |
| Environment | 212.26 | 0.00 | 0.00 | 212.26 |
| Health and human services* | 16,655.47 | 651.11 | 0.00 | 17,306.58 |
| Justice and emergency services | 1,084.05 | 0.00 | 0.00 | 1,084.05 |
| Transport* | 103,673.54 | 14,845.32 | 6,008.44 | 124,527.30 |
| Water* | 0.00 | 0.00 | 1,921.43 | 1,921.43 |
| Total | 124,210.68 | 15,526.42 | 8,197.27 | 147,934.37 |
Note: *We excluded 6 projects that either did not have an attested TEI or had commercially sensitive funding arrangements. We also excluded one water project (National water grid fund) because we could not reliably assign funding sources due to funding arrangement complexity.
Totals may not add up due to rounding.
Source: VAGO, based on entities' attested survey data.
Estimated completion date changes
We compared the estimated completion dates attested to by entities in BP4 2025–26 with the date entities attested in our 2024 survey for the 89 projects we surveyed across both years.
Twelve projects did not have estimated completion dates for both years. Figure 13 shows that for the remaining 77 projects:
- 17 reported an increase in their estimated completion dates
- 3 reported a decrease
- 57 reported no change between 2024 and 2025, as shown in Figure 13.
Figure 13: Number of projects with changes to their completion dates by sector
| Sector | Date increases | Date decreases | No change | Excluded projects |
|---|---|---|---|---|
| Transport | 6 | 3 | 32 | 9 |
| Health and human services | 7 | 0 | 18 | 2 |
| Water | 3 | 0 | 2 | 1 |
| Justice and emergency services | 1 | 0 | 1 | 0 |
| Environment | 0 | 0 | 3 | 0 |
| Culture, sport and community | 0 | 0 | 1 | 0 |
| Total | 17 | 3 | 57 | 12 |
Note: Our time change analysis excluded projects with non-specific or 'TBC' values. We did not survey any education and training or energy projects in 2024, so they do not appear in this analysis.
Source: VAGO, based on entities' attested survey data.
Overall, entities reported a total increase of 67 additional quarters across these projects since our last review. Figure 14 shows the distribution of the total completion date changes grouped by sector.
The transport sector reported the largest increase, with 25 more quarters added to its 41 projects from their 2024 estimated completion dates.
BP4 reasons for transport projects with the biggest completion date increase include:
- Suburban Roads Upgrade – Northern Roads Upgrade and South Eastern Roads Upgrade (statewide) (14 quarters): The BP4 footnote says that the estimated completion date has been revised to quarter 4 2028–29 in line with a revised project schedule. The BP4 footnote also notes that Yan Yean Road Upgrade – Stage 2 initiative has been added to the project since BP4 2024–25
- New trains for Sunbury (metropolitan various) (8 quarters): The BP4 footnote says the estimated completion date was revised to quarter 2 2026–27 to reflect completion dates for residual works after Metro Tunnel completion.
Health and human services reported a combined increase of 23 quarters to their 27 projects compared to 2024.
Transport and health and human services are the sectors with the most projects we surveyed. It is not unexpected that these sectors would report a greater increase in time added to their projects than other sectors.
Figure 14: Total cumulative changes to estimated completion dates by sector (quarters)
Note: Estimated completion dates are from BP4 2024–25 and 2025–26 for 77 projects we surveyed in 2024 and 2025 where completion dates were available for both years Our time change analysis excluded projects without completion dates published in both BP4 2024–25 and 2025–26. Education and training and energy projects were not examined in Major Projects Performance Reporting 2024.
Source: VAGO.
Changes from original estimated completion dates
We also compared the estimated completion dates for the projects we surveyed in 2025 against their completion dates when first published in BP4. We excluded projects that did not have a published completion date and projects listed as new projects in BP4 2025–26. This gave us a sample of 81 projects.
Across these 81 projects, 36 reported no change in their expected completion date for their original publication in BP4, while 5 brought their expected completion date forward (Figure 15). Forty projects reported an increase in their estimated completion dates.
Figure 15: Number of projects reporting changes from their original estimated completion dates
| Sector | Projects with date increases | Projects with date decreases | Projects with no change | Projects Excluded1 |
|---|---|---|---|---|
| Transport | 17 | 5 | 22 | 17 |
| Health and human services | 14 | 0 | 10 | 4 |
| Water | 5 | 0 | 2 | 3 |
| Justice and emergency services | 2 | 0 | 0 | 0 |
| Environment | 1 | 0 | 0 | 0 |
| Culture, sport and community | 1 | 0 | 2 | 1 |
| Education and training* | N/A | N/A | N/A | 3 |
| Energy2 | N/A | N/A | N/A | 1 |
| Total | 40 | 5 | 36 | 29 |
Note: 1Our time change analysis excluded projects with non-specific or 'TBC' values. 2Education and training and energy projects only comprised new projects.
Source: VAGO, based on entities' attested survey data.
Across all 81 projects, there was a total combined increase of 369 quarters in estimated completion dates since their original appearance in BP4, with the largest proportion (161 quarters, 43.6 per cent) of these accounted for by transport sector projects (Figure 16). Health and human services projects showed a total cumulative increase in 105 quarters, while water projects showed a total cumulative increase of 69 quarters against their original completion dates.
Figure 16: Total cumulative changes to estimated completion dates for all relevant projects by sector (quarters)

Note: Our time change analysis excluded projects without original or BP4 2025–26 completion dates.
Source: VAGO, based on entities' attested survey data.
We have reported on many of these changes to original completion dates in our previous Major Projects Performance Reporting reviews. In some cases, the changes to completion dates happened several years ago.
Significant scope changes from 2024 to 2025
Figure 17 shows that for the 89 projects we surveyed in both 2024 and 2025:
- 7 reported a scope change impacting the project's TEI
- 5 reported a scope change impacting the project's completion date since their last survey attestation.
Figure 17: List of projects reporting a significant scope change affecting either TEI or completion date since 2024
| Project | Sector | TEI impacted? | Completion date impacted? |
|---|---|---|---|
| Road Blitz to Get Families Home Sooner and Safer (statewide) | Transport | Yes | Yes |
| Suburban Roads Upgrade – Northern Roads Upgrade and South Eastern Roads Upgrade (statewide) | Transport | Yes | Yes |
| Western Highway duplication – Ballarat to Stawell (regional various) | Transport | Yes | Yes |
| Western treatment plant 5 West nutrient removal plant (Werribee) | Water | Yes | Yes |
| High-rise Redevelopment Program (metropolitan) | Health and human services | Yes | No |
| Cooling our public housing towers (metropolitan) | Health and human services | Yes | No |
| Melbourne Airport Rail (metropolitan various) | Transport | Yes | N/A* |
| Parkville Precinct Redevelopment (Parkville) | Health and human services | No | Yes |
Note *Entity did not respond to this question.
Source: VAGO, based on entities' attested survey data.
Entities told us in their survey responses that these changes add important infrastructure for the public to the project's previous scope. For example:
- Road Blitz to Get Families Home Sooner and Safer (statewide) added work to upgrade another key intersection to improve access, safety and congestion
- Suburban Roads Upgrade – Northern Roads Upgrade and South Eastern Roads Upgrade (statewide) added work to continue upgrading a busy arterial road to make it easier and safer to use.
Significant scope changes
Thirty-five of the 110 projects we surveyed (31.8 per cent) have had at least one significant scope change over the life of the project, requiring ministerial or government approval. Of these, 23 reported one change, 9 reported 2 changes, and 3 reported 3 changes.
Figure 18 shows the projects that have had 2 or more significant scope changes over their lifecycle. All projects reported the same number of significant scope changes in 2024, excluding the High rise Redevelopment Program (metropolitan).
Figure 18: Major projects with 2 or more significant scope changes over the lifecycle of the project
| Project | Sector | Significant scope changes |
|---|---|---|
| Building a world class hospital for Frankston families (Frankston) | Health and human services | 3 |
| Ballarat Health Services expansion and redevelopment and the new Central Energy Plant (Ballarat) | Health and human services | 3 |
| State Basketball Centre redevelopment (Knox) | Culture, sport and community | 3 |
| National water grid fund (statewide) | Water | 2 |
| North East Link – Primary Package (Tunnels) and State Tolling Corporation (Greensborough) | Transport | 2 |
| Metro Tunnel (metropolitan various) | Transport | 2 |
| Murray Basin Rail Project (regional various) | Transport | 2 |
| Car Parks for Commuters (statewide) | Transport | 2 |
| Arden Precinct Redevelopment (metropolitan) | Transport | 2 |
| High-rise Redevelopment Program (metropolitan) | Health and human services | 2 |
| Men’s prison system capacity (statewide) | Justice and emergency services | 2 |
| 85 by 2025 (Level Crossing Removal) (metropolitan various) | Transport | 2 |
Note: The Department of Transport and Planning attested in its 2025 survey that in 2024 it over-reported the number of significant scope changes to its Next Generation Trams (metropolitan various) project. Only one of these scope changes met the minister approval threshold.
Source: VAGO, based on entities attested survey data.
The National water grid fund (statewide) project, which we did not survey in 2024, also reported 2 significant scope changes over the project's lifecycle. The Department of Energy, Environment and Climate Action advised that as this is an Australian Government funding program, its scope can change due to Australian Government decisions.
Project stages
Figure 19 shows that most major projects we surveyed are in delivery/under construction, with 80 of the 110 projects (72.3 per cent) reported as being in this stage.
Of the remaining 30 projects, 11 were reported as either in practical completion (8) or post practical completion (3). The remaining 19 projects were in pre-delivery stages
Figure 19: Major project stages by sector in 2025
| Project stages | Culture, sport and community | Education and training | Energy | Environment | Health and human services | Justice and emergency services | Transport | Water | Total |
|---|---|---|---|---|---|---|---|---|---|
| Feasibility study/planning | 1 | 2 | 3 | ||||||
| Business case development | 5 | 5 | |||||||
| Expression of interest | 1 | 1 | |||||||
| Early works/pre-procurement | 3 | 2 | 5 | ||||||
| Request for proposal | 0 | ||||||||
| Procurement process | 2 | 1 | 3 | ||||||
| Contract negotiation | 1 | 1 | 2 | ||||||
| In delivery/under construction | 3 | 3 | 1 | 1 | 21 | 1 | 43 | 7 | 80 |
| Practical completion | 1 | 6 | 1 | 8 | |||||
| Post-practical completion | 1 | 2 | 3 |
Source: VAGO, based on entities' attested survey data.
For the 89 projects we surveyed in 2024 and 2025, 68 were in the same project stage as they had previously reported. Appendix F lists the 21 projects that changed stages between 2024 and 2025.
Investment lifecycle documents
Preparing a business case is the first stage of planning a project. DTF describes business cases as an opportunity for an entity to conceptualise a project and demonstrate that it is worth doing.
DTF requires any public sector entity (except for water sector) project costing more than $10 million to develop a business case, an investment logic map (ILM) and a benefits management plan (BMP). Water sector projects have similar requirements.
Figure 20 shows that 86 of the 99 major projects we surveyed have a business case. Our sample size for this analysis is 99 major projects rather than 110 because we excluded some individual Level Crossing Removal Project sub-packages that advised us that they rely on a program-level business case.
13 projects reported that they do not have a business case. We were advised:
- 4 projects were funded by the government through funding submissions without a business case
- 2 projects have draft business cases
- 2 projects have business cases in development
- 2 followed a different project delivery framework, as approved by DTF
- one was a part of the COVID-19 crisis approach response by the Victorian Government
- one was an election commitment initiative
- one has developed draft business cases for some of its sub-packages, with business cases for more sub-packages in development.
Figure 20: Major projects with a business case, BMP and ILM
| Document | Number of projects |
|---|---|
| Business case | 86 |
| BMP | 83 |
| ILM | 82 |
Note: We have not counted separate Level Crossing Removal Project sub-packages on a statistical basis.
Source: VAGO.
HVHR projects
DTF uses a risk assessment tool to determine if a project is HVHR. HVHR projects go through independent review and approval processes. This aims to make projects more likely to deliver their intended benefits on time and on budget.
The BP4 2025–26 lists 63 HVHR projects. Sixty-one of these projects are existing and 2 are new this year.
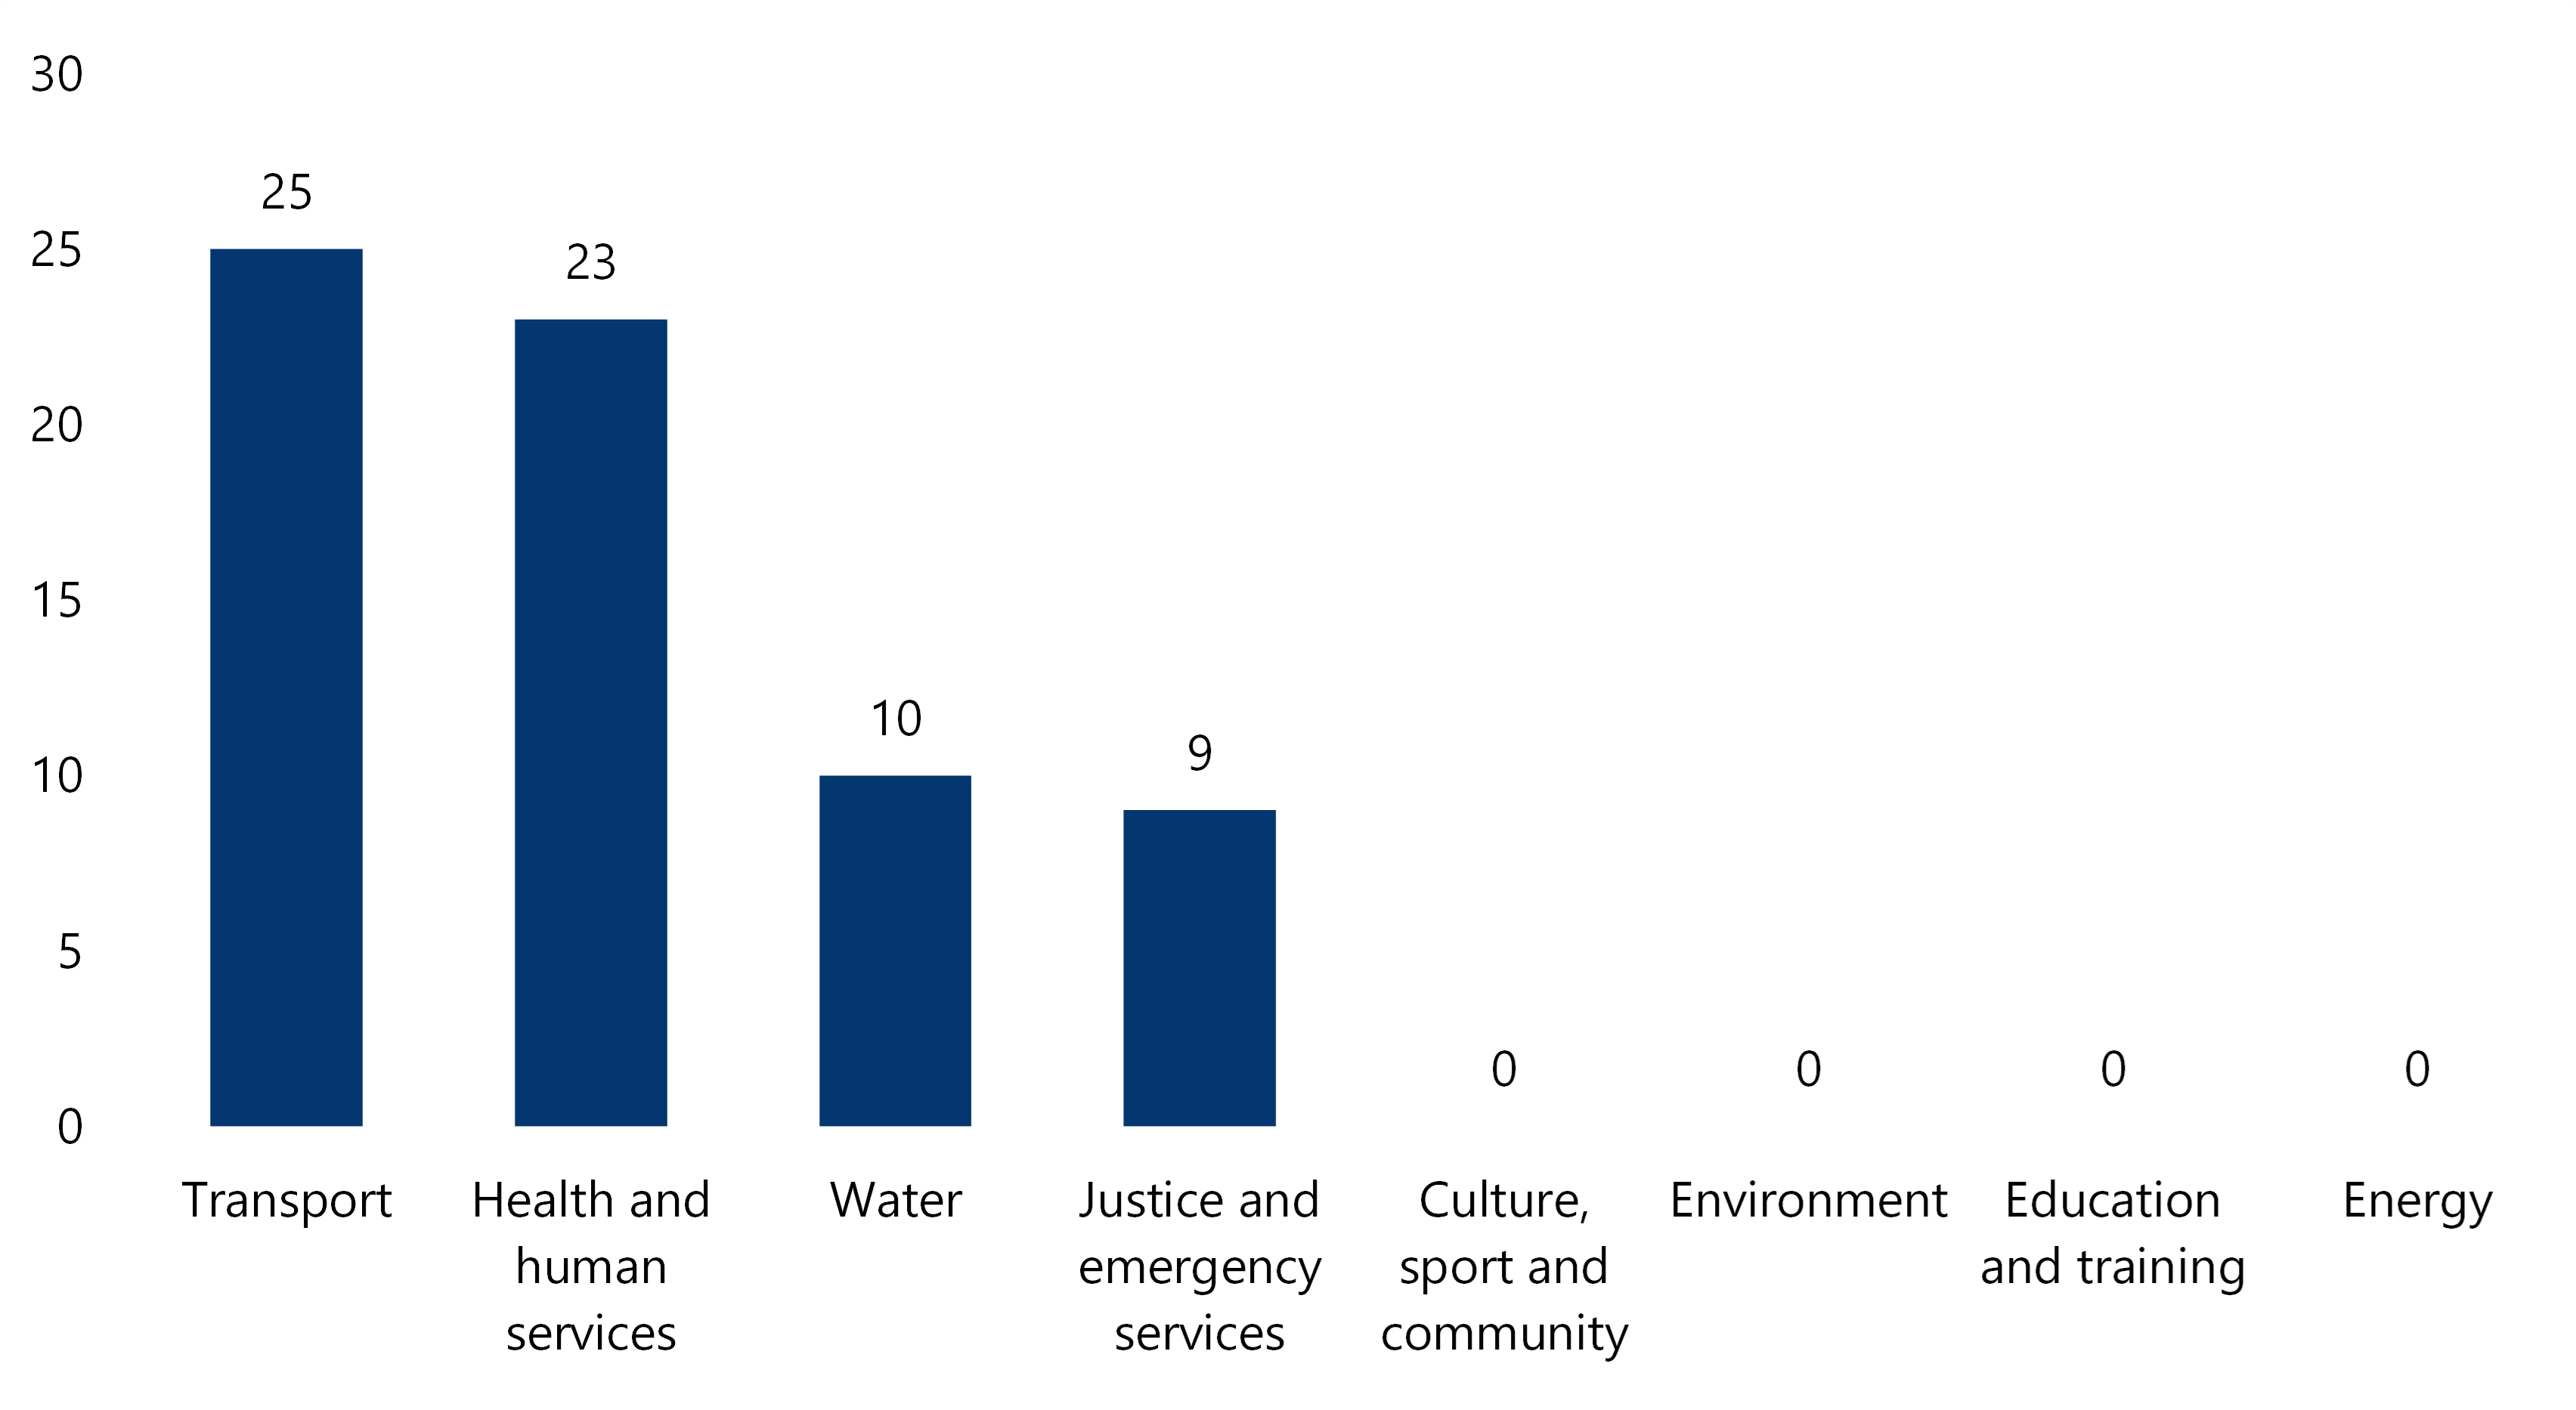
Figure 21 shows the number of HVHR projects by sector for all the major projects surveyed this year – 69 (62.7 per cent) of the 110 projects were HVHR.
Our count of HVHR projects is higher than that reported in the BP4 2025–26 because we are including the sub-packages worth over $100 million where the main project is HVHR.
Of the 89 projects surveyed in 2024 and 2025, 60 (67.4 per cent) were HVHR. Over both years the transport sector has the most HVHR projects, followed by health and human services.
As projects in the transport and health and human services sectors are often complex projects with high TEIs delivering critical infrastructure, it is not unsurprising that they have more HVHR projects than other sectors.
Figure 21: HVHR projects we surveyed in 2025 by sector
| Sector | HVHR projects 2025 | HVHR projects 2024 and 2025 |
|---|---|---|
| Culture, sport and community | 3 | 2 |
| Education and training | 3 | 0 |
| Energy | 0 | 0 |
| Environment | 0 | 0 |
| Health and human services | 20 | 20 |
| Justice and emergency services | 2 | 2 |
| Transport | 41 | 36 |
| Water | 0 | 0 |
Source: VAGO, using entities’ attested data.
Appendix A: Submissions and comments
Download a PDF copy of Appendix A: Submissions and comments.

Appendix B: Abbreviations, acronyms and glossary
Download a PDF copy of Appendix B: Abbreviations, acronyms and glossary.
Appendix C: Review scope and method
Download a PDF copy of Appendix C: Review scope and method.
Appendix D: Major projects in scope for this review
Download a PDF copy of Appendix D: Major projects in scope for this review.
Download Appendix D: Major projects in scope for this review
Appendix E: Projects self-assessment rating criteria for 2025–26
Download a PDF copy of Appendix E: Projects self-assessment rating criteria for 2025–26.
Download Appendix E: Projects self-assessment rating criteria for 2025–26
Appendix F: Projects that changed stage between 2024 and 2025
Download a PDF copy of Appendix F: Projects that changed stage between 2024 and 2025.
Download Appendix F: Projects that changed stage between 2024 and 2025
Appendix G: Data sources used in this review
Download a PDF copy of Appendix G: Data sources used in this review.