Responses to Performance Engagement Recommendations: Annual Status Update
Review snapshot
Are public sector agencies implementing our performance engagement recommendations in a timely way?
Why we did this review
Our performance engagements often identify opportunities for agencies to improve how they work. Our recommendations help to address root causes of poor performance.
There is no legislative requirement for agencies to accept, complete or publicly report on our recommendations.
This annual review provides transparency and accountability to the Victorian public and Parliamentarians on agencies’ responses to our engagements.
What we examined
In this report we focus on all 1,316 recommendations we made between July 2018 and December 2021, of which 1,296 were accepted.
We surveyed audited agencies on 743 unresolved recommendations from that period.
We also surveyed 71 unresolved recommendations from before July 2018. We did not include these ageing recommendations in the July 2018 to December 2021 dataset, which is the focus of this report.
What we concluded
Most agencies reported that they accept and are acting on our recommendations.
As of 31 March 2022, for the July 2018 to December 2021 dataset, agencies we examined had:
- completed 853 (66 per cent) of recommendations they accepted
- taken 11 months (median) to complete them.
However, 132 of 442 unresolved recommendations (30 per cent) are more than 3 years old.
Agencies should pay close attention to resolving these recommendations to mitigate the risks we found in their respective engagements.
Video presentation
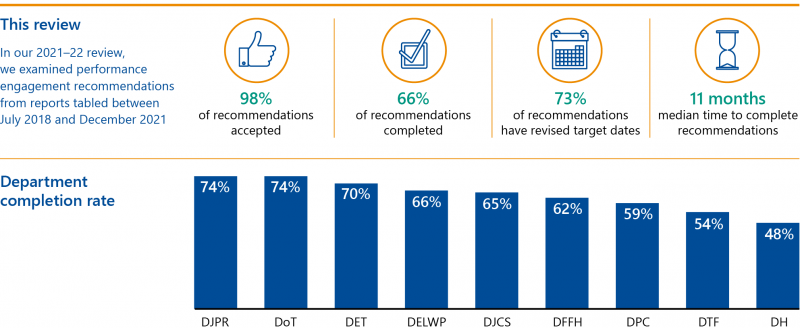
Key facts
Source: VAGO.
1. What we found
We consulted with the audited agencies and considered their views when reaching our conclusions. The agencies’ responses are in Appendix A.
Are agencies accepting our recommendations?
Acceptance rate
Before tabling a report, we ask audited agencies if they accept our recommendations. We ask agencies again as part of this annual review. Of the 1,316 recommendations we made in our reports tabled from July 2018 to December 2021, agencies initially accepted 96 per cent (1,264). That rate has increased to 98 per cent (1,296) at the time of this review.
This change can occur because agencies may see our recommendations as worthwhile implementing when given time to evaluate their activities.
FIGURE 1A: Number of recommendations accepted at time of tabling and time of review
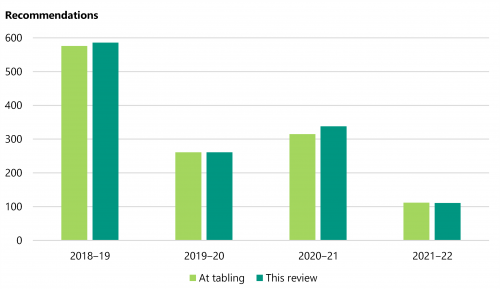
Note: The Department of Health (DH) is reviewing its recommendation reporting process. As a result, we did not survey the acceptance or implementation progress for 6 DH recommendations from 2020‒21 and 10 from 2021‒22. We carried over the existing status of its unresolved recommendations.
Source: VAGO.
Status of accepted recommendations
Status at 31 March 2022
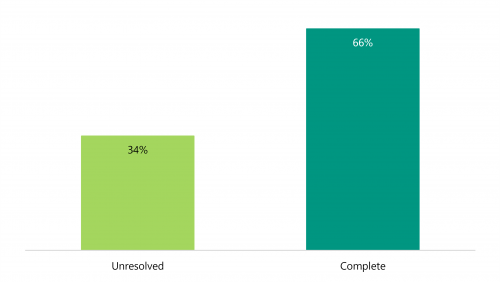
Agencies attested they had completed (or fully implemented) 66 per cent (853) of the 1,296 accepted recommendations, as shown in Figure 1B.
We categorise an unresolved recommendation as either ‘in progress’ or ‘not started’ in our review.
FIGURE 1B: Number of accepted recommendations in this review by status
Source: VAGO.
We show the breakdown of recommendation status by year in Figure 1C.
FIGURE 1C: Status of accepted recommendations by year
| 2021–22 | 2020–21 | 2019–20 | 2018–19 | |
|---|---|---|---|---|
| Complete (%) | 50 (45) | 137 (41) | 213 (82) | 453 (77) |
| In Progress | 47 | 187 | 48 | 132 |
| Not started | 4 | 8 | - | - |
Note: We excluded 16 DH recommendations from 2020–21 to 2021–22 from this breakdown table because it did not provide recommendation statuses for its unresolved recommendations.
Source: VAGO.
Recommendations from 2015–16 to 2017–18
We show the breakdown of recommendation status from earlier years (2015–16 to 2017–18) in Figure 1D.
FIGURE 1D: Status of accepted recommendations from earlier years
| 2017–18 | 2016–17 | 2015–16 | |
|---|---|---|---|
| Complete | 15 | 14 | 4 |
| In progress | 28 | 9 | 1 |
Note: These numbers do not reflect a full dataset of recommendations from these years as we only follow up on unresolved recommendations.
Source: VAGO.
Unresolved recommendations
Breakdown by status and year
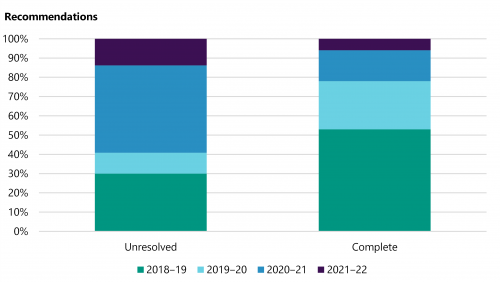
As expected, most complete recommendations are 3 to 4 years old because agencies have had more time to implement them.
Figure 1E shows that the largest proportion of unresolved recommendations (45 per cent) are one to 2 years old and the second largest proportion of unresolved recommendations are 3 to 4 years old.
Based on target dates provided by agencies in this review, we expect to see marked progress for completing these recommendations in next year’s review.
FIGURE 1E: Unresolved and complete recommendations by year
Source: VAGO.
Ageing (4+ years) recommendations
Of the 71 unresolved recommendations we made before July 2018, 38 remain unresolved following this review. These relate to 14 agencies across 15 engagements.
These recommendations make up 8 per cent of the total unresolved recommendations.
We urge the relevant agencies to resolve these recommendations at once so the risks we found in the engagements are addressed and necessary improvements are made.
How agencies are performing
What we reviewed
We compared the completion rate of 2 distinct agency types: government departments and other government entities.
Government departments
Between July 2018 and December 2021, the 9 government departments each received more recommendations than other government entities. This is largely because we include them in more of our engagements.
Departments completed 435 of their 689 accepted recommendations (63 per cent).
FIGURE 1F: Status of accepted recommendations by department (July 2018 to December 2021)
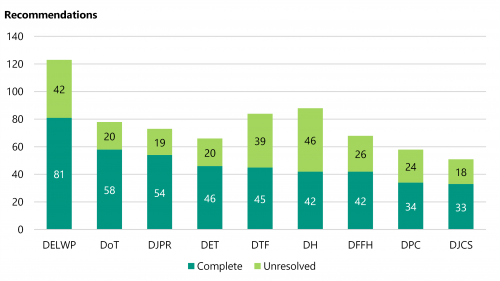
Note: This graph includes DH’s 16 unresolved recommendations with its previous responses carried over.
Source: VAGO.
Government departments: completion rates
Figure 1F shows that DoT had the highest completion rate. It reported that it completed 58 of its 78 recommendations (74 per cent).
In addition, we found that DJCS had a below-average completion rate. It reported that it completed 33 of its 51 recommendations (65 per cent). However, 8 of its 18 unresolved recommendations (44 per cent) are 3 to 4 years old.
Other government entities
Of the 84 other government entities included in this review, which includes authorities, government bodies and councils, 11 reported completing all their recommendations. These entities had 4 or fewer recommendations.
We would also like to highlight Western Health, which completed 16 of its 17 recommendations (94 per cent), and Frankston City Council and Moreland City Council, which both completed 10 of their 11 recommendations (91 per cent).
For a table of agencies' implementation statuses for this review, refer to Appendix F.
How long agencies are taking to complete recommendations
Median completion time (11 months)
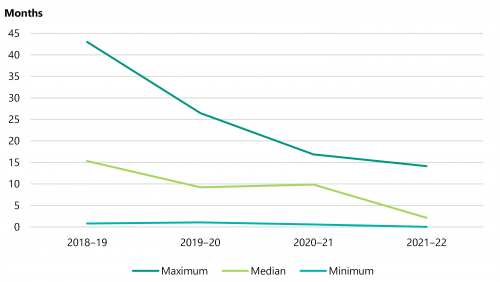
For all agencies across the examined period, it is taking up to 43 months (5.2 years) to fully implement all recommendations, with a median of 11 months.
We see a positive trend in overall timeliness because the range of months to complete a recommendation continues to decrease.
FIGURE 1G: Range of months taken to complete recommendations by financial year (2018–19 to 2021–22)
Source: VAGO.
Achieving completion target dates
The complexity and overall number of individual recommendations may influence the time it takes an agency to complete one. There are also significant differences in agencies' sizes and resources.
When we table a report, we ask agencies to set target dates for how long they expect implementing our recommendations would take from the date of tabling. We asked agencies again in this review, noting several agencies revised their target dates.
For recommendations accepted at time of tabling:
|
Agencies set a target date for ... |
And revised ... |
They kept the original target date for ... |
|---|---|---|
|
1,039 (80 per cent) of the 1,264 recommendations they initially accepted |
756 (73 per cent) of the 1,039 recommendation target dates. |
283 (27 per cent) of the 1,039 recommendations. |
Note: We have discontinued 5 recommendations based on agency feedback that they were no longer applicable or accepted.
Currently, 9 agencies’ target dates have passed for 23 recommendations by a median of 5 months.
Completion times by department
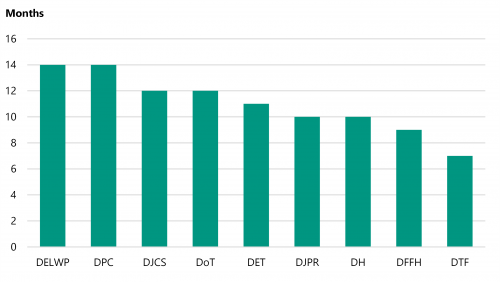
Looking across all 9 government departments, the median number of months taken to complete a recommendation is 10.
FIGURE 1H: Median number of months to complete a recommendation by department
Source: VAGO.
Specifically, we found:
- DELWP and DPC had the equal-longest median completion time among departments, taking a median of 14 months to complete a recommendation
- DELWP completed 82 recommendations with a range of one to 40 months, while DPC completed 34 recommendations with a range of one to 30 months
- all remaining departments had a median completion time of 12 months or less
- DTF had the shortest median completion time. It completed 45 recommendations and took a median of 7 months to complete a recommendation with a range of one to 42 months.
Performance over time for departments
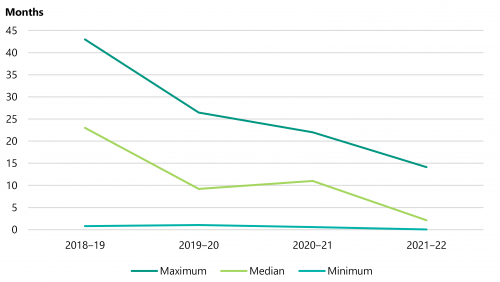
Looking at how long departments took to complete recommendations from reports we tabled between 2018–19 and 2021–22, we see that timeliness is progressively improving. Figure 1I shows the decrease in overall median time to complete a recommendation in months.
FIGURE 1I: Range of timeliness of departments by year
Source: VAGO.
Department performance over time for earlier years (2015–16 to 2017–18) shows a comparatively wide timeliness range of 7 days to 58 months.
See Appendix E for a breakdown of between-year trends for departmental completion times.
Longest completion times
When we look at the number of months to complete individual recommendations, in some cases an agency has taken over 3 years.
FIGURE 1J: Engagements with recommendations that have taken the longest time to complete in this review
| Engagement name | Agency | Recommendation number* | Months to complete |
|---|---|---|---|
| Local Government Insurance Risks | DJPR | 2 | 43 |
| City of Stonnington | 6 | 43 | |
| Managing the Environmental Impacts of Domestic Wastewater | Yarra Valley Water | 16 | 42 |
| Delivering Local Government Services | Wyndham City Council | 1 | 42 |
| State Purchase Contracts | DTF | 5 | 42 |
Note: *This is the reference number we assigned to the recommendation in the tabled report.
Source: VAGO.
In addition, we still have 38 recommendations unresolved from 2015–16 to 2017–18 belonging to 14 agencies, including 8 departments. These recommendations are now over 4 years old. Based on the current target dates agencies specified in this review, we expect them to complete 82 per cent of these recommendations by our next review.
2. How we conducted this review
The Auditor‐General provides independent assurance to the Parliament of Victoria and the Victorian community on the performance of the state and local government public sectors. As part of this limited assurance review, we ask agencies to update us on their implementation of our performance engagement recommendations each year. This provides transparency on government activities where no legislative requirement exists.
Scope of our review
Introduction
We performed a limited assurance review under Section 20 of the Audit Act 1994. We asked agencies to attest to how they had progressed in responding to our performance engagement recommendations.
Our performance engagements assess whether agencies have effective programs and services and whether they are using their resources economically and efficiently. We also identify activities that work well and reflect better practice.
Our engagement reports give recommendations for audited agencies to improve key aspects of their operations. We ask agencies to respond to our recommendations by stating if they accept them, what action they will take and how long they anticipate it will take them to complete them. We include their responses in the final report tabled in Parliament.
We track agencies' progress in addressing our recommendations through this annual follow up survey. Since 2019–20, we have publicly reported on each agency's progress in responding to our recommendations.
What we looked at
We examined all recommendations from performance engagement reports tabled between July 2018 and December 2021. We conducted a survey of audited agencies with unresolved recommendations from this period and asked if they accept our recommendations, and how they are addressing accepted recommendations.
As part of the process, agencies attested that their survey responses were accurate and complete as of 31 March 2022. We include survey responses in Appendix F.
FIGURE 2A: Engagements and recommendations included in this review
| Year of engagement (newest to oldest) | |||||
| 2021‒22 | 2020‒21 | 2019‒20 | 2018‒19 | Total | |
| Engagements | 5 | 20 | 15 | 26 | 66 |
| Agencies* | - | - | - | - | 93 |
| Recommendations | |||||
| Complete | 50 | 137 | 213 | 453 | 853 |
| Unresolved | 61 | 201 | 48 | 132 | 442 |
| Discontinued | 1 | 8 | 8 | 4 | 21 |
Note: *Data not shown by year because agencies can be included in multiple engagements in multiple years.
Source: VAGO.
We also surveyed audited agencies with unresolved recommendations from earlier years (2015–16 to 2017–18). We included complete and discontinued recommendations in our analysis, but we do not have full datasets for these years.
FIGURE 2B: Engagements and unresolved recommendations from earlier years
| Year of engagement (newest to oldest) | ||||
| 2017‒18 | 2016‒17 | 2015‒16 | Total | |
| Engagements | 15 | 8 | 5 | 28 |
| Agencies* | - | - | - | 27 |
| Recommendations | ||||
| Completed this review | 15 | 14 | 4 | 33 |
| Unresolved | 28 | 9 | 1 | 38 |
Note: *Data not shown by year because agencies can be included in multiple engagements in multiple years.
Source: VAGO.
For a full list of the audits and agencies included in this review, see Appendix D.
What we left out and why
This review focused on recommendations from July 2018 to December 2021. While we also looked at unresolved recommendations from 2015–16 to 2017–18, we left out complete recommendations from this time.
Other ways we monitor our engagements
Beyond this annual limited assurance review, we may undertake specific follow-up engagements on causes of deficient performance. There are 2 follow-up reviews in our current forward program for Protecting Victoria's Coastal Assets (original engagement tabled in 2018) and Maintaining the Mental Health of Child Protection Practitioners (original engagement tabled in 2018).
More information
For a more complete picture of agency performance, refer to the review dashboard on our website (www.audit.vic.gov.au), where we have included each agency's status and response to recommendations made between July 2018 and December 2021.
Appendix A. Submissions and comments
Click the link below to download a PDF copy of Appendix A. Submissions and comments.

Appendix B. Acronyms, abbreviations and glossary
Click the link below to download a PDF copy of Appendix B. Acronyms, abbreviations and glossary,
Click here to download Appendix B. Acronyms, abbreviations and glossary
Appendix C. Scope of this review
Click the link below to download a PDF copy of Appendix C. Scope of this review.
Appendix D. Engagements and agencies in this review
Click the link below to download a PDF copy of Appendix D. Engagements and agencies in this review.
Click here to download Appendix D. Engagements and agencies in this review
Appendix E. Between-year trends of departmental completion times
Click the link below to download a PDF copy of Appendix E. Between-year trends of departmental completion times.
Click here to download Appendix E. Between-year trends of departmental completion times
Appendix F. Agency responses to assurance review
Click the link below to download a PDF copy of Appendix F. Agency responses to assurance review.
Click here to download Appendix F. Agency responses to assurance review