Universities: 2016 Audit Snapshot
Overview
In this report, we outline the results of, and our observations from, the 2016 financial report audits of the eight Victorian universities and their 51 controlled entities. We also assess the sector’s financial performance during 2016, and assess its sustainability as at 31 December 2016.
We make three recommendations directed to the universities.
Universities: 2016 Audit Snapshot: Message
Ordered to be published
VICTORIAN GOVERNMENT PRINTER June 2017
PP No 261, Session 2014-2017
President
Legislative Council
Parliament House
Melbourne
Speaker
Legislative Assembly
Parliament House
Melbourne
Dear Presiding Officers
Under the provisions of section 16AB of the Audit Act 1994, I transmit my report Universities: 2016 Audit Snapshot.
Yours faithfully

Andrew Greaves
Auditor-General
5 June 2017
Audit overview
There are eight public universities in Victoria, which control a further 51 entities. We conduct the financial audits of all of these 59 entities. This report outlines the results of, and our observations from, these financial audits for the year ended 31 December 2016. We also discuss the frameworks in place for identifying and managing the risk of fraud, and comment on the financial sustainability of the sector.
Conclusion
Financial sustainability, reporting and internal controls in the university sector are generally sound. There are opportunities to build on what has been achieved and improve further.
Findings
Audit opinions
We issued audit opinions to 55 of the 59 university sector entities on their financial reports for the year ended 31 December 2016. We had yet to complete our audits of the remaining four entities at the date of this report.
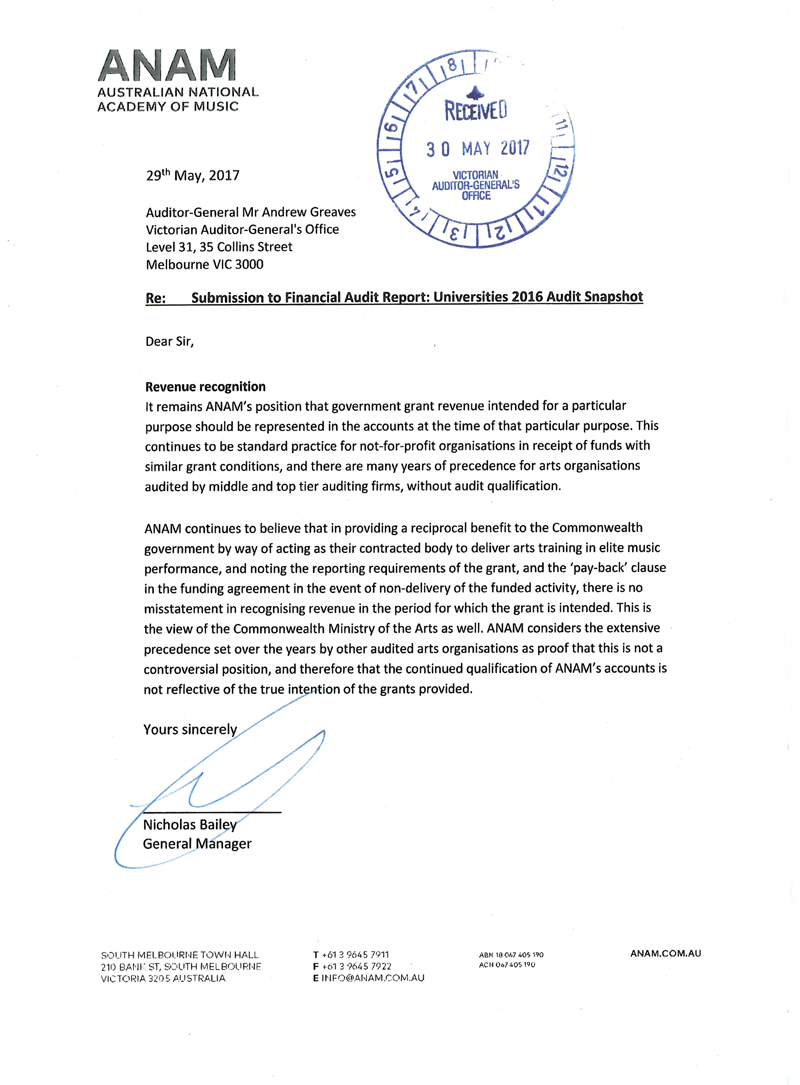
All but three of our opinions were clear. We qualified the 2016 financial reports of Deakin University, the University of Melbourne and the Australian National Academy of Music (ANAM). We also qualified the 2015 ANAM financial report after our report Universities: 2015 Audit Snapshot was tabled in Parliament.
In our opinion, the accounting for grant revenue in these four financial reports does not comply with the requirements of Australian Accounting Standards.
Revenue recognition is a longstanding issue in the university sector. New accounting standards, which adopt a different approach to revenue recognition and measurement, are due to apply in coming financial years. This is an opportune time for the sector to review and realign their revenue accounting policies, as they will need to do a significant amount of work to be able to comply with these new standards.
Internal controls
To the extent we tested them, we assessed the internal financial controls at the universities to be adequate for reliable financial reporting. We raised 47 internal control issues across the eight universities. Most of these issues related to their information technology environments.
Universities are taking corrective action on the issues we report to them, with 80 per cent of issues from prior years resolved in 2016.
This year we conducted a focused review of the fraud control frameworks at universities—an important element of their internal control environment.
The universities take a comprehensive view on what constitutes fraud, consistent with Australian standards. They have up-to-date and sound policies and procedures in place to manage their fraud risks.
Most had in place all of the key elements we would expect to see in an effective fraud control framework, but there were some important components missing:
- none of the eight universities has a documented fraud control plan in place
- no university has training in place to ensure that contractors and volunteers are aware of their codes of conduct and policies relating to fraud
- most universities have not complied with their legislative reporting requirements for reporting fraud to the Auditor-General.
Financial sustainability
The university sector as a whole remains financially strong. Assets in the sector totalled $20.8 billion at 31 December 2016 compared with liabilities of $4.8 billion.
The universities have large cash and investment holdings and relatively low debt. The composition of their balance sheets has shifted over the past five years, with universities investing their surplus money in more long-term instruments for better returns.
At the same time, universities have taken on more debt to fund capital investment. This has caused the short-term liquidity ratio for the sector to decline, although the ratio remains above one, which means the sector has enough liquid assets to meet current obligations as they arise.
The universities' strong financial performance is underpinned by year-on-year growth in student enrolments, which has led to revenue growth. However, the net result margin at the sector level is declining. This indicates that universities could do more to identify opportunities to improve their cost‑effectiveness and efficiency.
To cater for the growth in enrolments, the rate of capital investment in the sector has grown since 2014. The sector has taken advantage of low interest rates, and has increased its borrowings to fund capital projects.
Despite this, we noted that for three of the eight universities the expenditure on renewing and maintaining their physical assets in 2015 and 2016 was lower than the assets' decline in value through use. If this trend continues over a longer term, those universities face an increased risk that their assets may not be in a suitable condition to meet operational needs.
Recommendations
We recommend that universities:
1. prepare for the new accounting standards for revenue by:
- working together to share technical advice and implementation issues
- updating their policies, process and systems as required (see Section 2.2)
2. strengthen their fraud risk management by:
- documenting a fraud control plan as part of their risk management framework
- making contract staff and volunteers aware of their codes of conduct and policies on fraud through training
- reporting all significant and systemic frauds to the Auditor-General as soon as they become known (see Section 3.2.2)
3. review their long-term plans for asset renewal and replacement to satisfy themselves they will be able to be maintained and replaced when needed (see Section 4.2).
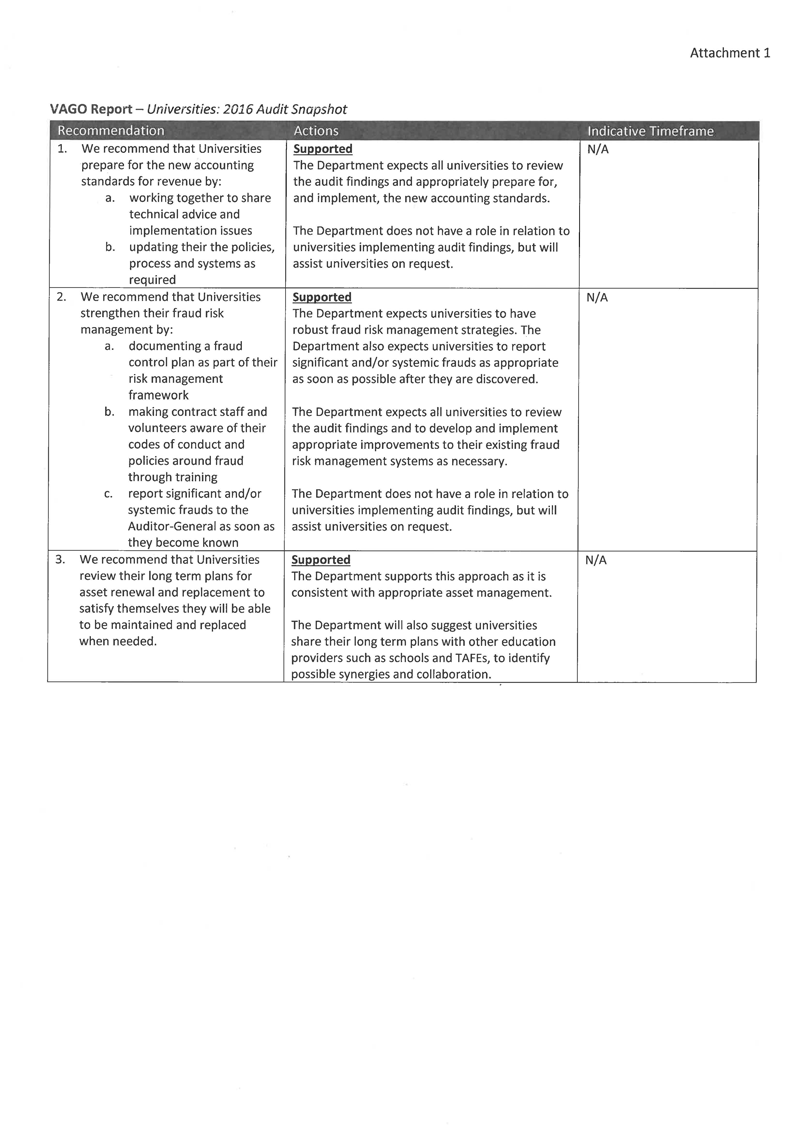
Responses to recommendations
We have consulted with the Department of Education and Training and the eight public universities in Victoria, and we considered their views when reaching our audit conclusions. As required by section 16(3) of the Audit Act 1994, we gave a draft copy of this report to those universities and asked for their submissions and comments.
The following is a summary of those responses. The full responses are included in Appendix A.
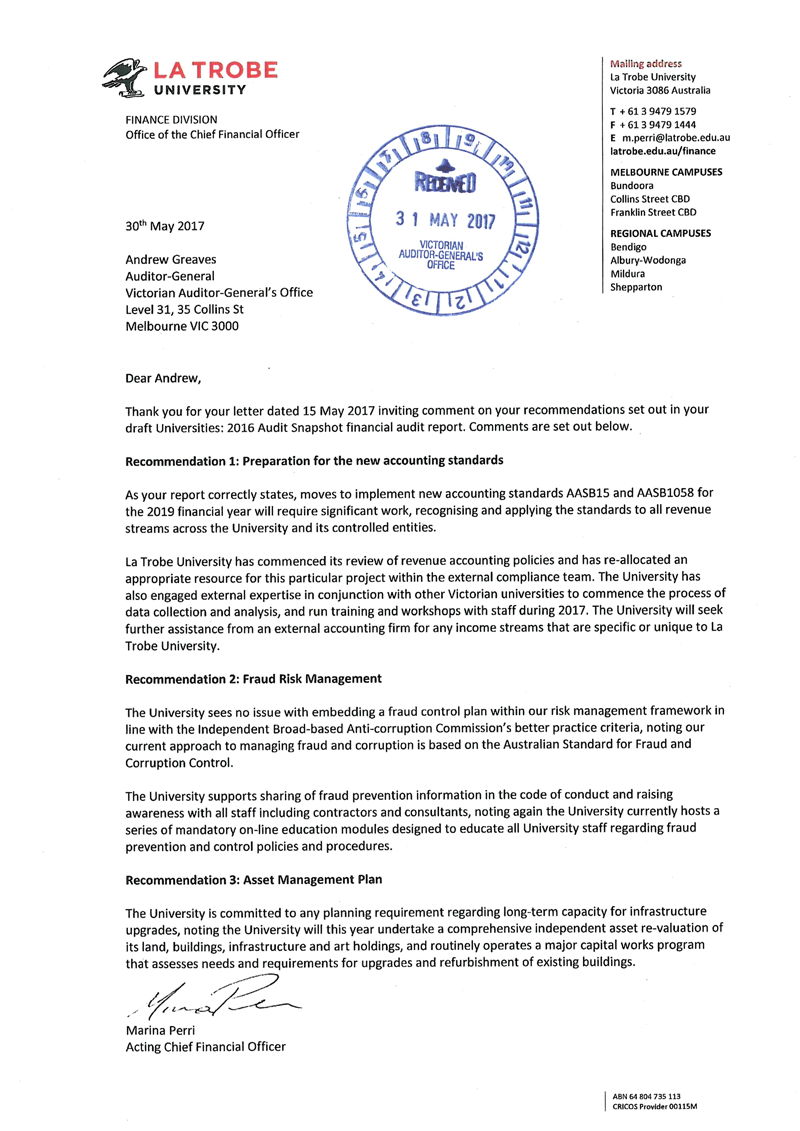
We received four submissions from the sector and a response from the Department of Education and Training. The Department of Education and Training and La Trobe University accepted our recommendations and provided details about how they will be addressed.
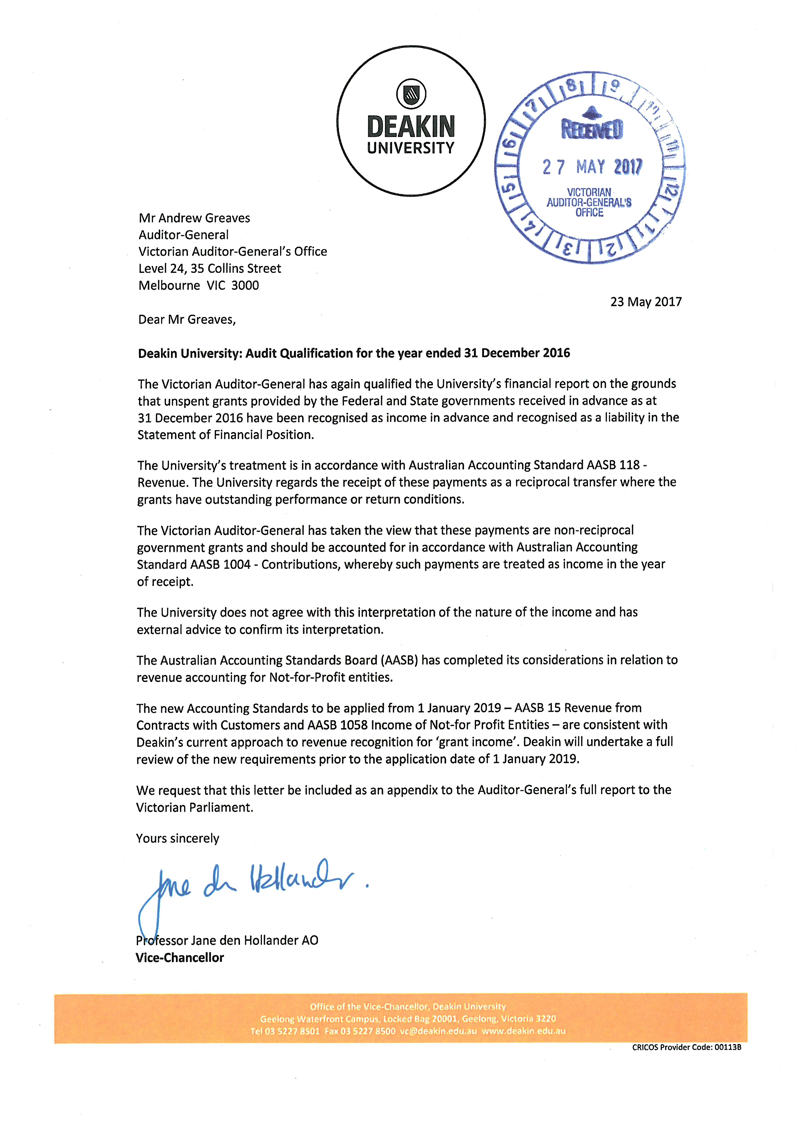
Deakin University and the Australian National Academy of Music do not agree with our interpretation of the nature of their revenue that led to their reports being qualified. This is discussed further in Part 2 of the report.
Victoria University highlighted that their liquidity ratio has decreased due to their change in investment strategy, which is consistent with our comments on the sector in Part 4.
1 Context
1.1 Sector overview
Eight universities and their 51 controlled entities make up the public university sector in Victoria. Collectively, they make a significant contribution to the state and national economy through their principal activities of higher education and research.
The universities provide higher education services to both domestic and international students. Enrolments have grown steadily by around 4 per cent each year since 2012, and there were about 370 000 students enrolled in 2016.
Over the past five years, foreign students have consistently accounted for around 30 per cent of total enrolments. As most foreign students pay full fees, they are a significant source of revenue for most universities.
The sector has progressively increased its international operations in an effort to diversify and broaden its reach to international students. This includes establishing overseas offices and campuses, developing partnerships with foreign higher education providers, and offering distance learning and cloud-based options.
The research conducted by the sector contributes to expanding knowledge and improving efficiency, with broad and far-reaching benefits. Higher Education Research and Development statistics show Victoria had the second highest expenditure—behind New South Wales—on higher education research and development in 2014.
Aside from research and education, universities also engage in a number of other income-generating activities, including providing student accommodation, health and fitness facilities and other services, to supplement and support the experiences of their staff and students.
To fund their operations, the sector relies primarily on student fees and government funding. Figure 1A provides an overview of the sector's operations.
Figure 1A
Overview of the university sector
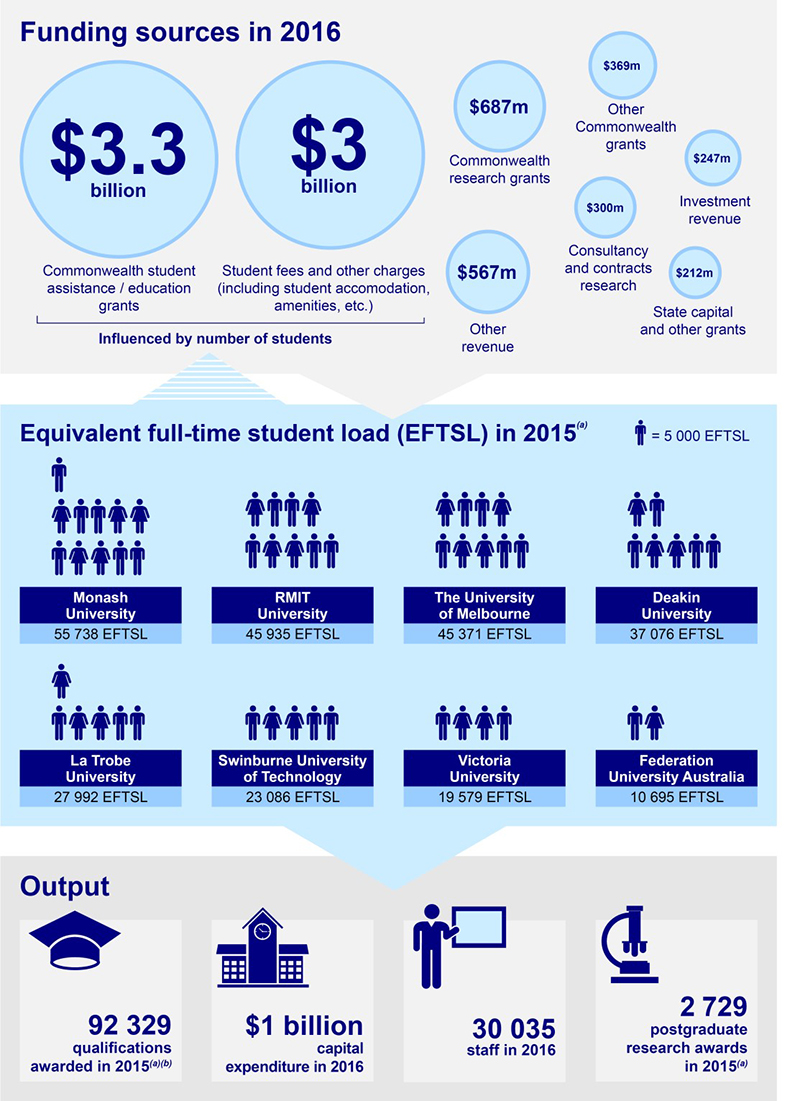
(a) 2016 student enrolment and completion data was not available as at 10 May 2017.
(b) excludes postgraduate research awards.
Source: VAGO and the Australian Government Department of Education and Training Higher Education Statistics Data Cube (uCube).
1.2 Legislative and financial reporting framework
The universities and their controlled entities are subject to a range of accountability and reporting frameworks, with many and varied reporting requirements. As a result, universities' financial reporting is complex.
At the state level, universities fall within the definition of a public body under the Financial Management Act 1994 (FMA). As a result, they must comply with the reporting and other requirements of the FMA, particularly in the preparation of their annual financial reports.However, the universities are not controlled by the state of Victoria, and their financial results are not part of the state's annual financial report.
From the perspective of the Commonwealth, universities:
- are registered with the Federal Tertiary Education Quality and Standards Agency, and are therefore subject to the regulation of the Tertiary Education Quality and Standards Agency Act 2011 (TEQSA Act)
- receive the majority of their grant funding from the Commonwealth Government, and fall withinthe scope of any legislation associated with this funding, including the Higher Education Support Act 2003 (HESA Act).
The TEQSA and HESA Acts, and many of the funding agreements for research and other grants, also impose financial reporting requirements on the universities. The Commonwealth requires some of these reporting requirements to be included in universities' annual financial reports. As a result, the disclosures in universities' annual financial reports exceed the requirements of the Australian Accounting Standards.
Many universities and their controlled entities are registered charities with the Australian Charities and Not-for-profits Commission. This means they have further reporting obligations under the Australian Charities and Not-for-profits Commissions Act 2012.
1.3 What we cover in this report
In this report, we provide information on the outcomes of our financial audits of the eight Victorian universities and their 51 controlled entities for the year ended 31 December 2016. The financial results of controlled entities are consolidated into those of their respective parent entities, and we do not discuss them separately in this report.
We identify and report on the key matters arising from our audits, and provide an analysis of the information included in the universities' financial reports.
Figure 1B outlines the structure of this report.
Figure 1B
Report structure
|
Part |
Description |
|---|---|
|
2 Results of audits |
Comments on the results of the financial report audits of the public universities and their controlled entities for the 2016 financial year. |
|
3 Internal control |
Summarises the internal control issues observed during our audits and comments on the fraud control frameworks in place across the sector. |
|
4 Financial sustainability |
Provides an insight into the university sector's financial outcomes, including sustainability risks and challenges. |
Source: VAGO.
Appendix B provides a list of all 59 entities included in this report, and details the financial audit opinions issued for the year ended 31 December 2016.
We carried out the financial audits of these entities under section 8 of the Audit Act 1994 and Australian Auditing Standards. Each entity pays the cost of its audit.
The cost of preparing this report was $125 000, which is funded by Parliament.
2 Results of audits
2.1 Financial report audit opinions
Independent audit opinions add credibility to financial reports by providing reasonable assurance that the information reported is reliable and accurate. A clear audit opinion confirms that the financial report presents fairly the transactions and balances for the reporting period, in keeping with the requirements of relevant accounting standards and applicable legislation. We carried out our financial audits of the university sector entities in accordance with the Australian Auditing Standards.
Figured 2A outlines the status of the sector's financial audits, and the types of opinions issued to each entity.
Figure 2A
Status of the sector's 2016
audit opinions as at 31 May 2017
Entity |
Clear opinion |
Modified opinion |
In progress |
|---|---|---|---|
Universities |
6 |
2 |
– |
Controlled entities |
46 |
1 |
4 |
Source: VAGO.
We issued clear audit opinions for the financial year ended 31 December 2016 to six universities and 46 controlled entities.
The 2016 audit opinions of the following entities were modified (qualified) because in our opinion the recognition of grant revenue did not align with the requirements of the Australian Accounting Standards:
- The University of Melbourne
- Deakin University
- Australian National Academy of Music (ANAM).
We also modified our audit opinion on the 31 December 2015 financial report of ANAM, which was issued after our report Universities: 2015 Audit Snapshot was tabled in Parliament.
The qualified financial reports of these entities treat grant income as a liability and they do not include it as revenue until they provide the services required by the grant.
Australian Accounting Standard AASB 1004 Contributions requires these grants to be recorded as revenue when they are received. The effect of this timing difference can be material to the revenue and net result in any given year, and a liability appears in the balance sheet when no obligation to pay that money exists.
These qualifications alert readers of the financial reports to be cautious when interpreting the financial results and financial positions in the qualified reports. The revenue, net result and liability amounts cannot be compared between universities because different recognition principles have been applied for revenue.
These qualified audit opinions are longstanding issues in the university sector.
2.2 Changes to revenue recognition
The accounting standards that set the recognition and measurement principles for revenue are about to change. This represents an opportunity for the university sector as a whole, particularly those entities whose financial reports have qualified audit opinions, to review and realign their policies on revenue recognition.
There are two new accounting standards on revenue:
- AASB 15 Revenue from Contracts with Customers (AASB 15)
- AASB 1058 Income of Not-for-profit Entities.
These standards will apply to the 2019 financial reports, and will supersede the revenue requirements for public sector entities that are currently in AASB 1004 Contributions.
Applying these new standards will require significant work by the universities and their controlled entities. They will need to assess how they recognise and measure all current types of revenue against the principles of the new standards.
To implement AASB 15, universities and their controlled entities will need to review all existing and potential contractual arrangements so that the contractual performance obligations that will drive revenue recognition are clearly defined. They will need to review existing systems to ensure they can capture the performance obligations and the evidence of when they have been satisfied to trigger recognition of revenue. System changes may be necessary and entities will need to allow adequate time for this to occur.
Given universities are large entities—many with devolved contract management responsibilities—the effort required for them to understand, capture and record the required information may be significant.
Staff in functional areas and faculties who will need to interpret and apply the principles in the new accounting standards may need training, and changes to policies and procedures may be required. The financial reporting team should monitor the changes to provide assurance that revenue is being recognised and measured correctly.
The new standards will apply from 2019, and comparative information will need to be disclosed. In effect, this means that all entities will need to recognise and measure revenue numbers against the new requirements for the 2018 financial year.
As a result of these changes, the university sector has only a short time frame to implement the necessary changes in policies, procedures and systems.
We see this as a good opportunity for the sector to work together, and with universities in other states, to share the challenge of implementing these standards, and develop a consistent approach to the treatment of common types of revenue.
3 Internal controls
Effective internal controls help entities to meet their objectives reliably and cost‑effectively. Strong internal controls are a prerequisite for delivering reliable, accurate and timely external and internal financial reports.
In our annual financial audits, we consider the internal controls relevant to financial reporting, and assess whether entities have managed the risk that their financial reports will not be complete and accurate. Poor internal controls make it more difficult for entity management to comply with relevant legislation, and increase the risk of fraud and error.
3.1 Internal control observations
To the extent we tested them, universities' internal controls for financial reporting were adequate for ensuring their financial reporting is reliable. However, some important internal controls need to be strengthened and financial reporting matters need to be addressed.
During 2016, we identified 47 internal control weaknesses and financial reporting issues, and reported them to management and university audit committees.
Figure 3A shows the risk rating of the issues we identified, excluding the 16 low-risk issues we reported. These low-risk issues were minor control weaknesses or opportunities to improve existing processes or internal controls. We define each risk rating in Appendix C.
Figure 3A
Reported issues by area and risk rating
Area of issue |
Risk rating |
Total |
||
|---|---|---|---|---|
Extreme |
High |
Medium |
||
Assets |
– |
1 |
3 |
4 |
Expenditure/accounts payable |
– |
1 |
1 |
2 |
Financial reporting |
– |
1 |
2 |
3 |
Governance |
– |
– |
4 |
4 |
IT controls |
– |
3 |
10 |
13 |
Payroll |
– |
– |
4 |
4 |
Reconciliation |
– |
– |
1 |
1 |
Total |
– |
6 |
25 |
31 |
Source: VAGO.
Forty-two per cent of the issues raised related to the information technology (IT) control environment at the universities. Universities, as with other public sector entities, rely heavily on IT systems. Common areas of concern include poor user access, poor password controls, and weaknesses in disaster recovery programs. Weaknesses in security and automated controls make material errors and fraud more likely and harder to detect.
Status of matters raised in previous audits
As part of our financial audit process, we monitor the resolution of previously reported control weaknesses and financial reporting issues. We provide information to university managers and their respective audit committees about the status of these issues.
Seventy issues remained open at the start of 2016. Encouragingly, 80 per cent of these matters were resolved during 2016.
Figure 3B shows the internal control weaknesses and financial reporting issues raised in previous audits, with the resolution status by risk.
Figure 3B
Prior year issues by resolution status at 31 December 2016
Status of prior period issue |
Risk rating |
Total |
||
|---|---|---|---|---|
Extreme |
High |
Medium |
||
Resolved |
– |
16 |
40 |
56 |
Unresolved |
– |
5 |
9 |
14 |
Total |
– |
21 |
49 |
70 |
Source: VAGO.
Most unresolved issues relate to IT controls, with universities not properly dealing with the root causes of problems and consequently only partially implementing our recommendations.
The universities' failure to resolve these problems reduces the effectiveness of their internal control environments.
3.2 Fraud controls
Each year we select one area of internal control and perform a more detailed review of the controls and related operating environment. For our 2016 audits we reviewed the fraud control frameworks in place at universities—a key component of the internal control environment.
The risk of fraud is inherent in all entities. When fraud occurs in public sector entities such as universities, public money is lost.
Australian Standard 8001:2008 Fraud and Corruption Control (AS 8001) identifies three clear activities that are considered to be fraud:
- theft of money or property
- deliberate falsification, concealment, destruction or use of falsified documentation
- improper use of information or position for personal financial benefit.
Universities should be alert to opportunities for fraud to occur, given the nature of their business. They need to design and implement frameworks to mitigate any risks as part of their routine risk management activities.
The Independent Broad Based Anti-Corruption Commission (IBAC) has published a checklist to help public entities assess whether their fraud risk management is better practice. This checklist is included in Appendix E. Figure 3C summarises the key aspects of better practice that should be included in a fraud control framework, based on the checklist.
Figure 3C
Key elements of an effective fraud control framework
Managing the risk of fraud |
Practice and culture |
|---|---|
|
|
Source: VAGO, based on Controlling fraud and corruption: a prevention checklist, IBAC, 2013.
We assessed the fraud risk management framework at the eight Victorian universities against better practice criteria, including the IBAC checklist, AS8001 and the Standing Directions of the Minister for Finance 2016.
3.2.1 Managing the risk of fraud
Most universities have sound policies and procedures in place to manage their fraud risks. Overall, the policies and procedures underpinning the fraud control frameworks are up to date, and there is evidence of recent management review.
All universities defined fraud to include the three components outlined above, consistent with AS 8001. This means the universities have a comprehensive view of fraud.
The following key elements of an effective fraud control framework were evident at most universities:
- corruption prevention principles form part of strategic planning, project planning and business processes
- management, internal audit and audit committees conduct ongoing scrutiny of internal controls
- independent reviews are conducted of the operation and effectiveness of internal controls to prevent, deter and or detect frauds
- a member of management is responsible for fraud control, including communicating to employees the university's commitment to controls, and management's approach to preventing, detecting and responding to fraud and corruption
- fraud control is monitored and reported on at least annually
- procedures are in place to guide the conduct of high-risk activities such as tendering, accounts payable and managing assets
- the university has a policy on the acceptance of gifts and benefits, which it communicates to staff
- pre-employment screening is conducted of qualifications, credit history, criminal history and potential factors that may raise a fraud risk
- credentials of new suppliers and customers are checked.
Although universities have the key elements of a fraud control framework, there is scope for improvement.
3.2.2 Areas for improvement
Documented fraud control plan
Frauds risks are being identified and managed within the strategic risk register at most of the universities. However, none of the eight universities had a documented fraud control plan to support and manage this risk.
A fraud control plan is a key operational document that explains how the university's fraud policy, risk register, and strategies for prevention, detection and response are integrated, and how they are put into practice and reviewed. Fraud control plans should include:
- a summary of the university's major fraud risks, identified by conducting a fraud risk assessment and incorporating knowledge of fraud trends
- treatment strategies or controls in place to mitigate material fraud risks
- roles and responsibilities identified for implementing and monitoring key prevention, detection and response initiatives
- performance measures in place, including procedures for assessing the plan's effectiveness.
A well prepared fraud control plan can provide a university with assurance that they are aware of all major fraud risks, and that they have adequate prevention, detection and response initiatives in place.
Not having a fraud control plan could mean that significant areas of fraud risk are not identified and controlled, putting a university at risk of financial loss.
Practice and culture
Fraud awareness and a university's designated fraud control framework should be communicated to and embedded throughout the university to be effective. Staff must be trained to understand the fraud control framework, and training should be refreshed and delivered periodically to maintain staff awareness.
We found that most universities include fraud awareness and reporting in induction training for new staff. Refresher training is generally provided every two to three years. Specific training is also designed and provided to employees more likely to encounter fraud, such as procurement officers and executives.
To support this, universities should have a code of conduct, and create a culture that supports ethical behaviour. This is in place at all universities, is communicated to employees, and sets out the values employees are expected to uphold.
Universities engage a large number of external resources such as contractors and volunteers. As these external resources are acting on behalf of a university, it is important that they are aware of and trained in the universities' fraud policies—just like directly employed staff members—to reduce the risk of fraud. This would also increase the likelihood of potential fraud being identified and reported.
Currently, no university has fraud training in place for contractors and volunteers. Universities have an opportunity to reduce their risk of fraud in this area.
Reporting of fraud
A reporting system that records all allegations of fraud, investigations and outcomes can provide an overview of the nature, extent and location of fraud that is occurring. It can also form the basis for developing an intelligence capability and risk profiles of potential fraud suspects, and provide data to identify trends.
All universities have in place reporting mechanisms for employees to report suspected fraud and other improper conduct. Most universities also have established procedures for supporting and protecting disclosures as required by the Protected Disclosure Act 2012 (Vic).
Universities, as public bodies under the Financial Management Act 1994, are required to notify the Minister for Finance, their audit committee, the relevant government department and the Auditor-General when they become aware of significant or systemic fraud, whether actual or suspected. This is a new requirement that came in to effect on 1 July 2016. Before this, all instances of fraud, theft or loss had to be reported to the Minister and the Auditor-General annually, subject to certain thresholds.
Two universities are not maintaining adequate records of all actual and suspected fraud, corruption and other losses, including remedial action planned or taken. Further, only two universities made a report of fraud, thefts and losses to the Auditor-General during 2016.
Given the size and complexity of university operations, this indicates to us that there is insufficient reporting of suspected and actual fraud occurring across the universities, and universities are not complying with their legislative requirements.
In a recent example, an incident of attempted cyber fraud perpetrated by an external party for $3.4 million and instances of contracts worth $0.4 million awarded to undeclared related parties were not reported to the Auditor-General. This limits our ability to effectively assess the risk in the sector when conducting our financial audits.
4 Financial sustainability
To be financially sustainable, entities need to be able to fund their current and future spending. They also need to be able to absorb the financial effects of changes and financial risks, without significantly changing their revenue and expenditure policies. This includes the ability to fund asset replacement and renewal in a timely manner. A university's ability to do this can be impacted by funding and regulatory environments. Changes to funding policies in the university sector are pending, which present a challenge for universities in their planning for future financial sustainability.
The detailed data and calculations that underpin our commentary in this Part of the report are provided in Appendix D, which lists our financial sustainability indicators, risk assessment criteria, benchmarks and the results of each indicator for each of the universities over the five financial years 2012 to 2016.
4.1 Financial position and performance
Universities all have strong financial positions, with significant holdings of cash and investments and relatively low debt. They are using their strong position and their ability to source debt in private markets to try to maximise returns on their investments while increasing their capital development.
The sector's net asset position is strong, with total assets over four times the total liabilities, as shown in Figure 4A.
Figure 4A
Financial position of the university sector, 2012 to 2016
|
2012 $ million |
2013 $ million |
2014 $ million |
2015 $ million |
2016 $ million |
|
|---|---|---|---|---|---|
|
Total assets |
16 821.4 |
17 008.4 |
18 057.6 |
19 378.2 |
20 770.3 |
|
Total liabilities |
4 189.4 |
3 785.3 |
4 078.6 |
4 327.2 |
4 828.2 |
|
Net assets |
12 632.0 |
13 223.1 |
13 979.0 |
15 051.0 |
15 942.1 |
Source: VAGO.
While the sector's financial position has remained relatively stable, the composition of its balance sheet has shifted over the past five years. This shift is due to increased investment in longer-term assets, and greater use of debt to fund capital development.
The liquidity ratio demonstrates some of this shift and is shown in Figure 4B. The sector's short-term liquidity has declined since 2015, and is at its lowest level in the past five years. However, the ratio remains above 1.00, which means there are no immediate concerns about the sector meeting its short-term financial obligations as they become due.
Figure 4B
The university sector's liquidity, 2012 to 2016
|
Indicator |
Average across all entities in the sector per year |
||||
|---|---|---|---|---|---|
|
2012 |
2013 |
2014 |
2015 |
2016 |
|
|
Liquidity |
1.50 |
1.47 |
1.16 |
1.27 |
1.04 |
Source: VAGO.
The trend in the liquidity ratio indicates that universities are:
- using their excess cash to purchase longer-term investments
- increasing borrowings, including short-term borrowings.
Investing cash in longer-term investments is done with the objective of generating higher returns. Although technically these investments do not meet the definition of current assets, most can still be converted relatively quickly to cash as required.
Borrowings are increasing as universities use this source of money to fund capital investments. These borrowings are largely long-term debt, but a portion will always be due for repayment within the next 12 months.
We observed active monitoring and management of cash flow occurring at most universities. This mitigates the risk that universities will not have money ready to pay their bills as and when they fall due.
Operating results
The sector continues to report net profits, with revenue growth due largely to increased enrolments. The revenue and expenditure for the sector over the past five years is shown in Figure 4C.
Figure 4C
Financial overview of university sector from 2012 and 2016
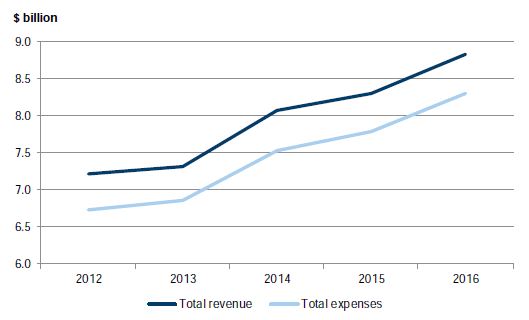
Source: VAGO.
The net result margin has shown an overall decline over the past five years. The results are shown in Figure 4D.
Figure 4D
The university sector's net result margin from 2012 to 2016
|
Indicator |
Average across all entities in the sector per year |
||||
|---|---|---|---|---|---|
|
2012 |
2013 |
2014 |
2015 |
2016 |
|
|
Net result margin |
7.65% |
5.45% |
4.32% |
4.83% |
4.24% |
Source: VAGO.
The declining net result margin indicates that the sector may have room to improve its management of costs. This will be particularly important in the future, as the proposed funding changes, if introduced, could affect revenue growth in the sector.
4.2 Capital investment
In response to the growth in student numbers, and to take advantage of student accommodation grants in recent years, many of the universities have increased the rate of investment in their physical assets. There are significant ongoing and planned capital development projects in the sector. This can be seen in the increase in payments for capital expenditure since 2014, shown in Figure 4E.
Figure 4E
Payments for capital expenditure
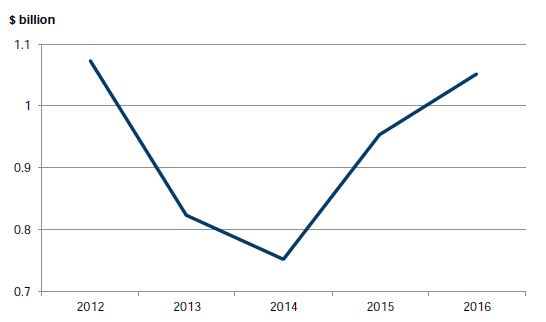
Source: VAGO.
Although these activities have been historically funded from the universities' own cash reserves, some universities have begun taking advantage of recent low interest rates, and are taking on more debt to fund their projects.
To date, the strong net asset position has enabled the sector to take on more debt without any significant impact on its longer-term sustainability.
The increasing investment in assets is evident in our capital replacement indicator. Through this indicator we consider how much the sector is spending on renewing assets compared to the level of assets consumed, as measured by depreciation. The results since 2012 are shown in Figure 4F.
Figure 4F
University sector's capital replacement indicator, 2012 to 2016
|
Indicator |
Average across all entities in the sector per year |
||||
|---|---|---|---|---|---|
|
2012 |
2013 |
2014 |
2015 |
2016 |
|
|
Capital replacement |
2.71 |
2.10 |
1.52 |
1.67 |
1.74 |
Source: VAGO.
The capital replacement indicator has increased since 2014 and shows a trend of increasing investment. Each year the indicator has exceeded 1.5, which is a strong result. This indicates that the majority of universities' assets are being renewed and maintained so that they retain their intended function.
Although the total sector has achieved good results, the individual capital replacement ratios of three universities have been below 1.0 for the past two years. This is shown in the detailed results in Appendix D.
We consider the capital replacement ratio to be a long-term indicator of sustainability, given that capital replacement can be deferred in the short term. Inadequate expenditure on asset renewal and maintenance may lead to assets, including equipment and infrastructure, deteriorating to a point where they are unsuitable for use.
Appendix A.Audit Act 1994 section 16—submissions and comments
We have consulted with all universities and the Department of Education and Training throughout the course of the audit. As required by section 16(3) of the Audit Act 1994, we gave a draft copy of this report, or relevant extracts, to those entities and asked for their submissions and comments.
Responsibility for the accuracy, fairness and balance of those comments rests solely with the entity head.
Responses were received as follows:
- Department of Education and Training
- Australian National Academy of Music
- Deakin University
- La Trobe University
- Victoria University
RESPONSE provided by the Secretary, Department of Education and Training
RESPONSE provided by the General Manager, Australian National Academy of Music
RESPONSE provided by the Vice-Chancellor, Deakin University
RESPONSE provided by the Acting Chief Financial Officer, La Trobe University
RESPONSE provided by the Vice-President Finance and Chief Financial Officer, Victoria University
Appendix B. Audit opinions issued
Figure B1 lists the entities included in this report. It details the date an audit opinion was issued to each entity for their 2016 financial report, and the nature of that opinion.
Figure B1
Audit opinions issued to the university sector for 2016
Entity |
Clear audit opinion issued |
Auditor-General's report signed |
|---|---|---|
Deakin University |
Modified(a) |
21 Mar 2017 |
Deakin Digital Pty Ltd |
✓ |
22 Mar 2017 |
Deakin Residential Services Pty Ltd |
✓ |
22 Mar 2017 |
iHosp Pty Ltd |
✓ |
22 Mar 2017 |
Unilink Ltd |
✓ |
22 Mar 2017 |
Federation University |
✓ |
23 Feb 2017 |
Brisbane Educational Services Pty Ltd |
✓ |
15 Mar 2017 |
Datascreen Pty Ltd |
✓ |
15 Mar 2017 |
Inskill Pty Ltd |
✓ |
14 Mar 2017 |
The School of Mines and Industries Ballarat Limited |
✓ |
14 Mar 2017 |
UB Housing Pty Ltd |
✓ |
7 Mar 2017 |
La Trobe University |
✓ |
15 Mar 2017 |
Medical Centre Developments Pty Ltd |
✓ |
17 Mar 2017 |
Monash University |
✓ |
23 Mar 2017 |
Monash Accommodation Services Pty Ltd |
✓ |
23 Mar 2017 |
Monash College Pty Ltd |
✓ |
15 Feb 2017 |
Monash Commercial Pty Ltd |
✓ |
27 Apr 2017 |
Monash Custodians Pty Ltd |
n/a |
Not yet signed |
Monash Investment Holdings Pty Ltd |
✓ |
5 Apr 2017 |
Monash Investment Trust |
✓ |
5 Apr 2017 |
Monash Property South Africa Pty Ltd |
✓ |
27 Apr 2017 |
Monash University Foundation |
✓ |
3 Apr 2017 |
Monash University Foundation Pty Ltd |
✓ |
3 Apr 2017 |
Monash University Indonesia Limited |
n/a |
Not yet signed |
RMIT University |
✓ |
1 Mar 2017 |
RMIT Foundation |
✓ |
14 Feb 2017 |
RMIT Indonesia Pty Ltd |
✓ |
1 Mar 2017 |
RMIT Online Pty Ltd |
✓ |
1 Mar 2017 |
RMIT Spain SL |
✓ |
1 Mar 2017 |
RMIT Training Pty Ltd |
✓ |
14 Feb 2017 |
RMIT University Vietnam LLC |
✓ |
1 Mar 2017 |
RMIT Vietnam Holdings Pty Ltd |
✓ |
1 Mar 2017 |
Swinburne University of Technology |
✓ |
20 Mar 2017 |
National Institute of Circus Arts Limited |
✓ |
28 Mar 2017 |
Swinburne College Pty Ltd |
n/a |
Not yet signed |
Swinburne Intellectual Property Trust |
✓ |
6 Apr 2017 |
Swinburne Ltd |
n/a |
Not yet signed |
Swinburne Student Amenities Association Ltd |
✓ |
26 May 2017 |
Swinburne Ventures Limited |
✓ |
6 Apr 2017 |
The University of Melbourne |
Modified(a) |
22 Mar 2017 |
Australia Music Examinations Board (Vic) Limited |
✓ |
11 Apr 2017 |
Australian National Academy of Music Ltd |
Modified(a) |
2 May 2017 |
Melbourne University Publishing Ltd |
✓ |
15 May 2107 |
Melbourne Business School Foundation |
✓ |
22 Mar 2017 |
Melbourne Business School Foundation Ltd |
✓ |
22 Mar 2017 |
Melbourne Business School Limited |
✓ |
22 Mar 2017 |
Melbourne Dental Clinic Ltd |
✓ |
13 Apr 2017 |
Mt Eliza Graduate School of Business and Government Limited |
✓ |
22 Mar 2017 |
MU Student Union Ltd |
✓ |
26 Apr 2017 |
Nossal Institute Limited |
✓ |
18 Apr 2017 |
UM Commercialisation Pty Ltd |
✓ |
11 Apr 2017 |
UM Commercialisation Trust |
✓ |
11 Apr 2017 |
UoM Commercial Ltd |
✓ |
11 Apr 2017 |
Victoria University |
✓ |
15 Mar 2017 |
Victoria University Enterprises Pty Ltd |
✓ |
21 Mar 2017 |
Victoria University Foundation |
✓ |
21 Mar 2017 |
Victoria University Foundation Ltd |
✓ |
21 Mar 2017 |
Victoria University International Pty Ltd |
✓ |
21 Mar 2017 |
Victoria University of Technology (Singapore) Pte Ltd |
✓ |
21 Mar 2017 |
(a) See Part 2 of this report for further information on the modified audit opinion issued.
Source: VAGO.
Appendix C. Management letter risk ratings
Figure C1 shows the risk ratings applied to management letter issues raised during a financial audit.
Figure C1
Definitions of risk rating for issues reported in audit management letters
Rating |
Definition |
Management action required |
|---|---|---|
Extreme |
The matter represents:
|
Requires immediate management intervention with a detailed action plan to be implemented within one month. Requires executive management to correct the material misstatement in the financial report as a matter of urgency to avoid a qualified audit opinion. |
High |
The matter represents:
|
Requires prompt intervention by managers with a detailed action plan implemented within two months. Requires executive management to correct the material misstatement in the financial report to avoid a qualified audit opinion. |
Medium |
The matter represents:
|
Requires intervention by managers with a detailed action plan implemented within three to six months. |
Low |
The matter represents:
|
Requires management intervention with a detailed action plan implemented within six to 12 months. |
Source: VAGO.
Appendix D. Financial sustainability risk indicators
Figure D1 shows the indicators used in assessing the financial sustainability risks of universities in Part 4 of this report. These indicators should be considered collectively and are more useful when assessed over time as part of a trend analysis.
Figure D1
Financial sustainability risk indicators
Indicator |
Formula |
Description |
|---|---|---|
Net result margin (%) |
Net result / Total revenue |
A positive result indicates a surplus, and the larger the percentage, the stronger the result. A negative result indicates a deficit. Operating deficits cannot be sustained in the long term. Net result and total revenue is obtained from the comprehensive operating statement. |
Liquidity (ratio) |
Current assets / Current liabilities |
This measures the ability to pay existing liabilities in the next 12 months. A ratio of one or more means there are more cash and liquid assets than short-term liabilities. |
Capital replacement (ratio) |
Cash outflows for property, plant and equipment / Depreciation |
Comparison of the rate of spending on infrastructure with its depreciation. Ratios higher than 1:1 indicate that spending is faster than the rate of depreciation. This is a long-term indicator, as capital expenditure can be deferred in the short term if there are insufficient funds available from operations and borrowing is not an option. Cash outflows for infrastructure are taken from the cash flow statement. Depreciation is taken from the comprehensive operating statement. |
Internal financing (%) |
Net operating cash flow / Net capital expenditure |
This measures the ability of an entity to finance capital works from generated cash flow. The higher the percentage, the greater the ability for the entity to finance capital works from its own funds. Net operating cash flows and net capital expenditure are obtained from the cash flow statement. |
Source: VAGO.
Our analysis of financial sustainability risk in this report reflects on the position of each university.
Financial sustainability risk assessment criteria
We assessed the financial sustainability risk of each university using the criteria outlined in Figure D2.
Figure D2
Financial sustainability risk indicators—risk assessment criteria
Risk |
Net result margin |
Liquidity |
Capital replacement |
Internal financing |
|---|---|---|---|---|
High |
Negative 10% or less |
Less than 0.75 |
Less than 1.0 |
Less than 10% |
Insufficient revenue is being generated to fund operations and asset renewal. |
Immediate sustainability issues with insufficient current assets to cover liabilities. |
Spending on capital works has not kept pace with consumption of assets. |
Limited cash generated from operations to fund new assets and asset renewal. |
|
Medium |
Negative 10%–0% |
0.75–1.0 |
1.0–1.5 |
10–35% |
A risk of long-term run down of cash reserves and inability to fund asset renewals. |
Need for caution with cash flow, as issues could arise with meeting obligations as they fall due. |
May indicate spending on asset renewal is insufficient. |
May not be generating sufficient cash from operations to fund new assets. |
|
Low |
More than 0% |
More than 1.0 |
More than 1.5 |
More than 35% |
Generating surpluses consistently. |
No immediate issues with repaying short‑term liabilities as they fall due. |
Low risk of insufficient spending on asset renewal. |
Generating enough cash from operations to fund new assets. |
Source: VAGO.
Financial sustainability risk analysis results
The financial sustainability risk for each university and its controlled entities (each consolidated university), for each financial year ended 31 December 2012 through to 31 December 2016 are shown in Figures D3 to D10.
The following trend analysis has been applied to the results for each university:
↓ Deteriorating trend ↑ Improving trend ■ No substantial trend identified
Figure D3
Deakin University
Year |
Net result |
Liquidity |
Capital replacement |
Internal financing |
|---|---|---|---|---|
2012 |
13.31% |
1.39 |
3.94 |
99% |
2013 |
8.94% |
1.16 |
2.79 |
101% |
2014 |
7.04% |
1.26 |
1.05 |
215% |
2015 |
7.16% |
1.28 |
1.42 |
165% |
2016 |
5.10% |
0.93 |
2.01 |
110% |
Trend |
↓ |
■ |
↑ |
↓ |
Source: VAGO.
Figure D4
Federation University Australia
Year |
Net result |
Liquidity |
Capital replacement |
Internal financing |
|---|---|---|---|---|
2012 |
22.36% |
5.33 |
3.36 |
223% |
2013 |
1.83% |
5.02 |
2.37 |
58% |
2014 |
1.02% |
2.64 |
0.46 |
369% |
2015 |
2.33% |
3.18 |
0.50 |
206% |
2016 |
0.20% |
2.78 |
0.54 |
12% |
Trend |
↓ |
↓ |
■ |
↓ |
Source: VAGO.
Figure D5
La Trobe University
Year |
Net result |
Liquidity |
Capital replacement |
Internal financing |
|---|---|---|---|---|
2012 |
5.77% |
1.16 |
4.15 |
63% |
2013 |
7.19% |
0.99 |
2.67 |
95% |
2014 |
2.70% |
1.02 |
1.52 |
159% |
2015 |
8.85% |
0.99 |
1.63 |
111% |
2016 |
5.10% |
0.78 |
2.37 |
87% |
Trend |
■ |
↓ |
↑ |
↓ |
Source: VAGO.
Figure D6
Monash University
Year |
Net result |
Liquidity |
Capital replacement |
Internal financing |
|---|---|---|---|---|
2012 |
5.43% |
0.46 |
2.11 |
127% |
2013 |
3.33% |
0.45 |
1.89 |
106% |
2014 |
10.73% |
0.42 |
2.61 |
110% |
2015 |
7.98% |
0.47 |
3.85 |
82% |
2016 |
7.80% |
0.35 |
3.70 |
86% |
Trend |
↓ |
↓ |
■ |
■ |
Source: VAGO.
Figure D7
RMIT University
Year |
Net result |
Liquidity |
Capital replacement |
Internal financing |
|---|---|---|---|---|
2012 |
5.32% |
0.64 |
2.60 |
86% |
2013 |
6.62% |
0.66 |
1.17 |
195% |
2014 |
6.78% |
0.59 |
2.35 |
99% |
2015 |
5.81% |
0.59 |
3.35 |
69% |
2016 |
7.62% |
0.53 |
2.89 |
93% |
Trend |
↑ |
↓ |
■ |
■ |
Source: VAGO.
Figure D8
Swinburne University of Technology
Year |
Net result |
Liquidity |
Capital replacement |
Internal financing |
|---|---|---|---|---|
2012 |
3.80% |
1.40 |
1.15 |
202% |
2013 |
9.52% |
1.35 |
3.30 |
105% |
2014 |
2.38% |
1.27 |
1.25 |
172% |
2015 |
2.71% |
1.28 |
0.48 |
393% |
2016 |
3.25% |
0.90 |
0.44 |
545% |
Trend |
↑ |
↓ |
↓ |
↑ |
Source: VAGO.
Figure D9
The University of Melbourne
Year |
Net result |
Liquidity |
Capital replacement |
Internal financing |
|---|---|---|---|---|
2012 |
6.63% |
0.80 |
2.41 |
98% |
2013 |
4.84% |
0.80 |
1.75 |
119% |
2014 |
7.59% |
0.81 |
1.46 |
95% |
2015 |
6.60% |
1.10 |
1.41 |
170% |
2016 |
7.39% |
1.38 |
1.15 |
256% |
Trend |
■ |
↑ |
↓ |
↑ |
Source: VAGO.
Figure D10
Victoria University
Year |
Net result |
Liquidity |
Capital replacement |
Internal financing |
|---|---|---|---|---|
2012 |
-1.42% |
0.83 |
1.97 |
88% |
2013 |
1.33% |
1.36 |
0.88 |
81% |
2014 |
-3.64% |
1.27 |
1.47 |
279% |
2015 |
-2.81% |
1.26 |
0.74 |
151% |
2016 |
-2.53% |
0.68 |
0.82 |
109% |
Trend |
↑ |
↓ |
■ |
↓ |
Source: VAGO.
Appendix E. Fraud control framework
As discussed in Part 3 of this report, our review of fraud risk assessment and control monitoring at the eight universities has, in part, been based on the Controlling fraud and corruption: a prevention checklist, issued by the Independent Broad-based Anti‑corruption Commission (IBAC) in November 2013.
The key components of a good fraud control framework are detailed in Figure E1, and are from the IBAC document.
Figure E1
Fraud risk and control monitoring checklist
Element of framework |
|---|
Assessing fraud risk |
|
|
Implement and maintain an integrity framework |
|
|
|
|
Fraud control governance arrangements |
|
|
|
Management commitment to controlling risks of fraud |
|
Ethical framework |
|
Line management accountability |
|
|
Internal controls |
|
|
|
Employee awareness |
|
|
|
|
Client and community awareness |
|
Pre-employment screening |
|
Supplier and client vetting |
|
|
Avenues for reporting suspected incidents |
|
|
Protections for disclosers |
|
|
Source: VAGO, based on Controlling fraud and corruption: a prevention checklist, Independent Broad-based Anti-corruption Commission, 2013.
Appendix F. Glossary
Accountability
Responsibility of public entities to achieve their objectives in reliability of financial reporting, effectiveness and efficiency of operations, compliance with applicable laws, and reporting to interested parties.
Asset
An item or resource controlled by an entity from which future economic benefits flow to the entity.
Audit Act 1994
Victorian legislation establishing the Auditor-General's operating powers and responsibilities and detailing the nature and scope of audits that the Auditor-General may carry out.
Audit opinion
A written expression within a specified framework indicating the auditor's overall conclusion about a financial (or performance) report based on audit evidence.
Capital expenditure
Money an entity spends on:
- new physical assets, including buildings, infrastructure, plant and equipment
- renewing existing physical assets to extend the service potential or life of the asset.
Clear audit opinion
A positive written expression provided when the financial report has been prepared and presents fairly the transactions and balances for the reporting period in keeping with the requirements of the relevant legislation and Australian Accounting Standards—also referred to as an unqualified audit opinion.
Depreciation
The systematic allocation of the value of an asset over its expected useful life, recorded as an expense.
Entity
A corporate or unincorporated body that has a public function to exercise on behalf of the state or is wholly owned by the state, including departments, statutory authorities, statutory corporations and government business enterprises.
Equity or net assets
Residual interest in the asset of an entity after deduction of its liabilities.
Expense
The outflow of assets or the depletion of assets an entity controls during the financial year, including expenditure and the depreciation of physical assets. An expense can also be the incurrence of liabilities during the financial year, such as increases to a provision.
Financial Management Act 1994
Victorian legislation governing public sector entities, as determined by the Minister for Finance, including their financial reporting framework.
Financial report
A document reporting the financial outcome and position of an entity for a financial year, which contains an entity's financial statements, including a comprehensive income statement, a balance sheet, a cash flow statement, a comprehensive statement of equity and notes.
Financial reporting direction
Issued by the Minister for Finance for entities reporting under the Financial Management Act 1994, with the aim of:
- achieving consistency and improved disclosure in financial reporting for Victorian public entities by eliminating or reducing divergence in accounting practices
- prescribing the accounting treatment and disclosure of financial transactions in circumstances where there are choices in accounting treatment, or where existing accounting procurements have no guidance or requirements.
Financial sustainability
An entity's ability to manage financial resources so it can meet its current and future spending commitments, while maintaining assets in the condition required to provide services.
Financial year
A period of 12 months for which a financial report is prepared, which may be a different period to a calendar year.
Going concern
An entity that is expected to be able to pay its debts when they fall due, and continue in operation without any intention or necessity to liquidate or otherwise wind up its operations.
Governance
The control arrangements in place that are used to govern and monitor an entity's activities to achieve its strategic and operational goals.
Internal audit
A function of an entity's governance framework that examines and reports to management on the effectiveness of risk management, internal controls and governance processes.
Internal control
A method of directing, monitoring and measuring an entity's resources and processes to prevent and detect error and fraud.
Liability
A present obligation of an entity arising from past events, the settlement of which is expected to result in an outflow of assets from the entity.
Management letter
A letter the auditor writes to the governing body, the audit committee and management of an entity outlining issues identified during the financial audit.
Net result
The value that an entity has earned or lost over the state period (usually a financial year or calendar year), calculated by subtracting an entity's total expenses from the total revenue for that period.
Physical asset
A non-financial asset that is a tangible item an entity controls, and that will be used by the entity for more than 12 months to generate profit or provide services, such as building, equipment or land.
Qualified audit opinion
An opinion issued when the auditor concludes that an unqualified opinion cannot be expressed because of:
- disagreement with those charged with governance or
- conflict between applicable financial reporting frameworks or
- limitation of scope.
A qualified opinion is considered to be unqualified except for the effects of the matter that relates to the qualification.
Revenue
Inflows of funds or other enhancements or savings in outflows of service potential, or future economic benefits in the form of increases in assets or reductions in liabilities of an entity, other than those relating to contributions by owners, that result in an increase in equity during the reporting period.
Risk
The chance of a negative or positive impact on the objectives, outputs or outcomes of the entity.
Risk register
A tool an entity uses to identify, monitor and mitigate risks.