Appendix F Internal audit quality assessment
Figure F1 is a copy of the IIA Internal Audit Quality Analysis to conduct self‑assessment against the IIA standards.
Figure F1
IIA Internal Audit Quality Analysis
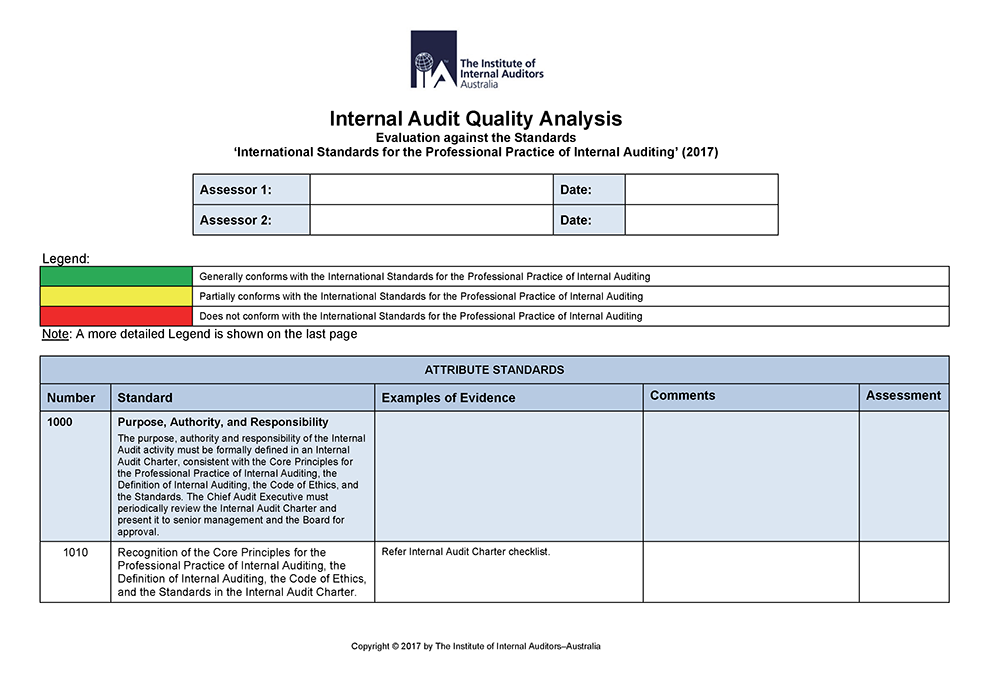

Figure F1 is a copy of the IIA Internal Audit Quality Analysis to conduct self‑assessment against the IIA standards.
Figure F1
IIA Internal Audit Quality Analysis
Figure E1 shows an example of balanced scorecard reporting of better practice performance measures.
Figure E1
Better practice performance measures
|
Key performance indicator |
Type of measure |
Measure |
Target |
Reporting frequency |
|---|---|---|---|---|
|
Internal audit processes | ||||
Figure D1 shows a model assurance map for internal audit.
Figure D1
Model assurance map
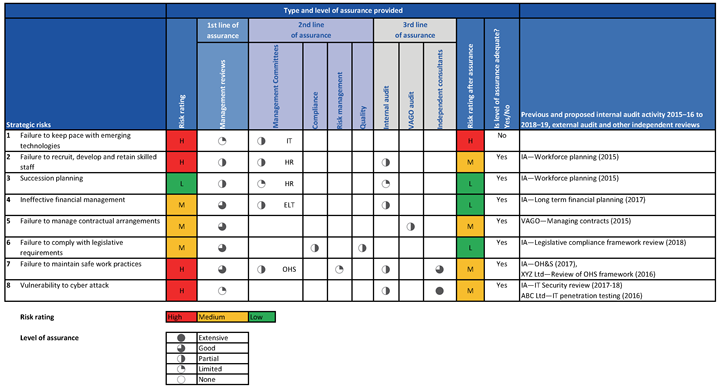
Figure C1 is an assessment of recommended internal audit charter content against actual department charter content.
Figure C1
Recommended internal audit charter content
|
Recommended content |
DHHS |
DET |
DEDJTR |
DJR |
DELWP |
DPC |
DTF |
|---|
The figures in this appendix list the detailed legislation and guidance in the Victorian public sector, and in better practice guides, for managing internal audit, measuring performance and communicating insights. The section numbers in the figures are cross-references to sections of this report.
Figure B1
Figures in this appendix
|
Figure |
Title |
|---|---|
|
Figure B2 |
We have consulted with DEDJTR, DELWP, DET, DHHS, DJR, DPC and DTF, and we considered their views when reaching our audit conclusions. As required by section 16(3) of the Audit Act 1994, we gave a draft copy of this report, or relevant extracts, to those agencies and asked for their submissions and comments.
Responsibility for the accuracy, fairness and balance of those comments rests solely with the agency head.
Responses were received as follows:
Internal audit should demonstrate its performance and value as part of the department's governance framework. It can do this by delivering on its objectives, communicating meaningful insights, reporting on implementation of audit recommendations, and showing commitment to quality and continuous improvement by establishing, measuring and reporting against performance measures. This builds credibility and trust with the audit committee and management.
For the internal audit function to be effective, it must be able to carry out its responsibilities independently and objectively, without interference. Operational independence ensures that internal audit operates free from conflicts of interest, bias and management influence.
Internal audit is a key pillar of good governance. It provides the audit committee, the Secretary of a department, senior executives and stakeholders with an independent view on whether the department has an appropriate risk and control environment. It also helps promote a strong risk management and compliance culture within a department.
According to the IIA, internal audit helps a department accomplish its objectives by bringing a systematic, disciplined approach to evaluating and improving the effectiveness of risk management, internal controls and governance processes.
Internal audit is intended to be an independent, objective assurance and consulting activity designed to add value and improve an agency's operations. It can be an important part of the internal control framework and help an agency accomplish its objectives by bringing a systematic, disciplined approach to evaluating and improving the effectiveness of risk management, internal controls and governance processes.