Auditor-General’s Report on the Annual Financial Report of the State of Victoria: 2017–18
Overview
The 2017–18 Annual Financial Report of the State of Victoria (AFR) informs Parliament and the citizens of Victoria about the financial transactions and position of the state. It was tabled in Parliament by the Treasurer on 20 September 2018.
Each year, we issue an audit opinion on the AFR to provide independent assurance to Parliament on the finances of the state.
This report provides Parliament with information about matters arising from our 2017−18 financial audit of the AFR. It also provides our assessment of the financial sustainability of the three sectors that make up the state’ finances at 30 June 2018—the general government sector, public financial corporations and public non‑financial corporations.
Hospitals data dashboards
We have developed four data dashboards, which are interactive visualisation tools summarising the financial statement data for all Victorian public hospitals. They have been grouped into the following cohorts:
Water entities data dashboard
We have developed an interactive data dashboard summarising the financial statement data for all Victorian water entities.
Transmittal letter
Ordered to be published
VICTORIAN GOVERNMENT PRINTER October 2018
PP No 464, Session 2014–18
President
Legislative Council
Parliament House
Melbourne
Speaker
Legislative Assembly
Parliament House
Melbourne
Dear Presiding Officers
Under the provisions of section 16AB of the Audit Act 1994, I transmit my report Auditor-General's Report on the Annual Financial Report of the State of Victoria: 2017–18.
Yours faithfully

Andrew Greaves
Auditor-General
24 October 2018
Acronyms
| AFR | Annual Financial Report of the State of Victoria |
| DET | Department of Education and Training |
| DJR | Department of Justice and Regulation |
| DTF | Department of Treasury and Finance |
| EBITDA | earnings before interest, tax, depreciation and amortisation |
| ESC | Essential Services Commission |
| FSCP | financial statement close process |
| FTE | full-time equivalent |
| GGS | general government sector |
| GSP | gross state product |
| IT | information technology |
| PFC | public financial corporation |
| PNFC | public non-financial corporation |
| PPE | property, plant and equipment |
| PPP | public private partnership |
| VAGO | Victorian Auditor-General's Office |
| WGT | West Gate Tunnel |
Overview
The Treasurer tabled the 2017–18 Annual Financial Report of the State of Victoria (AFR) in Parliament on 20 September 2018. The AFR includes the financial statements of the State of Victoria (the state) and the general government sector (GGS).
This report provides Parliament with information about matters arising from our financial audit of the 2017–18 AFR. It also provides our assessment of the financial sustainability of the three sectors that make up the state at 30 June 2018—the GGS, public financial corporations (PFC) and public non‑financial corporations (PNFC).
Conclusion
This year, we provided clear audit opinions on the financial statements of the 33 significant state‐controlled entities included in the AFR and, consequently, on the AFR.
The state continues to operate sustainably and is well positioned financially.
Findings
Significant transactions in 2017–18
As part of our financial audit of the 2017–18 AFR, we considered the following significant transactions:
- the West Gate Tunnel (WGT) project
- the Metro Tunnel project
- the sale of the state's investment in Snowy Hydro Limited.
West Gate Tunnel project
On 11 December 2017, the state entered a public private partnership (PPP) contract with Transurban for the construction of a road tunnel, widening of the West Gate Freeway and an elevated motorway that will link the West Gate Freeway to the CityLink tollway and the Port of Melbourne. The project is expected to be completed by 2022.
Construction will cost an estimated $6.7 billion. The estimated state contribution to the project is $2.7 billion, with the remaining construction costs and operating and maintenance costs over the term of the contract to be funded by Transurban through tolling revenue collected from users of the WGT and CityLink. The tolling arrangements require legislation to be passed.
At 30 June 2018, this legislation had not been passed. Therefore, against the requirements of current Australian accounting standards, the WGT transaction is a finance lease. This is reflected in the AFR, where actual and contingent commitments are disclosed.
Metro Tunnel project
The Metro Tunnel project will deliver a new underground rail network that will cross Melbourne and join two existing rail lines. Construction will cost an estimated $11.1 billion and is expected to be completed by 2025.
Contracts for key components of the project have been finalised, and construction has commenced. At 30 June 2018, the state had spent $1.6 billion on the project. These costs are disclosed in the AFR.
Sale of the state's investment in Snowy Hydro Limited
In March 2018, the state entered into an agreement to sell its 29 per cent equity investment in Snowy Hydro Limited to the Commonwealth Government for $2.03 billion. On 29 June 2018, the state received the entire proceeds from the transaction and derecognised its investment—it made a profit of $24.8 million on this sale.
Internal controls
We assessed the internal controls implemented by the Department of Treasury and Finance (DTF) as effective to support the preparation of a complete and accurate AFR. We also judged that the overall internal control frameworks at the 33 significant state‐controlled entities were adequate to support their preparation of complete and accurate financial reports.
State-controlled entities can improve the way they address common control weaknesses.
Financial sustainability of the general government sector
We assessed the GGS's financial sustainability in the following key areas:
- operating results
- debt
- its target of fully funding its superannuation liability by 2035.
Operating results
The 2017–18 financial year marks the fifth consecutive year in which the GGS generated a positive net result from transactions. Coupled with low debt, this demonstrates the state's strong financial position and the government's sound financial management. This should provide the state with an adequate buffer against unanticipated shocks to revenue or increases in expenditure.
To maintain its financial sustainability, the state will need to continue to closely monitor growth in its employee costs, which account for one third of its total expenditure. Unlike discretionary grants and much expenditure on supplies and services, staff costs tend to be fixed over the short to medium term.
Debt
Government's use of debt for major projects is an important source of finance, particularly in a low‐interest‐rate environment.
At 30 June 2018, the GGS had borrowings of $33.5 billion, an increase of $4.7 billion from the prior year. This increase reflects additional borrowings required to finance the Level Crossing Removal Program and other infrastructure projects.
Over the next four financial years, GGS debt is estimated to increase by $11.4 billion to fund capital projects and public services. Over this period, the GGS's debt burden is expected to remain manageable.
Superannuation liability
At 30 June 2018, the state owed $25.2 billion to four superannuation funds. This represents the gap between the estimated future amounts the funds will be required to pay to their members, and the value of the assets held by the funds to meet these payments.
The state government has a target to reduce its obligation to zero by 2035. Each year, actuaries provide the state government with a plan detailing the payments that need to be made each financial year to achieve the state's target. Over the past five financial years, the state has met these payments.
Financial sustainability of public financial corporations
PFCs manage most of the state's financial assets and liabilities. Over the last five financial years the sector has delivered strong financial outcomes.
These entities need to be managed prudently, to ensure their own long-term solvency and viability, and to reduce the risk of adverse impacts on the state's finances. There are no immediate short-term risks likely to significantly impact the financial sustainability of the sector.
Financial sustainability of public non-financial corporations
The PNFC sector consists of 72 entities. The 19 water entities generate 55 per cent of the revenue of the PNFC sector and hold 34 per cent of its assets.
There are no immediate short-term financial sustainability risks to the water sector although, in the longer term, some water entities will need to consider the risks associated with their ability to replace or renew assets and repay debt. In particular, the two rural water entities continue to make significant losses, as their customer service and usages charges, which are regulated, do not adequately fund their depreciation costs.
Submissions and comments received
As required by section 16A of the Audit Act 1994, we gave a draft copy of this report to the Treasurer of Victoria and asked for his submissions or comments.
As required by section 16(3) of the Audit Act 1994, we gave relevant extracts of this report to named agencies and asked for their submissions or comments.
We also provided a copy of the report to the Department of Premier and Cabinet.
We have considered their views when reaching our audit conclusions.
The following is a summary of those responses. The full responses are included in Appendix A.
The Treasurer of Victoria highlighted the clear audit opinion issued on the 2017–18 AFR, and was pleased that the report presents a positive assessment of the state's finances and operating sustainability.
The Secretary of the Department of Justice and Regulation has confirmed the accuracy of the information reported in Figure 4D, and has indicated that the issues raised have either been resolved by the external service provider deploying further functionality, or will be resolved as the deployment of the VIEW system continues to progress throughout this year and into early 2019.
1 Audit context
Each year we audit the AFR, which measures the financial position of the state at the end of the financial year, and how it performed during the year.
Section 16A of the Audit Act 1994 requires that we report to Parliament on our audit. This report satisfies our obligation.
1.1 Entities included in the AFR
The AFR combines the financial results of 265 state-controlled entities. These are classified into three sectors:
- general government sector (GGS)
- public financial corporations (PFC)
- public non-financial corporations (PNFC).
Figure 1A
Categories of state-controlled entities
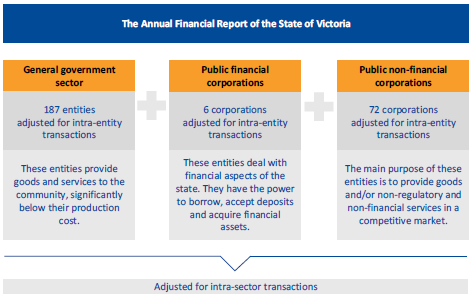
Source: VAGO.
We audit and provide an opinion on the financial statements of the 265 state‑controlled entities each year. Appendix C details the date and type of financial audit opinion we issued in 2017–18.
Significant state-controlled entities
The financial results of 33 state-controlled entities, listed in Appendix C, were significant to the financial performance and position of the state in 2017–18. Collectively, these entities accounted for most of the state's assets, liabilities, revenue and expenditure.
We focused our audit attention on the financial transactions and balances of these 33 entities when forming our opinion on the AFR.
1.2 Entities not in the AFR
The AFR reports only on state-controlled entities. Other entities that provide public services are excluded because the state does not control them for financial reporting purposes.
Figure 1B
Sectors not included in the AFR
|
Sector |
Reason sector is not included in the AFR |
|---|---|
|
Local government |
Local government is a separate tier of government, with councils elected by, and accountable to, their ratepayers. |
|
Universities |
The Commonwealth is the main funder of universities, and the state directly appoints only a minority of university council members. |
|
Denominational hospitals |
Denominational hospitals are private providers of public health services and have their own governance arrangements. |
|
State superannuation funds |
The net assets of state superannuation funds are the property of the members. However, any shortfall in the net assets related to certain defined benefit scheme entitlements is an obligation of the state and is reported as a liability in the AFR. |
Source: VAGO.
1.3 Results of the State of Victoria
In 2017–18, the state generated $72.9 billion of revenue and outlaid $72.9 billion in costs. In the same period, other economic flows—such as revaluations of financial assets and liabilities—totalled $2.1 billion.
At 30 June 2018, the state controlled assets worth $323.1 billion and owed suppliers and employees $135.2 billion. Figure 1C shows the type and value of state revenue, expenses, assets and liabilities in 2017–18.
Figure 1C
Revenue, expenses, assets and liabilities of the state, 2017–18
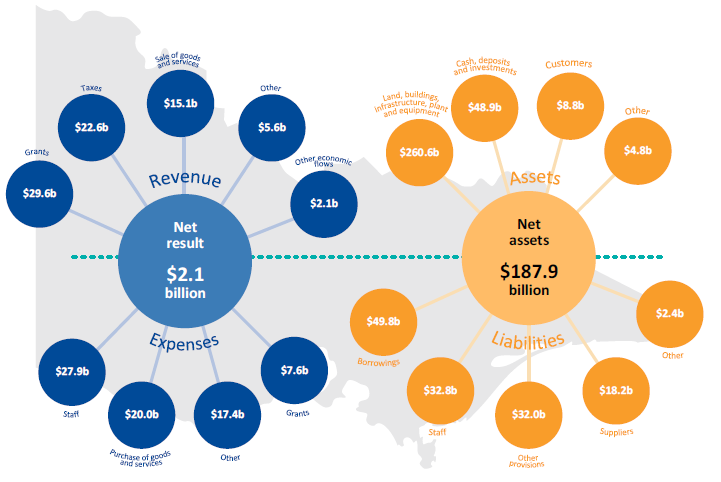
Source: VAGO.
1.4 Our audit
We apply Australian auditing standards to our audit of the AFR and provide an audit opinion on it in accordance with Section 9A of the Audit Act 1994. DTF pays for the audit.
The cost of preparing this report was $500 000, which is funded by Parliament.
1.5 Report structure
Figure 1D outlines the structure and contents of this report.
Figure 1D
Report structure
|
Part |
Description |
|
|---|---|---|
|
2 |
Results of audits |
Discusses the financial audit opinion issued on the 2017−18 AFR, the timeliness and quality of the AFR, and key transactions that occurred during the year. |
|
3 |
Better practice financial reporting |
Discusses the maturity of the financial reporting processes at state-controlled entities. |
|
4 |
Internal controls |
Summarises the internal control issues observed during our audits of state-controlled entities. |
|
5 |
Financial sustainability of the general government sector |
Provides an analysis of the GGS's financial outcomes. Assesses the 2017–18 financial outcomes of the GGS against targets included in the 2017–18 State Budget. Discusses key risks to the financial sustainability of the sector. |
|
6 |
Financial sustainability of public financial corporations |
Assesses the 2017–18 financial outcomes of PFCs against key financial measures, and discusses key risks to the financial sustainability of these entities. |
|
7 |
Financial sustainability of public non-financial corporations |
Assesses the 2017–18 financial outcomes of the 19 water entities against key financial measures, and discusses key risks to the financial sustainability of these entities. |
Note: We published our commentary on the 11 technical and further education institutes that have a 31 December year-end reporting date in our report Results of Audits 2017: Technical and Further Education Institutes (May 2018).
Source: VAGO.
2 Results of audits
2.1 Audit opinion for the year ended 30 June 2018
This year, we provided a clear audit opinion on the AFR. A clear audit opinion adds credibility to the financial statements by providing reasonable assurance that reported information is reliable and accurate, in keeping with the requirements of relevant accounting standards and applicable legislation. A copy is shown in Appendix B.
2.2 Reliability of financial statements
The frequency and number of material adjustments arising from an audit is a measure of the accuracy of draft financial statements. Ideally, the entity should not need to make any material adjustments once it has submitted its draft financial statements for audit.
Figure 2A details the material adjustments we identified through our audits of the 33 significant state-controlled entities.
Figure 2A
Material adjustments to the draft financial statements of significant state‑controlled entities
|
Entity |
Reason for material adjustment to draft financial statements |
|---|---|
|
Department of Economic Development, Jobs, Transport and Resources |
To disclose future contingent commitments of $4 billion relating to the West Gate Tunnel project. |
|
Department of Environment, Land, Water and Planning |
To correct the managerial valuation of property, plant and equipment (PPE) by $1.2 billion as the department's initial calculation had incorrectly applied the Valuer-General indices. |
Source: VAGO.
Figure 2B details the material adjustments that were identified during our audit of the AFR.
Figure 2B
Material adjustments to the draft AFR
|
Issue |
Reason for material adjustment to draft financial statements |
|---|---|
|
Omission of a material subsequent event |
The financial statements of the Public Transport Development Authority included a $1.7 billion subsequent event relating to the signing of metropolitan bus services contracts. The processes implemented by DTF to collect subsequent event information for inclusion in the AFR did not capture this transaction. |
|
Prior-period error relating to misclassification of reserves |
The draft AFR Consolidated Statement of Changes in Equity included a misclassification of $425 million between types of reserves. The issue was corrected by amending the opening balance for these reserves from 1 July 2016. This was identified as part of DTF's quality-assurance processes. |
Source: VAGO.
2.3 Timeliness of financial statements
Timely financial statements provide relevant and useful information to the public and to the entity's other stakeholders. The timeliness of the AFR is measured against the statutory reporting deadline established in the Financial Management Act 1994, and against the annual production timetable set by DTF.
In 2017–18, DTF was able to produce a timely AFR.
Timeliness of significant state-controlled entities
The timely preparation and audit of the AFR largely depends on the 33 significant state-controlled entities meeting their key milestones in the AFR preparation timetable, and on the early identification and resolution of significant accounting issues.
DTF set a milestone date of 17 August 2018 for all significant state-controlled entities to finalise their financial statements, including an audit opinion. This date was set to allow adequate time to prepare and audit the AFR. Figure 2C shows the performance of significant state-controlled entities in finalising their financial statements against the DTF-imposed milestone over the past five financial years.
Figure 2C
Timeliness of significant state-controlled entities against the DTF-imposed milestone
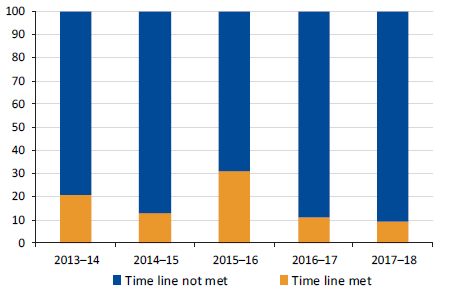
Source: VAGO.
Only three of the 33 significant state-controlled entities met the milestone date in 2017–18. Despite this, the AFR was tabled in Parliament within the statutory deadline.
2.4 Significant transactions in 2017–18
As part of our audit, we focus our attention on significant financial reporting risks. These are usually material and complex transactions that are significant to the state—either in nature or value. For 2017–18, we needed to review and assess three unique transactions:
- the West Gate Tunnel (WGT) project
- the Metro Tunnel project
- the sale of the state's investment in Snowy Hydro Limited.
|
A public private partnership (PPP) is an arrangement where the private sector will design, build, finance, maintain and operate the public infrastructure for a period before transferring ownership of the asset to the state. |
West Gate Tunnel project
Background
On 11 December 2017, the state entered a PPP contract with Transurban for the construction of a road tunnel, widening of the West Gate Freeway and an elevated motorway that will link the West Gate Freeway to the CityLink tollway and the Port of Melbourne. The WGT will give road users an alternative to the West Gate Bridge.
Under the contract, Transurban is required to design, partially finance and construct the WGT, then operate and maintain it for a period of approximately 23 years before transferring it back to the state. Construction is expected to be completed by late 2022.
The contract also required Transurban to manage Stage 1 of the Monash Freeway upgrade and deliver Webb Dock improvement works.
Figure 2D
Map of the proposed WGT project
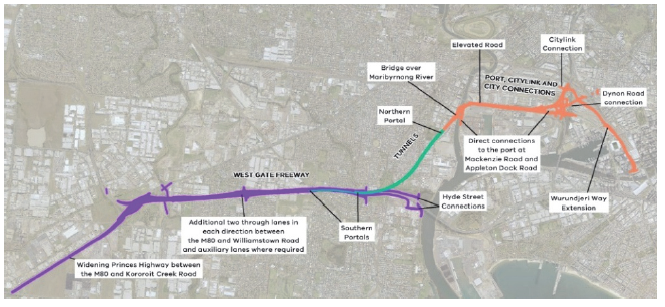
Source: Western Distributor Authority, West Gate Tunnel Project Environmental Effects Statement—Development and Urban Design Plans, December 2017.
Status of the project
At 30 June 2018, the project was underway:
- The Monash Freeway upgrade and Webb Dock improvement works were complete—these are reported as assets in the AFR.
- The state had paid $75.5 million of project costs—these are reported as prepayments in the AFR.
- Project costs of $245.6 million to be paid by the state had been incurred and financed by Transurban. This amount forms part of the state capital contribution to the project and is payable by the state to Transurban. It is reported as an interest-free loan in the AFR, consistent with the terms of the contract.
Project costs
The total cost of the WGT project is estimated at $6.7 billion in nominal terms. The estimated state contribution is $2.7 billion in nominal terms, consisting mainly of cash, capital works and land.
Figure 2E
The state's contribution to the WGT project
|
Element |
Nominal amount (excluding GST) $ million |
|---|---|
|
Cash |
1 389 |
|
Monash Freeway upgrade |
283 |
|
Webb Dock improvement works |
61 |
|
Other state costs(a) |
927 |
|
Total state contribution |
2 660 |
(a) Includes land acquisition, project management and other direct costs.
Source: VAGO.
Transurban will fund the balance of the project of $4.0 billion.
How the project is funded
The $2.7 billion state contributions will primarily be funded through a combination of operating surpluses and debt.
The government has granted Transurban the right to collect tolls from users of the WGT, and intends to amend and extend current Transurban tolling arrangements on CityLink to fund the remaining construction costs and operating and maintenance costs over the term of the contract. The extension will be for a further 10 years. The contract requires the state to seek the passage of legislation in Parliament in relation to tolling users of the WGT, and Parliamentary support to amend and extend the current CityLink arrangements.
If legislation is not passed or Parliamentary support is not obtained in the agreed form and time frame, the contract requires the state to make additional contributions of up to $4.0 billion to replace funding from the relevant toll revenue streams. Additionally, the state will need to pay a rate of return on finances raised by Transurban. Several variables, disclosed in note 7.2 of the 2017–18 AFR, may reduce this amount.
The State Budget does not allow for the additional state contributions that will be required if legislation is not passed by Parliament. The state will need to determine how these contributions will be funded if they become payable. Without adjusting the phasing of, or reprioritising, other government initiatives, any additional state contributions made to Transurban under the contract will be funded through a combination of operating surpluses and debt. This will increase the GGS's net debt and will impact one of government's key financial measures—net debt to gross state product, discussed in Part 5 of this report.
Accounting for the project
PPPs are long-term, complex contracts where both the public and private sectors have an interest in the underlying infrastructure. Accounting for them is challenging. There is currently no Australian accounting standard or other whole-of-Victorian Government guidance that prescribes the accounting treatment for PPP transactions.
The conditional nature of the Transurban contract adds additional complexity. The financing aspect of the contract requires legislation to be passed in the agreed form and within a specific time frame, and outlines the financial implications for the state if this does not occur. There are fundamental differences in the accounting treatment depending on the timing and nature of Parliament's decisions, which are out of the government's control.
Even though the government expects the legislation to pass and that it will obtain Parliamentary support, Australian accounting standards require that the transaction be accounted for based on the facts and circumstances current at 30 June 2018. At that date, and up to the date the Treasurer and Secretary of DTF certified the financial statements, legislation had not been passed by Parliament and support had not been obtained.
Since the legislation had not been introduced before Parliament at the reporting date, government needed to account for and disclose its contributions on the basis that there is no legislation or Parliamentary support. In the absence of an accounting standard or guidance for PPPs, government needed to exercise significant judgement to make sure the treatment reflected the substance and economic reality of the transaction, with reference to other Australian accounting standards dealing with similar transactions. Australian accounting standard AASB 117 Leases is the most relevant standard in this context.
When we assessed the attributes of the WGT contract against the current AASB 117 standard, without Parliamentary support in place, the transaction is a finance lease in nature. This has resulted in the full amount of actual and contingent commitments being disclosed in the 2017–18 AFR.
This accounting treatment will need to be reassessed:
- if legislation is passed and/or Parliamentary support is obtained
- when Australian accounting standard AASB 1059 Service Concession Arrangements: Grantors comes into effect.
Metro Tunnel project
Background
The Metro Tunnel project will deliver a new underground rail line that will cross Melbourne and join two existing rail lines. This involves building two tunnels, approximately nine kilometres long, and five new train stations, which will be integrated with the existing metropolitan train network. The project is expected to be completed by 2025.
Figure 2F
Map of the proposed Metro Tunnel project
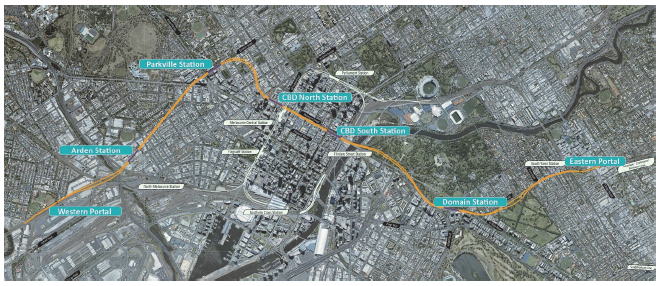
Note: Indicative route only.
Source: VAGO based on Metro Tunnel Project, metrotunnel.vic.gov.au.
The project includes three key components, shown in Figure 2G.
Figure 2G
Key components of the Metro Tunnel project
|
Component |
Description |
|---|---|
|
Tunnels and stations |
Design, construction, fit-out and maintenance of tunnels and stations. Being delivered under a public private partnership arrangement. |
|
Rail systems |
Delivery of significant components for signals, power and operational control systems. Being delivered under an alliance arrangement. |
|
Rail infrastructure |
Design and construction of the tunnel entrance and exit portals. Being delivered under a separate alliance arrangement. |
Source: VAGO.
|
An alliance arrangement is an arrangement between two or more entities that have agreed to share resources on a specific project. |
The tunnels and stations component is being delivered under a PPP arrangement. The private sector consortium responsible for the design, construction and fit-out of the tunnels and stations is required to maintain the majority of the assets for a period of 25 years. Once built, the state will recognise in the AFR the assets and a finance lease liability for amounts payable to the consortium. The lease liability will be paid over 25 years. Maintenance costs, which are in addition to the lease liability, will be paid and expensed as incurred.
The rail systems and rail infrastructure components are being delivered under other procurement approaches. Construction costs will be paid progressively during construction and reported in the AFR as work-in-progress assets until complete.
Status of the project
At 30 June 2018, the state had:
- executed contracts for the tunnels and stations, and the rail systems components—the contract for the rail infrastructure component was executed on 28 September 2018
- paid $411.5 million to the early works managing contractor
- paid $68.3 million to the tunnels and stations PPP
- paid $29.0 million to the rail systems alliance
- paid $1102.0 million for land acquisition, design development, business case and procurement activities, geotechnical investigations, high-capacity signalling, project management and other direct costs.
Project costs
Construction of this project will cost an estimated $11.1 billion in nominal terms. The state will fund the project through a combination of operating surpluses and debt.
Figure 2H
Estimated cost of the Metro Tunnel project
|
Element |
Nominal value (excluding GST) $ million |
|---|---|
|
Early works and wider network enhancements(a) |
915.7 |
|
Tunnels and stations(b) |
4 935.9 |
|
Rail systems |
1 123.4 |
|
Rail infrastructure |
1 001.5 |
|
Other state costs(c) |
3 083.6 |
|
Total cost |
11 060.1 |
(a) Includes early works managing contractor, tram works and road and wider network enhancements.
(b) Capital cost excluding financing and maintenance costs. The state will pay $4 068.3 million during construction and the remainder over a 25-year lease period.
(c) Includes land acquisition, design development, business case and procurement activities, geotechnical investigations, high-capacity signalling, project management and other direct costs.
Source: VAGO.
Sale of investment in Snowy Hydro Limited
Snowy Hydro Limited is a company that owns and operates the Snowy Mountain Hydro-electric Scheme as an independent electricity generator in the National Electricity Market.
In March 2018, the state entered into an agreement to sell its 29 per cent equity holding in Snowy Hydro Limited to the Commonwealth Government for $2.03 billion. On 29 June 2018, the state received the entire proceeds from the transaction and derecognised its investment. It made a profit of $24.8 million on this sale.
3 Better practice financial reporting
3.1 Financial reporting processes
Good financial reporting preparation processes reduce the risk of untimely, inefficient, inaccurate or unreliable reporting.
Financial reporting processes relate to more than just the work required to create the financial statements. They cover the people, processes, policies, data and systems involved in every financial aspect of the entity. The better an entity understands and manages these elements, the easier its financial reporting process at year end becomes. This, in turn, improves the quality and timeliness of financial reports.
Framework for financial reporting process
Figure 3A shows the four key components of the financial reporting process.
Figure 3A
Key components of the financial reporting process
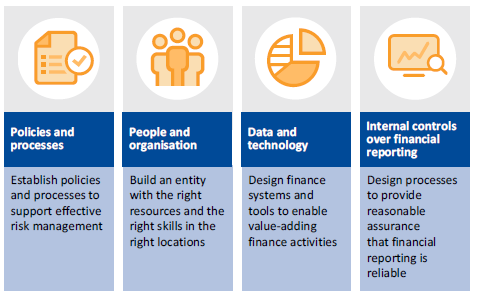
Source: VAGO.
Financial reporting processes across state-controlled entities
We asked a selection of the 265 state-controlled entities to complete a comprehensive self-assessment questionnaire on their current processes and systems. The entities were the:
- 33 significant state-controlled entities
- 19 water sector entities
- 86 public hospitals.
We also created a maturity framework for the four key components in Figure 3A. This framework, shown in Appendix D, summarises the characteristics of each component across different levels of maturity.
We encourage all entities to undertake a similar self-assessment against the criteria in Appendix D to identify areas for improvement.
What is the current situation?
We collated the results of the questionnaires to provide a high-level overview of each sector. The average result of each component for each sector is shown in Figure 3B.
We provided a chart conveying the results of the questionnaire to each entity's management team and audit committee. Entities should compare their individual results with the average for their sector.
Figure 3B
Results of the financial reporting maturity survey
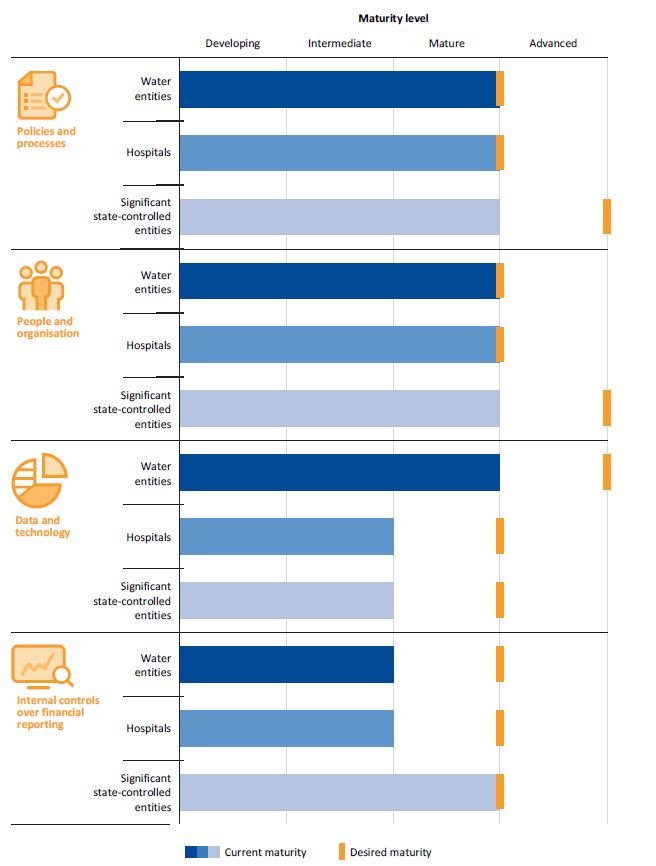
Source: VAGO.
|
Financial statements close process is the process of finalising the financial balances for the month, and generating the internal reports for use by management. |
A key finding from our survey is that many entities are spending a high proportion of their time each month completing their financial statements close process (FSCP). Entities reported that they take an average of 12 business days to complete the monthly FSCP. This means that for over half of each month, the finance team is occupied by close processes. The size and complexity of an entity did not impact this outcome.
For the annual financial statements, over half the entities surveyed take more than four weeks to prepare their draft statements for audit. We found that this measure was impacted by the type of systems used by the entity, with those that prepared their financial statements almost entirely via spreadsheet taking an average of 26 days to complete their reporting, while those using an automated system taking 16 days.
Entities could improve their controls for assembling data into a set of financial statements. While having controls for the data entry process is important, lack of controls for the preparation of financial statements causes entities to lose time amending multiple drafts.
If finance staff were able to reduce the time they spend undertaking these close processes and preparing their statements, they would have opportunities to undertake other important activities. This includes tasks that proactively address data quality, which presently is only undertaken on a reactive basis by most entities, as well as analysis and commentary that is also crucial to monthly and annual financial reporting.
We identified some common weaknesses within the surveyed entities' responses—these are detailed in Figure 3C, along with some potential initiatives that entities could implement to improve their processes and reduce the time spent on the FSCP and annual financial statements.
Figure 3C
Common themes in the results of our survey of entities' financial reporting processes
|
Key observation |
Why it matters |
Potential ways to improve |
|---|---|---|
|
Policies and processes |
||
|
Entities are putting significant effort into their policies and procedures, ensuring they have mature processes in place for capturing data. However, the amount of time spent on the monthly close process is significant, with entities spending on average over half a month (12 business days) to complete their month-end close process and prepare monthly management reports. |
Despite entities spending significant effort on ensuring appropriate policies and procedures are in place for capturing data, this is not translating into an efficient monthly reporting process. Reducing the time spent on the monthly close process will allow entities to focus on other preventive measures, such as proactively managing data quality. |
Undertake a review of the financial statement close processes to identify opportunities to reduce the preparation time—for example, reviewing what activities are done at what point, by whom, how and for what purpose. Entities should consider this after undertaking a risk assessment of the financial statements, to ensure the effort is focused on the right areas. |
|
People and organisation |
||
|
Entities are not implementing ongoing training for their finance staff to ensure they maintain their skills—only 16 per cent of entities reported providing ongoing training for their finance employees. |
A skilled team should lead to an efficient and more accurate financial reporting process. With the ever-changing landscape of accounting standards and financial reporting requirements, ongoing training is crucial. |
Assess how the strategic objectives for the upcoming year align with the current capabilities of finance staff and consider what the required training needs are to align with these objectives. Entities should consider both technical accounting knowledge (for example, accounting standards) and other fundamental and emerging focus areas (for example, use of data analytics). |
|
Data and technology |
||
|
At present, just over half of the entities we surveyed (54 per cent) reported that they prepare financial statements almost entirely by spreadsheet. Entities reported that they are hoping to improve this situation by investing in new information technology (IT) projects. |
Using a manual spreadsheet may increase the risk of error in the financial statements through transposition or related faults. It also impacts the timeliness of financial statement preparation. Entities are already spending considerable funds on IT projects, including general ledger and financial statements programs. However, these are yet to translate into the efficient preparation of financial statements. |
Seek to automate processes where possible and to integrate the generation of financial statements with general ledger software and other key data sources (for example, contract data for financial commitments disclosures). Additionally, review whether the IT projects currently underway are sufficient to improve the maturity level for this component. |
|
Internal controls over financial reporting |
||
|
Almost two-thirds of the entities we surveyed have either not assessed the risk of material misstatement within their annual financial statements, or have only done so informally. |
Undertaking a financial statement risk assessment is an important tool to help entities identify the areas where they face the greatest risk of error, in turn enabling the most effective allocation of resources. This is also a useful step in the preparation of streamlined financial statements, assisting finance teams to tailor their financial statements. |
Perform a financial statement risk assessment to identify the major financial statement accounts and disclosures, and then align resources and effort to mitigate key risks while reducing work on lower-risk areas. This should also be aligned with the monthly close process—reducing time spent on low-risk areas in exchange for additional and more frequent review of the higher-risk areas. |
Source: VAGO.
4 Internal controls
Effective internal controls help entities reliably and cost-effectively meet their objectives. Good financial reporting controls are also a prerequisite for delivering sound, accurate and timely external financial reports.
In our annual financial audits, we consider the internal controls relevant to financial reporting and assess whether entities have managed the risk that their financial reports will not be complete and accurate. Poor internal controls make it more difficult for management to comply with relevant legislation, and increase the risk of fraud and errors.
As part of our audit of the AFR, we assess the impact that internal control deficiencies identified at state-controlled entities may have on DTF's ability to prepare a complete and accurate AFR.
Where we identify issues, we report them to management and audit committees as required by auditing standards. Our risk ratings for control weaknesses are defined in Appendix E, along with recommended time lines for resolving the issues.
4.1 Overall findings
Overall, the internal controls implemented by DTF to support the preparation of a complete and accurate AFR are effective, although there are areas for improvement—summarised in Figure 2B.
The internal control frameworks at the 265 state-controlled entities adequately support the preparation of complete and accurate financial reports. However, some agencies need to strengthen some important internal controls.
4.2 Internal control deficiencies
The Standing Directions of the Minister for Finance 2016 require the accountable officer of each entity to establish an effective internal control system for the entity's financial management, performance and sustainability. The internal control system must include the elements shown in Figure 4A.
Figure 4A
Elements of an internal control system
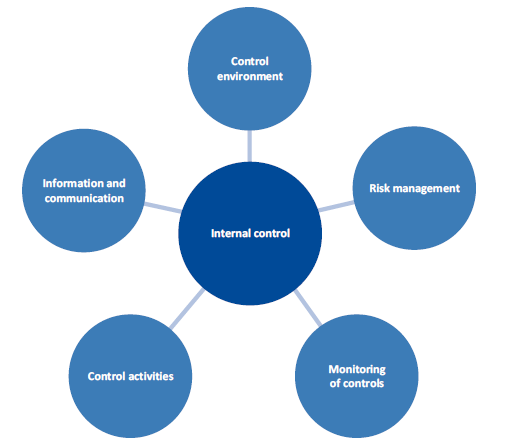
Source: VAGO.
|
The control environment includes:
|
Entities establish audit committees to help them with governance and assurance over internal controls. Under Standing Direction 3.2.1 Oversight and assurance: Audit Committee, one of the audit committee's responsibilities is to regularly review the implementation of management actions in response to internal or external audits, including remedial actions to mitigate future instances of noncompliance.
Control environment
The control environment is the attitudes, awareness and actions of management. It is the 'tone at the top'.
As part of a financial audit, we evaluate whether:
- management has created and maintained a culture of honesty and ethical behaviour
- the control environment provides an appropriate foundation for the other components of internal control.
We found the larger the government entity, the greater the strength of the control environment, as controls were layered across every facet of the business. However, the smaller government entities, with fewer staff, relied heavily on boards and audit committees for effective monitoring and oversight. This is evident in entities with smaller finance teams.
The case study in Figure 4B describes the impact of a weak control environment.
Figure 4B
Case study: Control environment at the Royal Children's Hospital
|
The Royal Children's Hospital implemented a new payroll system in May 2017. The hospital has a workforce of approximately 3 300 full-time equivalent (FTE) employees. Employee benefits make up about 70 per cent of the hospital's total expenditure relating to operating activities. Our previous audits have identified poor controls within the hospital's payroll system and processes. These became weaker with the implementation of the new system, as past control issues we had identified were not fully addressed. As a result, in 2017–18 some employees received incorrect salary and superannuation payments, with errors totalling about $600 000. Key weaknesses identified in our previous audit work included:
We communicated these weaknesses to the hospital's board and audit committee as part of our previous audits, however, they were not all addressed promptly by management. In 2017−18, we continued to report that these weaknesses had not been resolved, and we have identified further weaknesses over the payroll system and controls. In its 2017–18 financial report, the Royal Children's Hospital stated that it has identified all payment errors and has committed to resolving them by 30 June 2019. |
Source: VAGO.
Risk assessment
|
Risk assessment includes:
|
Risk assessment relates to management's processes for identifying, analysing, mitigating and controlling risks that may prevent an entity from achieving its objectives.
As part of a financial audit, we seek to understand whether management has a process for:
- identifying business risks relevant to financial reporting objectives
- estimating the significance of risks
- assessing the likelihood of risks occurring
- deciding on actions to address those risks.
Only one small entity in the GGS did not have a risk register in place.
Entities' IT systems are at different stages of their life cycle. As entities develop business cases to support investment in new systems, management should ensure they have assessed risks to properly identify, analyse, mitigate and control risks associated with the implementation of a new system and its impact on the business. This is particularly relevant as entities move towards cloud‑based IT environments.
Control activities
|
Control activities include:
|
Control activities are the policies, procedures and practices that management implements to help meet the entity's objectives. These activities operate at all levels and in all functions, can be manual or automated and, if operating effectively, can prevent or detect errors in financial information.
As part of a financial audit we seek to understand the control activities that support the preparation of accurate financial statements and those that do not.
We separate control activities into manual and IT control activities.
Manual control activities
Employees manually perform these control activities to assess the reasonableness and appropriateness of transactions—for example, by manually validating, calculating or reviewing something. These controls may be less reliable than IT controls because they are susceptible to human error and can be more easily bypassed or overridden.
Forty state-controlled entities had medium-rated control deficiencies in this area, which primarily related to:
- payroll—duties not being segregated, employee master files not being kept up to date, and staff not using system-generated exception reports
- expenses—purchase orders not being used, delegations being breached, and changes to vendor master files not being approved.
These themes are consistent with our findings in previous years.
Information technology control activities
|
A cyber-attack is a deliberate act by a third party to gain unauthorised access to an entity's data with the objective of damaging, denying, manipulating or stealing information. |
IT control activities support the operating capability of an IT system. Strong IT controls are a prerequisite for the smooth day-to-day operations of entities and the reliability of financial information. They reduce the risk that employees or third parties can circumvent processes and that unauthorised users can access systems, which may result in the destruction of data or recording of non‑existent transactions.
IT controls can also reduce the risk of a successful cyber-attack. To achieve this, it is imperative that IT control deficiencies are addressed in a timely manner.
Twelve state-controlled entities had medium-rated IT control deficiencies, which primarily related to:
- user access management—users being assigned inappropriate privileged access, and users and their system access requirements not being reviewed periodically
- system software—software being configured inappropriately, system updates and patches not being applied in a timely manner, software still being used even though it is no longer supported by the vendor
- disaster recovery plans—plans not being updated or tested in a timely manner.
These themes are consistent with our findings in previous years.
The case study in Figure 4C describes the impact of an IT control deficiency.
Figure 4C
Case study: IT deficiency at the Department of Education and Training
|
The Department of Education and Training (DET) outsources the hosting and maintenance of its purchasing system to a service provider. The system manages all aspects of the purchasing process, including contract management, vendor setup and purchasing. The service provider delivers several IT services to DET including:
As part of DET's annual disaster recovery test, the service provider attempted to simulate recovery of the system by restoring the live environment using data from the backup site. The database was successfully restored, however, 39 608 documents supporting financial delegation approvals for various procurement and payment‑related transactions were lost. No other data was impacted. This loss was caused by a storage replication software bug. Recovery of lost data was further complicated as:
The service provider has since remediated these IT control deficiencies. DET has recovered approximately 50 per cent of the documents and is working towards recovering the remainder. The impact of the loss could have been worse if other data was also affected, or if management had difficulties in its recovery activity. This serves as a reminder of the importance of effective IT internal controls. |
Source: VAGO.
Monitoring of controls
|
Monitoring of controls includes:
|
Monitoring activities are the methods management uses to observe internal controls in practice and assess their effectiveness. This may be through ongoing supervision, periodic self-assessments or separate evaluations.
As part of a financial audit, we seek to gain an understanding of the major activities management uses to monitor the internal controls that are relevant to financial reporting, and how management initiates remedial actions to address deficiencies.
Six state-controlled entities had medium-rated control deficiencies in this area. These were related to how management oversees excessive leave balances and monitors other internal controls.
Outsourced service providers
Some state-controlled entities use outsourced service providers to process transactions on their behalf, or to house and run their IT systems.
Management is responsible for ensuring that service providers implement and operate effective controls. Management remains accountable for the quality of the information it stores in the service provider's systems.
To help management discharge its responsibilities, entities generally engage an independent auditor to review, test and report on the design and operating effectiveness of outsourced controls.
As entities implement cloud-based solutions through outsourced service providers, it is important for management to assure itself that the service provider's controls are operating effectively.
Information and communication
|
Information and communication includes:
|
Information and communication involves providing information in a form and time frame that allows staff to effectively and efficiently discharge their responsibilities and effectively transmit control tasks throughout the entity.
As part of a financial audit, we seek to understand the entity's information systems and related business processes relevant to financial reporting, as well as how management communicates financial reporting roles and responsibilities and other significant matters to interested parties.
The case study in Figure 4D describes the impact of a deficiency in information and communication.
Figure 4D
Case study: Information availability at the Department of Justice and Regulation
|
The Department of Justice and Regulation (DJR) is responsible, through Fines Victoria, for infringement processing and enforcement activities. On 31 December 2017, Fines Victoria was established as part of a range of legislative reforms. This required a new IT system to replace the existing legacy system and the procurement of a new external service provider. The Victorian Infringement Enforcement Warrant (VIEW) system replaced the Victorian Infringement Management System (VIMS) on that date. In our financial audit of DJR, we identified the following issues:
These issues mean that, from the implementation of VIEW, DJR:
DJR had to undertake extra work in August 2018 to ensure these issues did not impact its financial statements at 30 June 2018. This included engaging a professional services firm to assist with their reconciliation of infringement revenue and debt from 1 January 2018 to 30 June 2018. DJR has materially reconciled the revenue and debt numbers by verifying them against external source data, historical trends and predictive analytics. Some issues are still unresolved, and DJR is working to resolve those issues with VIEW. This serves as a reminder on the importance of effective internal controls for the operations of critical business processes. |
Source: VAGO.
5 Financial sustainability of the general government sector
5.1 Conclusion
The GGS continues to operate sustainably and is well positioned financially.
5.2 The sector
The GGS consists of 187 entities that provide goods and services to the community significantly below their production cost. In 2017–18, the GGS generated $64.6 billion in revenue and incurred $62.3 billion of expenses. At 30 June 2018, it reported assets valued at $264.3 billion and liabilities of $80.2 billion.
Figure 5A
Financial information about the GGS
|
|
|
|
|
|
Taxation revenue |
Employee expenses |
Net result from transactions |
Net result |
|
|
|
|
|
|
Net assets |
Non-financial assets |
Borrowings |
Superannuation liability |


Source: Note 9, Annual Financial Report of the State of Victoria: 2017–18.
Revenue
The GGS generates most of its revenue through Commonwealth Government grants, taxes and the sale of goods and services.
In 2017–18, GGS revenue increased by $3.7 billion (6 per cent) to $64.6 billion. The increase is largely due to:
- a $2.4 billion increase in grant revenue resulting from the growth of the GST pool and Victoria's share of the pool
- a $0.7 billion increase in taxation revenue, primarily from property taxes.
Expenditure
Figure 5B shows the value and type of government services the GGS spent money on in 2016–17 and 2017–18. Most GGS expenditure is on employees and general day-to-day running costs.
Figure 5B
Expenditure by government service, 2016–17 and 2017–18
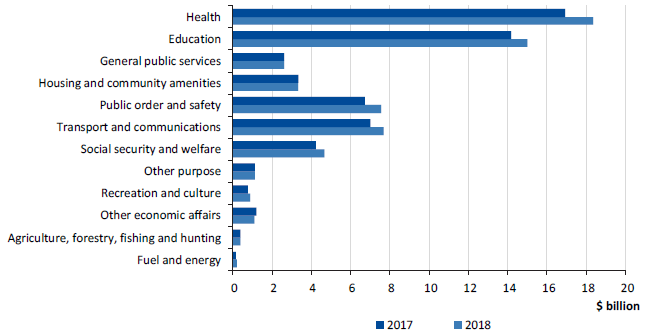
Source: VAGO.
In 2017–18, GGS expenditure increased by $4.1 billion (7 per cent) to $62.3 billion. The increase is largely due to:
- a $1.8 billion increase in employee expenses—relating to increased staff numbers to meet additional demand for hospital and education services and to deliver the government's community safety initiatives
- a $1.2 billion increase in operating expenses—additional spending in health, education, transport and community safety sectors
- a $0.7 billion increase in grant expenses—passing on of Commonwealth Government grants to non-government agencies.
5.3 Financial measures and outcomes
Separately reporting on the GGS allows the government to demonstrate its results against its published budget. The 2017–18 State Budget sets out the government's sustainability objectives for the GGS, which are supported by three key financial measures. Figure 5C details these measures and the government's assessment of the GGS outcome for 2017–18.
Figure 5C
Financial measures, targets and outcomes of the GGS for 2017–18
|
Measure |
Target |
Reported result |
|---|---|---|
|
Operating surplus(a) |
A net operating surplus consistent with maintaining general government net debt at a sustainable level over the medium term. |
A net operating surplus of $2.3 billion for 2017–18. |
|
Net debt(b) |
General government net debt as a percentage of gross state product (GSP) maintained at a sustainable level over the medium term. |
Net debt to GSP of 4.7 per cent at 30 June 2018. |
|
Superannuation |
Fully fund the unfunded superannuation liability by 2035. |
The government is on track to fully fund the unfunded superannuation liability by 2035, with an additional contribution of $1.1 billion to the State Superannuation Fund in 2017−18. |
(a) This indicator relates to the net result from transactions.
(b) Net debt measures the sum of deposits held, advances received, government securities, loans and other borrowings, less the sum of cash and deposits, advances paid and investments, loans and placements.
Source: DTF.
5.4 GGS operating sustainability
Measures of operating sustainability assess the GGS's ability to generate sufficient surpluses to fund its day-to-day operations. Three measures that we use are:
- 'bottom line' operating surplus (net result)
- net result from transactions
- net operating result ratio.
The GGS generated a 'bottom line' operating surplus of $1.5 billion in 2017–18, which was $599 million above the 2017–18 budgeted result. This was primarily due to higher-than-anticipated tax revenue from land transfer duty.
The net result from transactions measure looks at the part of the operating surplus related to government policy decisions and the operations of the government. It excludes changes in the value of assets and liabilities that result from market re‑measurements—such as financial investments and non-financial fixed assets.
Figure 5D shows the net result from GGS transactions over the past five years. To ensure government's revenue and expenditure is sustainable, this result should be in surplus over the medium to long term.
Figure 5D
Net results from transactions—GGS, 2013–14 to 2017–18
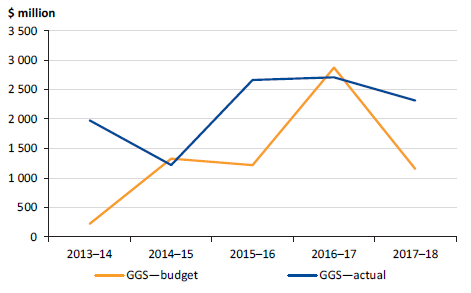
Source: VAGO.
The GGS reported a net result from transactions of $2.3 billion in 2017–18 ($2.7 billion in 2016–17). While this continues a trend of strong results, the lower result than the prior year is mainly attributable to an expansion of service delivery in the health, education, community safety and transport sectors, and $783 million of fees recognised in 2016–17 associated with the lease of the Port of Melbourne that were not received this year.
The net operating result ratio shows how much of each dollar collected by the state translates into the net operating result. Figure 5E shows this net operating result ratio for the GGS over the past five years.
Figure 5E Net operating result ratio—GGS, 2013–14 to 2017–18
Note: Revenue volatility is measured as the standard deviation of revenue growth over the last 15 years.
Source: VAGO.
The net operating result ratio has been consistently positive since 2013–14. In 2017−18, it declined slightly to 3.6 per cent, consistent with the decline in the net result from transactions. The ratio remains above historical volatility in revenue over the last 15 years of 2.9 per cent, indicating there is sufficient capacity to maintain a surplus under normal circumstances.
Risks to operating sustainability
Reliance on taxation revenue and Commonwealth Government grants
In 2017–18, taxation revenue and grants made up 82 per cent of all revenue collected by the state. Payroll tax and land transfer duty are the largest contributors to taxation revenue, making up 56 per cent of total taxation revenue in 2017–18.
Each year, movements in economic and demographic factors affect the taxation revenue collected by the state. Although these are, to a large extent, out of the direct control of government, Victoria's economy is large and diversified when compared with most other Australian states and territories. This makes Victoria's government revenue somewhat less vulnerable to movements in economic conditions because the economy does not rely on a single sector.
Figure 5F shows the volatility of Victoria's taxation revenue growth compared to other Australian jurisdictions over the past 15 years.
Figure 5F
Volatility of growth in taxation revenue, 2003–04 to 2017–18
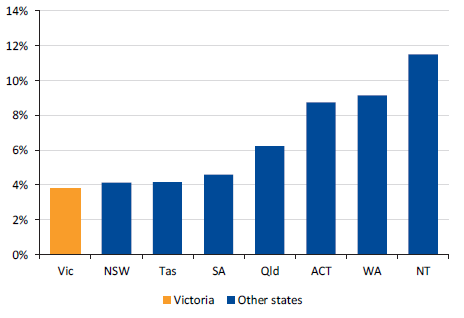
Note: Volatility is measured as the standard deviation of growth over the last 15 years.
Note: ACT figures are estimated outcomes to 2005–06, and actuals thereafter. The 2017–18 figure is an estimated outcome for all jurisdictions except Victoria (actuals).
Source: VAGO.
|
The National GST Pool is the total GST revenue collected around Australia. It is distributed to the states and territories by the Commonwealth Government. |
Grant revenue is mainly received from the Commonwealth Government, including GST grants. In 2017–18, Victoria received $15.6 billion in GST revenue, 24 per cent of total GGS revenue. There are several factors that influence the GST revenue received by the state:
- The overall size of the national GST pool relies on the strength of the national economy. Growth in the GST pool will be lower if consumer spending, consumer prices and wages are low.
- Victoria's share of the GST pool has increased in recent years, largely reflecting strong population growth relative to other states. Were this trend to reverse, Victoria's share of the GST pool would reduce.
- Victoria's economy has outperformed other states in recent years. If this trend continues, Victoria's share of national GST revenue may fall. In particular, movements in iron ore and coal prices, which primarily affect economies in Western Australia and Queensland, create uncertainties for Victoria's GST revenue because weaker commodity-related revenues in those states may increase their GST shares at the expense of Victoria and some other states.
Due to these factors, the state needs to closely monitor and control its expenditure levels to maintain long-term operating sustainability.
Employee expenses
The government must ensure it has a sufficient and suitably qualified workforce to deliver services to Victorians. Employee expenses are the largest contributor to total operating expenses for the GGS. This is also the case in other Australian states and territories.
In 2017–18, the state incurred $24.5 billion in employee expenses, which was 33.6 per cent of its total operating expenses for the year (33.2 per cent in 2016−17). A majority of this relates to the GGS.
The combination of strong growth in the Victorian public sector FTE workforce, together with growth in wages above that of the private sector, has resulted in significant growth in employee expenses. There is a risk that this could place pressure on the state's operating position since, once in place, these expenses are difficult to reduce. That said, growth in operating expenses have to date been met by strong revenue growth and the current operating position remains sustainable.
Employee expenses and the Victorian public sector FTE workforce have grown significantly over the last five years. These trends match the expansion of government services over recent years amid strong population growth (increasing demand for services) and strong economic growth (providing the government with the financial capacity to deliver increased services and infrastructure investment).
Figure 5G shows that employee expenses have increased by 30.3 per cent over the last five financial years, averaging 5.5 per cent per year. Over the same period, employee expenses as a percentage of total operating expenses have remained reasonably constant, at approximately one third of expenses.
Figure 5G
Employee expenses, 2013–14 to 2017–18
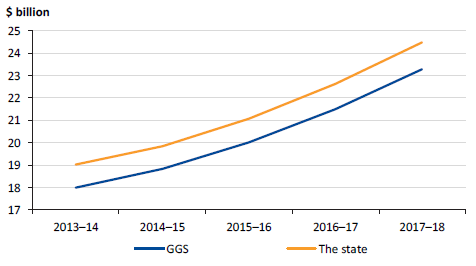
Source: VAGO.
At 30 June 2014, the public sector workforce consisted of approximately 217 000 FTE employees. Since then, there has been a steady increase in the number of FTE employees to approximately 250 000 at 30 June 2018, an average increase of about 3.2 per cent per year.
Figure 5H shows the rate of growth in the Victorian public sector FTE workforce compared to the Victorian population over the past five years.
Figure 5H
Rate of growth in Victorian public sector FTE workforce compared to Victorian population, 2013–14 to 2017–18
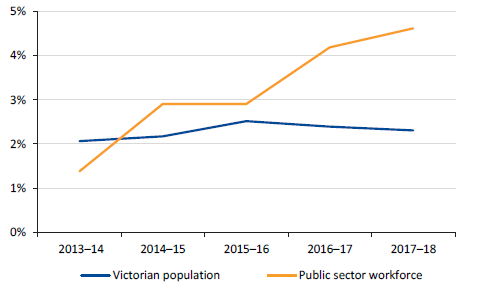
Note: 2017–18 Victorian population growth is based on estimates in the 2018–19 State Budget.
Source: VAGO based on information from the Victorian Public Sector Commission (public sector employment numbers) and the Australian Bureau of Statistics and DTF (Victorian population numbers).
Victoria's population grew by 2.2 per cent in the year to March 2018, slightly below the 2.4 per cent growth in 2016–17 but above the growth of the nation as a whole (1.6 per cent in the year to March 2018). Since 2013–14, the public sector FTE workforce has grown by 15.4 per cent, while population has grown by 9.7 per cent over the same period.
Figure 5I shows that since 2013–14, Victorian public sector wages have increased at a higher rate than the Victorian private sector. This has also been the case for public and private sector wages at the national level over the same period. In 2017–18, the gap widened in Victoria, with public sector wage and salary rates increasing by 3.0 per cent compared to 2.2 per cent for the private sector. The increase in 2017–18 is influenced by enterprise bargaining agreements, including those for government schools, police and public hospitals.
Figure 5I
Rate of growth in ordinary time hourly wage and salary rates, 2013–14 to 2017–18
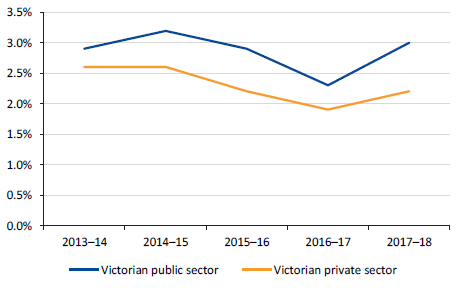
Note: Changes in ordinary-time hourly wages and salary rates arise from award variations, enterprise and workplace agreements, minimum wage setting, individual contracts and other arrangements. This does not include penalty payments for overtime, weekends and public holidays, allowances that fluctuate, or bonus payments.
Source: VAGO based on Australian Bureau of Statistics, wage price index (Victoria, all industries).
There are several differences between public sector and private sector wages. Industries with a significant public sector presence—such as education, public administration and health—have enterprise bargaining agreements in place that have a greater impact on employee wage growth. Wage growth may also be influenced by factors such as industry performance, demand and supply of skills, and productivity.
Economic risks
The Victorian economy has benefited from strong population growth and low interest rates, which have driven growth in household consumption and dwelling investment. Growth has also been supported by greater investment by businesses and the public, while the low Australian dollar has boosted key export sectors such as tourism and education.
Several factors that support current growth are likely to contribute less in the years ahead. As the pace of population growth slows and interest rates begin to rise, overall growth in the Victorian economy is expected to moderate—as projected in the state's latest Budget forecasts.
The economy has a significant bearing on the state's revenue collections. Unexpected movements in economic conditions will have flow-on effects for government revenue and expenses, as well as operating sustainability more broadly. While the chances of such scenarios occurring are relatively low, the greatest impact to the state's financial performance and position would come from a major economic downturn or a major downturn in the property market (or both combined).
Land transfer duty accounts for 30 per cent of total taxation revenue in 2017−18. The duty collected is based on property prices and the number of property sales. If the Victorian property market were to experience a sharper slowdown than anticipated, the revenue for land transfer duty would fall, impacting the state's operating sustainability. Following a period of robust growth, Victoria's property market conditions are softening, with direct implications for the land transfer duty revenue. A combination of factors is weighing on the Victorian property market, including reduced foreign investment, tighter lending standards, stretched affordability and shifting sentiment.
Aside from the risks posed by the property market, the Victorian economy may also be affected by other important risks such as sustained slower-than-projected economic growth.
Another risk is that wage growth remains weak, leading to low growth in payroll tax collections for the GGS. Payroll tax accounted for 26 per cent of total taxation revenue in 2017–18 and is driven by growth in employment and wages.
Victoria's economy is also exposed to risks in the global economy—for example, the possibility of a severe slowdown in China's economy or the rising cost of credit pushing up funding costs for banks. The effects of a downturn in the Chinese economy would flow through to the Australian economy via trade, lower commodity prices, and lower inbound capital from China. This would, in turn, slow investment growth and future productivity growth in Australia. As employment opportunities diminish, migration and population growth may also slow. That said, the outlook is otherwise solid.
5.5 Debt sustainability
In financial terms, sustainable debt is defined as what the state can repay while balancing factors such as economic growth, interest rates and a capacity to generate surpluses in the future.
In part, debt results from the government decisions about the type, timing and funding of capital projects and public services. The state's debt is mainly in the form of public borrowings raised through the Treasury Corporation of Victoria and finance leases relating to assets constructed through PPPs.
Figure 5J shows the value of debt held by the GGS over the past five financial years.
Figure 5J
GGS debt, 30 June 2014 to 30 June 2018
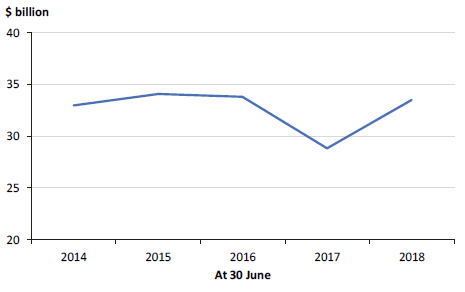
Note: The decrease in 2016–17 is because the state repaid debt using the proceeds from the 50‑year Port of Melbourne lease.
Source: VAGO.
Net debt
The government assesses how manageable the state's debt is by comparing net debt to the state's overall economy, indicated by GSP.
A stable or declining ratio means that state debt is growing at the same rate, or slower, than the economy. We regard such a situation as sustainable when it is combined with operating surpluses after taking account of interest payments.
Figure 5K shows net debt as a percentage of GSP over the past five years.
Figure 5K
Net debt as a percentage of GSP, 30 June 2014 to 30 June 2022
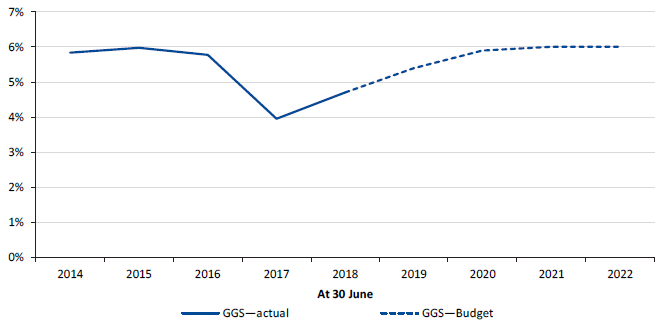
Source: VAGO.
The GGS's net debt increased to $20.0 billion (4.7 per cent of GSP) in 2017–18, up from $15.8 billion (4.0 per cent) in 2016–17. This increase reflects the additional borrowings required to finance the Level Crossing Removal Program and other infrastructure projects.
The government has recognised that the prudent use of debt for major projects is an important source of finance. In the medium term, the government aims to maintain a sustainable level of GGS net debt as a percentage of GSP.
The state's debt burden is expected to remain manageable. Over the next four financial years, net debt as a percentage of GSP is estimated to increase to 6.0 per cent in the GGS. This is not expected to put significant pressure on debt service costs and the net operating surplus, and capital market participants are highly unlikely to view such debt levels as unsustainable. The projected rise in debt is primarily a result of the state borrowing more to fund capital projects and public services. The expected increase in the state's net debt due to significant infrastructure programs and increasing government services is consistent with expectations in other jurisdictions of Australia.
Gross debt
Although state governments commonly use net debt to GSP as a measure, it is also useful to compare gross debt to public sector revenue. This can be particularly informative:
- if the growth in state revenue does not keep pace with economic growth
- in higher-interest-rate regimes, especially where the interest rate is higher than annual GSP growth.
In these scenarios, debt servicing can become more problematic, as interest repayments take a greater bite from own-sourced revenue.
Figure 5L shows gross debt as a percentage of operating revenue. Like net debt, the repayment of debt using proceeds from the Port of Melbourne lease in 2016–17 resulted in a fall in this ratio in 2016–17.
Figure 5L
Gross debt as a percentage of operating revenue, 30 June 2014 to 30 June 2022
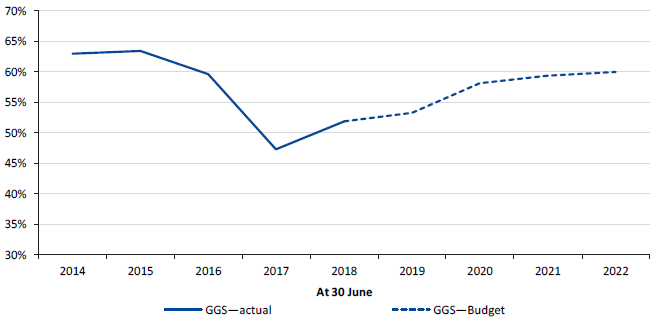
Source: VAGO.
In addition to the debt-to-GSP and debt-to-revenue ratios, comparing interest to operating revenue provides information on the share of revenue devoted to servicing debt costs. Figure 5M shows that this has been falling steadily over time, and that only a relatively small share of revenue is devoted to servicing debt costs (3.2 per cent in 2017–18).
Figure 5M
Gross interest expense as a percentage of operating revenue, 2013–14 to 2017–18
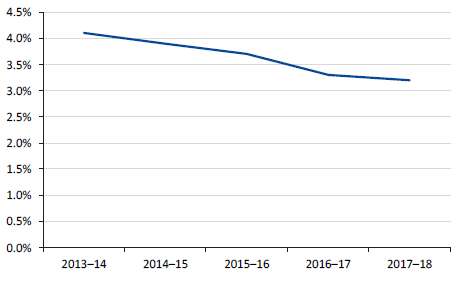
Source: VAGO.
Risks to debt sustainability
Debt sustainability is critical for government—government must have the capacity to repay debt, while delivering on promised services and investment. Higher debt leads to greater interest expenses.
The net debt to GSP and gross debt to revenue ratios above indicate that the state's debt position remains sustainable. Victoria's debt burden compares well to other Australian states and territories, and appears manageable.
The state received a triple-A credit rating from both Moody's and Standard & Poor's. The triple-A credit rating, coupled with interest rates being at historical lows, gives the state access to funds at a relatively low cost. However, it is important to monitor emerging risks that may impact debt sustainability in the future.
The economic risks discussed in Part 5.4 also present key risks to the state's debt levels. In addition, the state's borrowings expose it to interest rate risk. This risk is reduced as the state ensures it has relative certainty over borrowing costs by generally borrowing at fixed interest rates.
At 30 June 2018, approximately 94 per cent of the state's borrowings were at fixed interest rates. However, changes in interest rates will still affect the state's financial position over time, especially as the state refinances maturing debt. Higher interest rates in Australia are likely in the future, particularly with the United States of America continuing to increase rates, which has flow-on effects for financial prices globally.
Superannuation liability
The state is responsible for meeting long-term obligations to public sector employees who are members of four superannuation schemes—two of which no longer accept new members. The obligation represents the estimated difference between the future benefits payable to members, and the assets held to cover those payments.
The government has a financial target of fully funding the unfunded superannuation liability by 2035. Historically, the schemes collectively have not held enough assets at 30 June to cover future obligations. Therefore, a liability has been reported in the AFR. Figure 5N shows the value of the liability reported in the AFR at 30 June over the past five financial years. This liability is valued in accordance with Australian accounting standards which differs from the amount needed to fully fund the schemes.
Figure 5N
Superannuation liability held by the GGS, 30 June 2014 to 30 June 2018
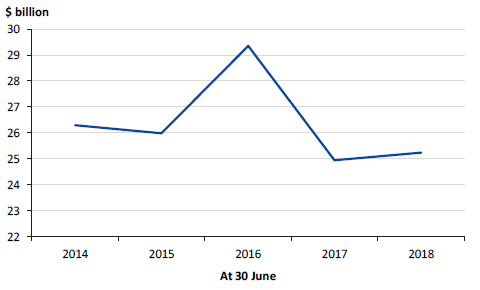
Source: VAGO.
The superannuation obligations fluctuate as the assets and liabilities of the funds are re-measured each financial year. The reported value of this obligation is largely outside of the government's control due to financial and demographic factors that affect it, including:
- the actual return on assets held by the schemes
- movements in discount rates
- the expected rate of future salary increases compared to actual experience
- the expected length of employee turnover compared to actual experience
- any variance between the expected rate of pension increases and actual increases
- the expected longevity of current and future pensioners
- the amount of benefits the schemes have paid during the year.
During 2017–18, the superannuation liability increased by $295 million. Figure 5O details the key drivers behind this.
Figure 5O
Key drivers increasing the value of the superannuation liability in 2017–18
|
Key drivers |
Reason |
Impact on value of superannuation liability |
|---|---|---|
|
Asset experience |
The actual returns on the state super fund and the emergency services superannuation scheme investments were significantly higher than the expected 8 per cent, at 10.92 and 10.43 per cent. |
Decrease of $950 million |
|
Change in discount rate |
The discount rate decreased from 3.0 per cent to 2.8 per cent during 2017–18. |
Increase of $1 000 million |
|
Liability experience |
The experience of actual members and changes in demographic assumptions. |
Increase of $200 million |
Note: Other factors contributed a further $45 million increase to the liability in 2017–18.
Source: VAGO.
Movements in the reported superannuation liability resulting from a change in the discount rate have no impact on the amount of nominal cash flows required to meet the future obligations.
Fully funding the liability by 2035
The state government aims to fully fund the unfunded superannuation liability by 2035. Every year, independent actuaries calculate the amount that the government needs to pay to the funds each year to achieve this target. The future payments are incorporated into the State Budget each year.
Over the past five financial years, the state has been making contributions to the superannuation schemes in line with the State Budget, indicating the state is on track to meet its 2035 target.
5.6 Funding public hospitals
In Victoria, the funding model for public hospitals constrains the costs of providing services to the amount of funding provided to the sector. This model is designed so the sector as a whole breaks even annually.
Financial performance
The hospital sector made a surplus of approximately $17 million in 2017–18. However, individual hospitals generate a surplus or deficit year to year, and individual results are influenced by factors such as capital funding.
Figure 5P shows a significant upward trend in hospital revenue and expenditure over the last five years, both increasing by more than $3.4 billion. Consistent with the funding model, each year revenue and expenditure largely match, except for 2016–17 when two hospitals received large capital grant revenue totalling $841.2 million.
Figure 5P
Public hospitals' revenue and expenditure, 2013–14 to 2017–18
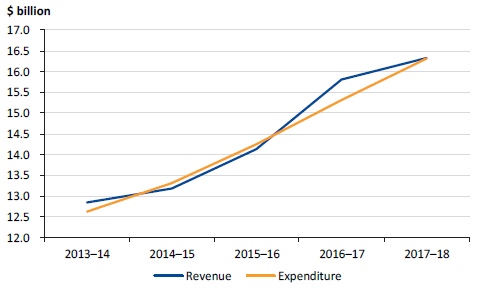
Source: VAGO.
|
Net result indicator measures the surplus or deficit achieved by an entity as a percentage of the total revenue generated in the financial year. |
Figure 5Q shows that the net result indicators of public hospitals at 30 June 2018 vary. Fifty-three of the 86 public hospitals (55 in 2016–17) almost broke even. Ten hospitals (11 in 2016–17) generated a surplus of more than 5 per cent of their revenue. This surplus was mainly influenced by capital grants received by the hospitals. Twenty-three hospitals (20 in 2016–17) generated a deficit of more than 5 per cent of the revenue they received for the financial year.
Figure 5Q
Net result indicator for each of the public hospitals, 2017–18
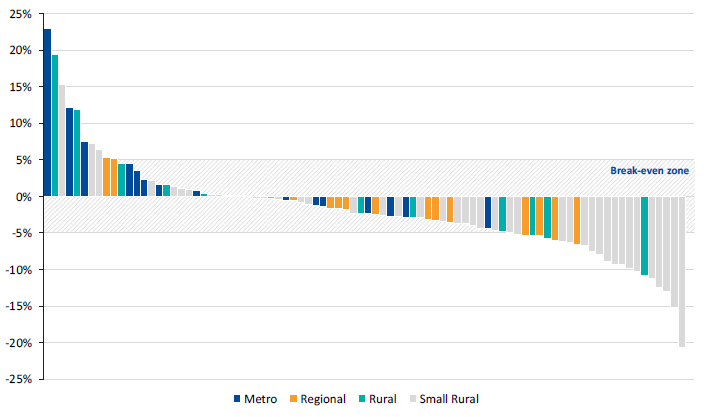
Source: VAGO.
6 Financial sustainability of public financial corporations
6.1 Conclusion
PFCs continue to operate sustainably and are positioned well financially.
6.2 The sector
PFCs are public sector entities that deal with the financial aspects of the state, including insurance, lending and investment management. PFCs can accept deposits from other state entities and undertake borrowings on behalf of the state. There are six PFCs in Victoria.
In 2017–18, PFCs generated $7.9 billion in revenue and incurred $10.0 billion of expenses. At 30 June 2018, PFCs reported assets valued at $80.8 billion and liabilities of $80.1 billion. The majority of the assets and liabilities held by PFCs are financial in nature.
Figure 6A
Financial information about PFCs
|
|
|
|
|
Sale of goods and services |
Net result from transactions |
Net result |
|
|
|
|
|
Net assets |
Financial assets |
Borrowings |


Source: Note 9, Annual Financial Report of the State of Victoria: 2017–18.
Figure 6B provides details on the six PFCs.
Figure 6B
PFCs in Victoria
|
Name of entity |
Purpose |
Value at 30 June 2018 |
|
|---|---|---|---|
|
Total assets |
Total liabilities |
||
|
Transport Accident Commission (TAC) |
TAC manages Victoria's transport accident personal injury scheme, including funding treatment and services for people injured in transport accidents and promoting road safety. TAC aims to improve Victoria's trauma system. |
$16.0 billion |
$16.5 billion |
|
Victorian Managed Insurance Authority (VMIA) |
VMIA provides insurance and risk advice to government, working with government departments and agencies to identify and mitigate harm and manage state-significant risks. |
$2.9 billion |
$2.3 billion |
|
Victorian WorkCover Authority (WorkSafe Victoria) |
WorkSafe Victoria aims to keep all workplaces healthy and safe, and to deliver high-quality care and treatment when workers are injured. WorkSafe Victoria is the state's health and safety regulator and manages Victoria's workers compensation scheme. |
$17.8 billion |
$14.6 billion |
|
State Trustees Limited (STL) |
STL provides estate planning and executor services, trustee services, and other financial planning and investment services. It plays a role in building awareness and educating the community, to protect the financial affairs of Victorians. |
$0.08 billion(a) |
$0.02 billion(a) |
|
Treasury Corporation of Victoria (TCV) |
TCV is the state's central financing authority and financial advisor. It assists the government to manage the state's financial risks by centralising financing and providing financial advisory services. |
$47.8 billion |
$47.6 billion |
|
Victorian Funds Management Corporation (VFMC) |
VFMC provides effective, competitive investment and fund management services to the state and public authorities. |
$0.11 billion |
$0.07 billion |
(a) 30 June 2017 figures. The 2017–18 financial statements of STL were not complete at the time of preparing this report.
Note: Amounts include transactions between PFCs. These are eliminated on consolidation into the AFR.
Source: VAGO.
Additional assets managed by PFCs
Two PFCs manage assets on behalf of other parties and do not report the value of those assets in their balance sheets. Instead, the assets are recorded in the balance sheet of the entity or individual that owns and receives benefits from them.
At 30 June 2018:
- VFMC managed $61.3 billion of investments ($56.1 billion in 2016–17) on behalf of public sector agencies and other voluntary participating bodies—this amount is consolidated into the AFR through the controlling entities' financial statements
- STL managed $2.3 billion of assets ($2.1 billion in 2016–17) on behalf of vulnerable Victorians—these amounts are not reflected in the balance sheet of STL and are not consolidated into the AFR because they are held in trust on behalf of clients.
In this part of the report, we focus our financial sustainability assessment on the four entities significant to the sector:
- the three insurance entities—TAC, VMIA and VWA
- the central financing entity—TCV.
6.3 Financial measures and outcomes
PFCs need to be managed prudently, to ensure their own long-term solvency and viability and to reduce the risk of adverse impacts on the state's finances. To achieve this, the government has established a framework of legislation, policy, prudential standards and guidelines to support the prudent supervision of the PFC insurance entities and TCV.
Insurance entities
|
Outstanding insurance claim is a claim the insuring entity is responsible for paying in the future, where the claim arises from an event that occurred on or before the valuation date. The liability includes an allowance for claims that have occurred but have not yet been reported to the insuring entity. |
At 30 June 2018, the three public sector insurance agencies held $36.7 billion of total assets and $33.4 billion of total liabilities. Approximately 92 per cent of their total liabilities relate to outstanding insurance claims. Figure 6C shows the value of the total outstanding insurance claims liability for the state, as reported in the AFR, over the last five financial years.
Figure 6C
Outstanding insurance claims liability, 30 June 2014 to 30 June 2018
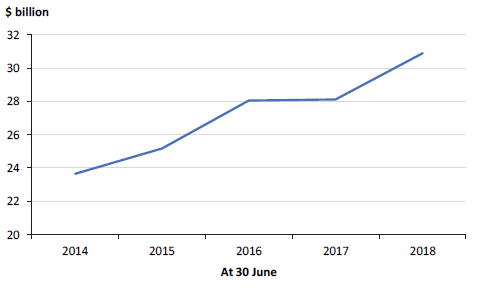
Source: VAGO.
The outstanding insurance claims liability has been growing at a steady rate over the past five financial years and, at 30 June 2018, was valued at $30.9 billion ($28.1 billion at 30 June 2017). TAC accounted for $1.9 billion of the increase in 2017–18, a result of unfavourable claims experience and a decrease in the discount rate used to value the liability for financial reporting purposes.
Capital adequacy
The fundamental objective of the prudential standard is to ensure the capital adequacy of public sector insurers. The prudential standard requires the Minister for Finance to determine a target funding ratio range for each insurer. Funding ratios measure a scheme's adequacy to meet future claims payments.
The target funding ratio range over the last five financial years, based on government's preferred funding level, has been:
- between 82.5 per cent and 117.5 per cent for VWA and VMIA
- between 80.0 per cent and 120.0 per cent for TAC.
Figure 6D shows that for the past five years agency funding ratios have been within or above the preferred funding ratio range.
Figure 6D
Funding ratios, 30 June 2014 to 30 June 2018
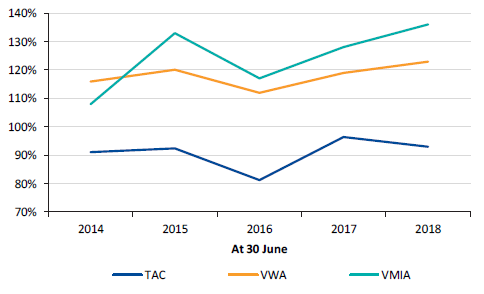
Source: VAGO.
Risks to sustainability
The risk to the sustainability of the state's insurance agencies is small. The outstanding claims liability is measured based on actuarially estimated costs of future claims payments. The estimate assumes that past developments are an appropriate predictor of the future. Unforeseen events may impact this assumption, posing a risk to the sustainability of the insurers.
Treasury Corporation of Victoria
The Treasury Corporation of Victoria Act 1992 outlines TCV's overall objectives:
- to act as a financial institution for the benefit of the state and participating authorities
- to enhance the financial positions of TCV, participating authorities and the state
- to provide its services in an effective, efficient and competitive manner.
TCV's activities include the provision of financial services to state entities. This includes securing loans, managing short-term investments and providing financial products. TCV holds most of the short-term investments and borrowings of the 265 state-controlled entities.
Liquidity
TCV assists the Treasurer of Victoria to monitor and manage the liquidity of the state. It operates as the state's interface with wholesale financial markets and the primary provider of liquidity. In our report on the 2016–17 AFR, we assessed the maturity of TCV's liquidity management framework as largely advanced.
The prudential standard requires TCV to adhere to a minimum ratio of free cash, liquid assets and committed bank lines to the government's debt servicing obligations over the next 12 months—the liquidity ratio. The current liquidity ratio requirement is 80 per cent, which TCV monitors daily.
Figure 6E shows that for the past five years, TCV's average daily liquidity ratio has been above the 80 per cent prudential requirement. This indicates that TCV has ready access to adequate funding from the market and appropriate levels of surplus liquid assets to meet the expected and contingent funding needs of its clients.
Figure 6E
Average daily liquidity ratio, 2013–14 to 2017–18
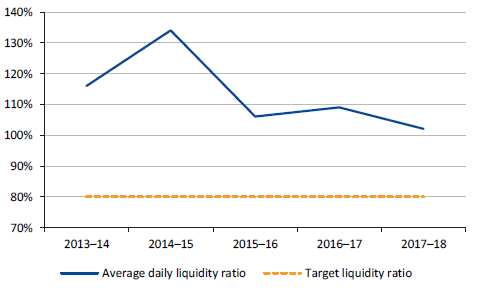
Source: VAGO.
Capital adequacy
TCV is required to maintain sufficient capital to act as a buffer against the credit, market and operational risks associated with its activities. TCV is not required to set aside capital to cover liquidity risks.
The prudential standard requires TCV to maintain a capital adequacy ratio of 8.5 per cent—that is, to hold at least 8.5 per cent of its risk-weighted assets in capital. TCV, however, aims to maintain a capital adequacy ratio of at least 10.5 per cent.
Risk-weighted assets are calculated by adjusting the value of each asset class for risk, to determine TCV's exposure to potential losses. The capital of TCV consists of the capital contributed by the state and any retained earnings.
Figure 6F shows that for the past five years, TCV has maintained a capital adequacy ratio well above the prudential requirement of 8.5 per cent, indicating that TCV has an adequate capital buffer to protect against potential losses.
Figure 6F
Capital adequacy ratio, 30 June 2014 to 30 June 2018
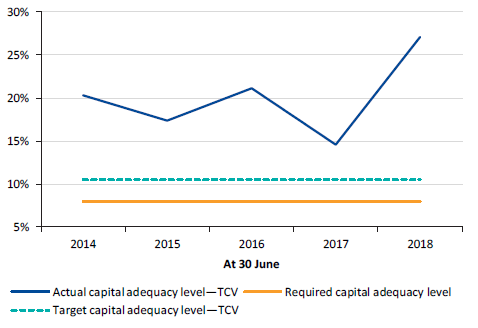
Source: VAGO.
Risks to sustainability
Risks to sustainability of TCV remain small. Developments in global financial market regulations pose some risks to TCV.
7 Financial sustainability of public non-financial corporations
7.1 The sector
PNFCs provide goods and/or services to the community on a user-pays basis. These goods and services are non-financial in nature. At 30 June 2018, there were 72 PNFCs in Victoria.
In 2017–18, PNFCs generated $11.27 billion in revenue and incurred $11.32 billion of expenses. At 30 June 2018, PNFCs reported assets valued at $138.5 billion and liabilities of $41.3 billion.
Figure 7A
Financial information about PNFCs
|
|
|
|
|
Sale of goods and services |
Net result from transactions |
Net result |
|
|
|
|
|
Net assets |
Non-financial assets |
Borrowings |


Source: Note 9, Annual Financial Report of the State of Victoria: 2017–18.
A significant portion of the financial performance and position of the PNFC sector is generated by the 19 entities that make up the water sector. In 2017−18, this sector generated $6.2 billion in revenue and incurred $5.7 billion of expenses. At 30 June 2018, the water entities held assets valued at $47.5 billion and liabilities of $22.0 billion. Figure 7B shows how these figures fit into the wider PNFC sector.
Figure 7B
Summary of financial performance and financial position—the water sector as part of the PNFC sector, 2017−18
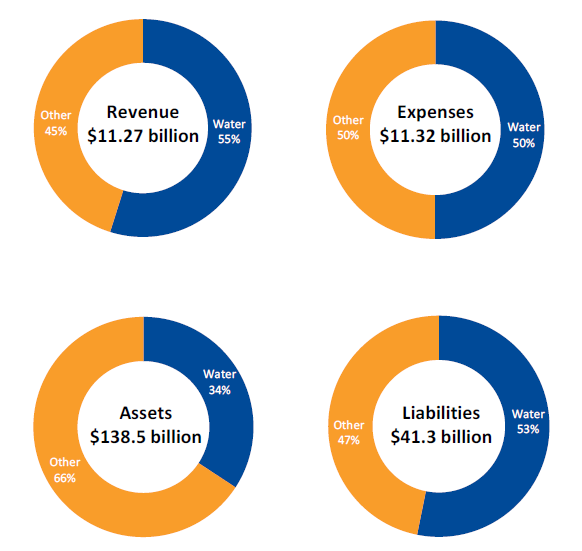
Source: VAGO.
In this Part of the report, we focus our financial sustainability assessment on the water sector.
7.2 Conclusion
We have assessed the water sector as financially sustainable, with no immediate short-term risks identified. In the longer term, some water entities will need to consider the risks associated with their ability to replace or renew assets and repay debt.
7.3 The water sector
How the water entities work
Water entities provide a range of water distribution and sewage disposal services, including supplying water and sewerage services, managing bulk water storage and looking after specific recreational areas, such as caravan parks.
There are 19 water entities in Victoria, each operating as a standalone business with its own board and responsibility for its own management and performance. The board of each water entity reports to the Minister for Water through the Department of Environment, Land, Water and Planning.
As water is considered an essential service, the Essential Services Commission (ESC) is responsible for economic regulation of the sector, including setting the maximum price each water entity can charge its customers for its services.
The 19 water entities are split into three groups, based on their common characteristics. These are detailed in Figure 7C.
Figure 7C
Water entity groups
|
Group |
Description |
|---|---|
|
Metropolitan |
This group consists of a wholesaler and three retail water entities:
|
|
Regional |
There are 13 entities that provide water supply and sewerage services to regional urban customers outside Victoria's metropolitan zone. Regional entities directly charge households and commercial customers for water and sewerage services. Two of these water entities also supply rural water services. |
|
Rural |
This group includes two entities that provide rural water services for irrigation, domestic and stock purposes. These services include water supply, drainage and salinity mitigation. They also provide bulk water supply services to other water entities in regional Victoria. Rural water entities do not provide potable drinking water or sewerage-related services. |
Note: Headworks are engineering structures that divert water flows.
Note: Wholesaler revenue is made up of the bulk service and usage charges that Melbourne Water collects from the metropolitan retailers for treating and transferring water and disposing of sewerage. Wholesaler revenue is eliminated within the state's 2017–18 AFR.
Source: VAGO, based on information provided by the Department of Environment, Land, Water and Planning.
Water entities get most of their revenue from service and usage charges for water, sewerage and other related activities. The Water Act 1989 enables water entities to collect these charges.
7.4 Understanding financial performance
Overview of financial results
Figure 7D provides an overview of the financial results of the Victorian water sector for 2017–18, by group.
Figure 7D
Summary of water entities' financial performance and financial position, 2017–18
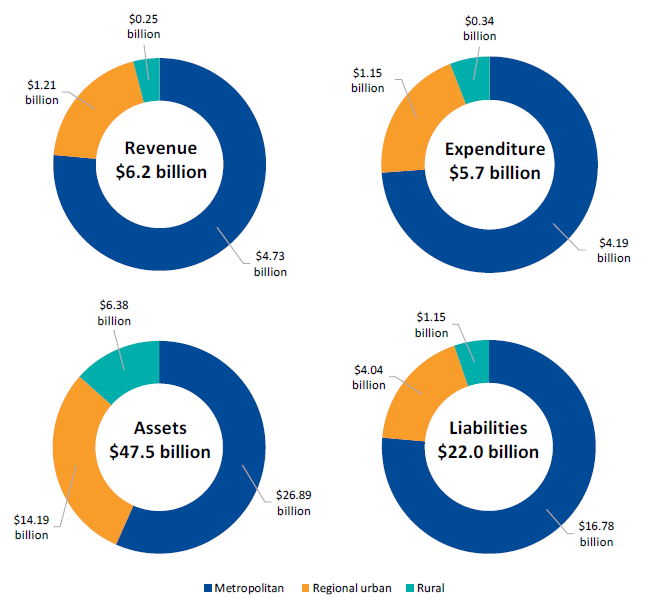
Note: Expenditure includes income tax expenses.
Source: VAGO.
|
The net result margin shows how much of each revenue dollar recognised by the water entity translates into operating profit. A 5 per cent margin means $0.05 is profit for every $1.00 of revenue. |
Net result
The water entities reported a combined net result (profit) after income tax of $515.0 million for 2017–18, an increase of $148.8 million (40.6 per cent) on 2016–17.
Figure 7E shows two measures used to assess the short-term financial sustainability risks of the sector:
- net result margin
- earnings before interest, tax, depreciation and amortisation (EBITDA) margin.
|
Earnings before interest, tax, depreciation and amortisation (EBITDA) margin measures an entity's ability to fund financing charges, tax obligations and asset renewal—the higher the EBITDA margin, the greater availability of funds for this purpose. |
Figure 7E
Average net result margin and average EBITDA margin by group, 2013–14 to 2017–18
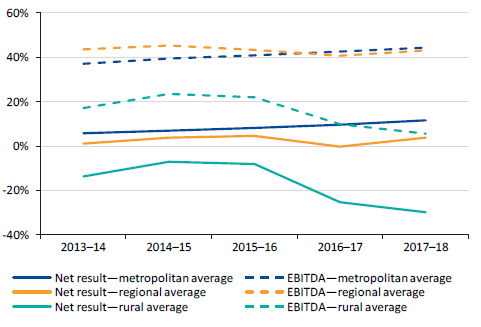
Source: VAGO.
The metropolitan and regional water entities reported a combined net profit after income tax of $605.4 million for 2017–18, an increase of $172.9 million (40.0 per cent) on the prior year. The improved net result is driven by water and sewerage disposal service and usage charges increasing at a faster rate than expenses. This results from:
- continued population growth in Melbourne and regional areas
- increases in water consumption due to lower rainfalls than last year, especially in the northern areas of Victoria.
Metropolitan and regional water entities' EBITDA margins are approximately 43 per cent, enabling them to fund income tax payments, interest payments and depreciation expenses. However, the regional entities' net result margin is slightly above break even, meaning there are limited profits available to pay down debt, dividends or make investments in infrastructure assets.
The two rural water entities reported a combined net deficit after tax of $90.3 million for 2017–18, a deterioration of $24.1 million (36.3 per cent) on 2016−17. While the rural water entities' EBITDA margin is positive, interest and depreciation expenses drive their net results into a deficit position.
The rural water entities continue to incur significant deficits as their ESC‑regulated customer service and usages charges do not adequately fund their depreciation costs. Over the last two years, the downward trend indicates short-term financial sustainability concerns.
7.5 Understanding the financial position
Assets
At 30 June 2018, the water sector held assets of $47.5 billion, an increase of $1.2 billion (2.6 per cent) compared to the prior year.
Water entities' most significant assets are their property, plant, equipment and infrastructure (PPEI) worth $45.3 billion ($44.2 billion in 2016–17). These assets ensure the availability of quality drinking water and delivery of sewerage disposal services to customers.
The net increase of $1.1 billion in the value of PPEI assets on the prior year was due to:
- water entities spending $1.6 billion on replacing and renewing water and sewerage infrastructure
- a $0.4 billion increase in land valuations across metropolitan Melbourne.
This was offset by $0.9 billion of other movements, including depreciation, disposals and asset write-offs.
Asset management is a key area that impacts the long-term financial sustainability of a water entity. One of the key financial challenges for water entities is to plan and carry out asset renewal and replacement. To understand this challenge, we analyse a longer-term indicator—capital replacement.
Capital replacement indicator
The capital replacement indicator illustrates whether water entities are spending more on replacing and renewing assets each year compared with their depreciation expense—depreciation is an indicator of asset consumption.
We calculate this indicator based on a five-year rolling average, over a period of 13 years, as can be seen in Figure 7F. The five-year rolling average allows for better phasing of asset spending by the water entities.
Figure 7F
Five-year rolling average of the capital replacement ratio, 2013–14 to 2021–22
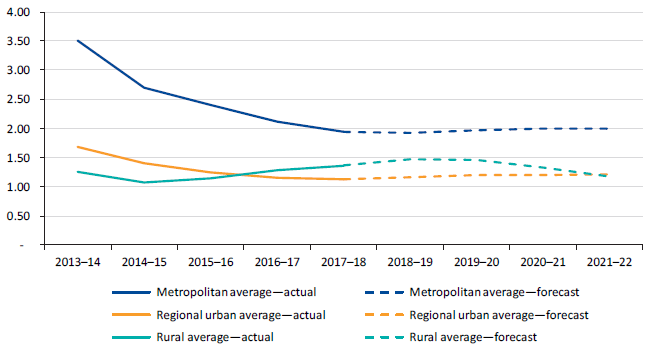
Note: The information from this figure comes from water entities' audited financial statements from 2009–10 to 2017–18 and water entities' 2017–18 corporate plans, which contain forward estimates for the 2018–19 to 2021–22 financial years. Dashed lines represent unaudited data taken from the water entities' corporate plans.
Source: VAGO.
|
Capital replacement indicator—In 2017–18, for every $1.00 of depreciation expense incurred by the water sector, an average of $1.39 was spent on PPEI. |
Figure 7F indicates that the level of capital spending on asset renewal or replacement has kept pace with the consumption of assets, as it has remained above 1.0.
However, over time the trend has declined for metropolitan and regional water entities. In 2009–10, metropolitan water entities revalued their infrastructure assets from cost to fair value for the first time, significantly increasing asset values. The consequence was an increase in annual depreciation expenses, which is driving the decline in the capital replacement indicator. For the metropolitan and regional groups, the forecast to 2021–22 estimates that the ratio will stabilise.
For regional water entities, the declining trend is approaching the benchmark of 1.0. Regional urban water entities need to assess the longer-term risks to their capacity to replace assets at a pace that matches their consumption. Entities with long-lived infrastructure assets require comprehensive asset renewal strategies to support the long-term replacement of core assets.
The improvement in this indicator for the rural group is due to state and Commonwealth funding for new infrastructure assets. Based on corporate plan forecasts, we expect this trend to taper off in 2019–20, as water entities complete current infrastructure projects, causing depreciation to increase and the ratio to decline.
In the longer term, rural entities will face a difficult financial challenge in replacing and renewing their significant infrastructure assets.
Liabilities
At 30 June 2018, the water entities had combined liabilities of $22.0 billion, an increase of $570.1 million (2.7 per cent) on 2016–17.
Gross debt to revenue
At 30 June 2018, the water entities collectively held $15.5 billion of gross debt consisting of borrowings from TCV ($11.3 billion) and finance lease liabilities ($4.2 billion). Borrowings from TCV are secured by guarantees from the Treasurer—meaning that the state holds the risk of water entities not paying the principal and interest on their loans.
|
Statutory obligations include the payment of income tax and dividends. |
The metropolitan group's borrowings from TCV increased by $499.3 million (5.8 per cent) to $9.2 billion at 30 June 2018. The increased borrowings are being used to fund the group's capital expenditure programs and statutory obligations.
The regional group's borrowings from TCV decreased by $18.9 million (1.0 per cent), as most of the regional entities were able to repay their maturing borrowings in 2017–18.
The gross debt to revenue indicator assesses an entity's ability to pay the principal and interest on borrowings from the funds that the entity generates. The lower the ratio, the better the entity's ability to repay its debt from revenue.
Figure 7G shows the indicator for the past five years.
Figure 7G
Gross debt to revenue ratio, 30 June 2014 to 30 June 2018
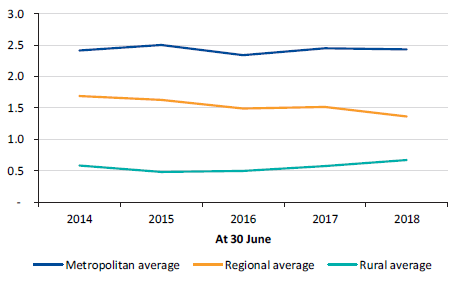
Source: VAGO.
In the metropolitan group, there continues to be significant dependency on debt to fund capital projects, as these entities do not hold sufficient cash reserves or generate sufficient funds from operations. The Borrowing and Investment Powers Act 1987 gives water entities the ability to roll over (refinance) their maturing debt and, in recent years, they have done so.
Our analysis of revenue generated by the metropolitan group shows that, after meeting operational and statutory obligations, only a small surplus remains at the end of each year to pay down debt.
Funding capital projects from debt is appropriate, particularly when the funds are used to construct larger-scale assets with extended useful lives, as costs associated with the assets are spread across future years. However, longer-term financial risks exist for the water entities if maturing debt continues to be rolled over without any plan for repayment.
Equity transactions
Dividends and capital repayments
In 2017–18, the water entities made equity payments of $377.3 million to the state, an increase of $266.2 million on the prior year. The metropolitan water entities paid $288.4 million of dividends to the state, an increase of $177.3 million on the prior year. This payment is made up of the year-end dividend for 2016−17 and an interim dividend for 2017–18.
Under the Water Act 1989, the Treasurer of Victoria determines whether a metropolitan water entity is required to pay a dividend. An obligation to pay a dividend only arises after the Treasurer makes a formal determination after consulting with the entity's board and the Minister for Water.
In addition to dividends, the metropolitan water entities repaid $85.0 million of capital to the state—in other words, these entities paid a further $85.0 million to the state from their cash reserves. This reduces the funds they have available to spend on asset renewal and replacement, and to repay maturing debt.
Appendix A. Audit Act 1994 section 16—submissions and comments
As required by section 16A of the Audit Act 1994, we gave a draft copy of this report to the Treasurer of Victoria and asked for his submissions or comments.
As required by section 16(3) of the Audit Act 1994, we gave relevant extracts of this report to named agencies and asked for their submissions or comments.
We also provided a copy of the report to the Department of Premier and Cabinet.
We have considered their views when reaching our audit conclusions.
Responsibility for the accuracy, fairness and balance of those comments rests solely with the Treasurer of Victoria or agency head.
Responses from the Treasurer of Victoria and Secretary of the Department of Justice and Regulation are included overleaf.
RESPONSE provided by the Treasurer of Victoria
RESPONSE provided by the Secretary, Department of Justice and Regulation
Appendix B. AFR audit opinion
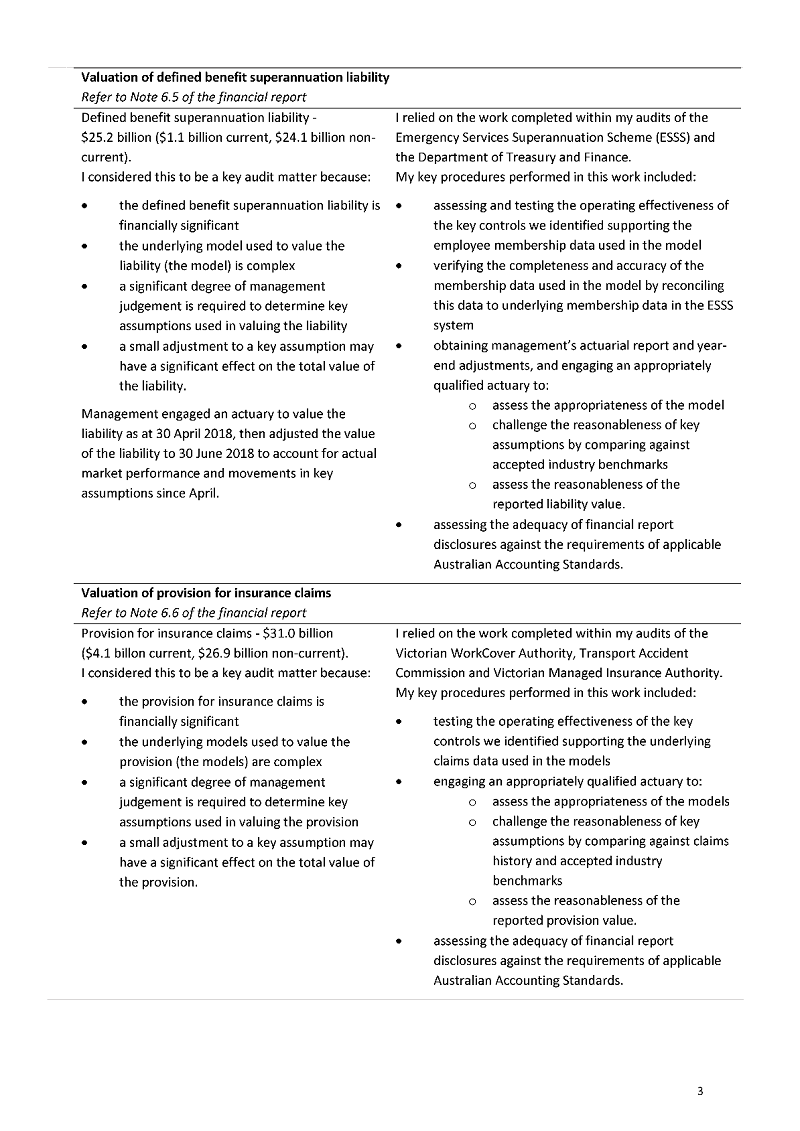
Appendix C. Audit opinions
This Appendix provides information on the audit opinions issued for the 265 entities consolidated into the AFR.
Entities are listed in the following order:
General government sector
Department of Education and Training
Department of Environment, Land, Water and Planning
Department of Health and Human Services
Department of Justice and Regulation
Department of Premier and Cabinet
Department of Economic Development, Jobs, Transport and Resources
Department of Treasury and Finance
Courts
Parliament of Victoria
Victorian Auditor General's Office
Public non-financial corporations
Department of Environment, Land, Water and Planning
Department of Health and Human Services
Department of Justice and Regulation
Department of Premier and Cabinet
Department of Economic Development, Jobs, Transport and Resources
Department of Treasury and Finance
Public financial corporations
Department of Treasury and Finance
General government sector
Figure C1
Department of Education
|
Entity |
Significant state‑controlled entity |
Within legislative time frame |
Audit certification date |
Clear audit opinion |
|---|---|---|---|---|
|
Adult Community and Further Education Board |
✔ |
7/09/2018 |
✔ |
|
|
Adult Multicultural Education Services |
✔ |
29/08/2018 |
✔ |
|
|
Bendigo Kangan Institute |
✔ |
23/03/2018 |
✔ |
|
|
Box Hill Institute |
✔ |
20/02/2018 |
✔ |
|
|
Chisholm Institute |
✔ |
09/03/2018 |
✔ |
|
|
Department of Education and Training |
✔ |
✔ |
21/08/2018 |
✔ |
|
Federation Training |
✘ |
29/03/2018 |
✔ |
|
|
Gordon Institute of TAFE |
✔ |
14/03/2018 |
✔ |
|
|
Goulburn Ovens Institute of TAFE |
✔ |
21/03/2018 |
✔ |
|
|
Holmesglen Institute |
✔ |
13/03/2018 |
✔ |
|
|
Melbourne Polytechnic |
✔ |
09/03/2018 |
✔ |
|
|
South West Institute of TAFE |
✔ |
23/03/2018 |
✔ |
|
|
Sunraysia Institute of TAFE |
✘ |
28/03/2018 |
✔ |
|
|
Victorian Curriculum and Assessment Authority |
✔ |
27/08/2018 |
✔ |
|
|
Victorian Institute of Teaching |
✔ |
17/08/2018 |
✔ |
|
|
Victorian Registration and Qualifications Authority |
✔ |
27/08/2018 |
✔ |
|
|
William Angliss Institute of TAFE |
✔ |
20/03/2018 |
✔ |
|
|
Wodonga Institute of TAFE |
✔ |
09/03/2018 |
✔ |
Source: VAGO.
Figure C2
Department of Environment, Land, Water and Planning
|
Entity |
Significant state‑controlled entity |
Within legislative time frame |
Audit certification date |
Clear audit opinion |
|---|---|---|---|---|
|
Architects Registration Board of Victoria |
✔ |
5/09/2018 |
✔ |
|
|
Corangamite Catchment Management Authority |
✔ |
31/08/2018 |
✔ |
|
|
Department of Environment, Land, Water and Planning |
✔ |
✔ |
9/09/2018 |
✔ |
|
Dhelkunya Dja Land Management Board |
Not yet signed |
|||
|
East Gippsland Catchment Management Authority |
✔ |
5/09/2018 |
✔ |
|
|
Environment Protection Authority |
✔ |
7/09/2018 |
✔ |
|
|
Glenelg Hopkins Catchment Management Authority |
✔ |
28/08/2018 |
✔ |
|
|
Goulburn Broken Catchment Management Authority |
✔ |
27/08/2018 |
✔ |
|
|
Gunaikurnai Traditional Owner Land Management |
✘ |
10/10/2018 |
||
|
Heritage Council of Victoria |
✔ |
17/09/2018 |
✔ |
|
|
Mallee Catchment Management Authority |
✔ |
27/08/2018 |
✔ |
|
|
North Central Catchment Management Authority |
✔ |
23/08/2018 |
✔ |
|
|
North East Catchment Management Authority |
✔ |
22/08/2018 |
✔ |
|
|
Office of the Commissioner for Environmental Sustainability |
✔ |
20/09/2018 |
✔ |
|
|
Parks Victoria |
✔ |
28/08/2018 |
✔ |
|
|
Port Phillip and Westernport Catchment Management Authority |
✔ |
15/08/2018 |
✔ |
|
|
Royal Botanic Gardens Board Victoria |
✔ |
10/09/2018 |
✔ |
|
|
Surveyors Registration Board of Victoria |
Not yet signed |
|||
|
Sustainability Victoria |
✘ |
25/09/2018 |
✔ |
|
|
Trust for Nature (Victoria) |
✔ |
12/09/2018 |
✔ |
|
|
Victorian Building Authority |
Not yet signed |
|||
|
Victorian Environmental Water Holder |
✔ |
10/09/2018 |
✔ |
|
|
Victorian Planning Authority |
✔ |
12/09/2018 |
✔ |
|
|
West Gippsland Catchment Management Authority |
✔ |
30/08/2018 |
✔ |
|
|
Wimmera Catchment Management Authority |
✔ |
27/08/2018 |
✔ |
|
|
Yorta Yorta Traditional Owner Land Management Board |
Not yet signed |
Source: VAGO.
Figure C3
Department of Health and Human Services
|
Entity |
Significant state‑controlled entity |
Within legislative time frame |
Audit certification date |
Clear audit opinion |
|---|---|---|---|---|
|
Albury Wodonga Health |
✔ |
22/08/2018 |
✔ |
|
|
Alexandra District Health |
✔ |
30/08/2018 |
✔ |
|
|
Alfred Health |
✔ |
22/08/2018 |
✔ |
|
|
Alpine Health |
✔ |
5/09/2018 |
✔ |
|
|
Ambulance Victoria |
✔ |
21/08/2018 |
✔ |
|
|
Austin Health |
✔ |
20/08/2018 |
✔ |
|
|
Bairnsdale Regional Health Service |
✔ |
24/08/2018 |
✔ |
|
|
Ballarat Health Services |
✔ |
14/08/2018 |
✔ |
|
|
Barwon Health |
✔ |
21/08/2018 |
✔ |
|
|
Bass Coast Health |
✔ |
31/08/2018 |
✔ |
|
|
Beaufort and Skipton Health Service |
✔ |
30/08/2018 |
✔ |
|
|
Beechworth Health Service |
✔ |
7/09/2018 |
✔ |
|
|
Benalla Health |
✔ |
31/08/2018 |
✔ |
|
|
Bendigo Health Care Group |
✔ |
✔ |
16/08/2018 |
✔ |
|
Boort District Health |
✔ |
6/09/2018 |
✔ |
|
|
Casterton Memorial Hospital |
✔ |
29/08/2018 |
✔ |
|
|
Castlemaine Health |
✔ |
3/09/2018 |
✔ |
|
|
Central Gippsland Health Service |
✔ |
18/09/2018 |
✔ |
|
|
Cobram District Health |
✔ |
6/09/2018 |
✔ |
|
|
Cohuna District Hospital |
✔ |
30/08/2018 |
✔ |
|
|
Colac Area Health |
✔ |
10/09/2018 |
✔ |
|
|
Corryong Health |
✔ |
13/09/2018 |
✔ |
|
|
Dental Health Services Victoria |
✔ |
21/08/2018 |
✔ |
|
|
Department of Health and Human Services |
✔ |
✔ |
30/08/2018 |
✔ |
|
Djerriwarrh Health Services |
✔ |
14/08/2018 |
✔ |
|
|
East Grampians Health Service |
✔ |
31/08/2018 |
✔ |
|
|
East Wimmera Health Service |
✔ |
18/09/2018 |
✔ |
|
|
Eastern Health |
✔ |
✔ |
14/08/2018 |
✔ |
|
Echuca Regional Health |
✔ |
21/08/2018 |
✔ |
|
|
Edenhope and District Memorial Hospital |
✔ |
7/09/2018 |
✔ |
|
|
Gippsland Southern Health Service |
✔ |
10/09/2018 |
✔ |
|
|
Goulburn Valley Health |
✔ |
27/08/2018 |
✔ |
|
|
Health Purchasing Victoria |
✔ |
20/08/2018 |
✔ |
|
|
Heathcote Health |
✔ |
31/08/2018 |
✔ |
|
|
Hepburn Health Service |
✔ |
7/09/2018 |
✔ |
|
|
Hesse Rural Health Service |
✔ |
4/09/2018 |
✔ |
|
|
Heywood Rural Health |
✔ |
22/08/2018 |
✔ |
|
|
Inglewood and Districts Health Service |
✔ |
10/09/2018 |
✔ |
|
|
Kerang District Health |
✔ |
6/09/2018 |
✔ |
|
|
Kilmore and District Hospital |
✔ |
24/08/2018 |
✔ |
|
|
Kooweerup Regional Health Service |
✔ |
7/09/2018 |
✔ |
|
|
Kyabram District Health Services |
✔ |
6/09/2018 |
✔ |
|
|
Kyneton District Health Service |
✔ |
5/09/2018 |
✔ |
|
|
Latrobe Regional Hospital |
✔ |
10/09/2018 |
✔ |
|
|
Lorne Community Hospital |
✔ |
29/08/2018 |
✔ |
|
|
Maldon Hospital |
✔ |
5/09/2018 |
✔ |
|
|
Mallee Track Health and Community Service |
✔ |
3/09/2018 |
✔ |
|
|
Mansfield District Hospital |
✔ |
13/09/2018 |
✔ |
|
|
Maryborough District Health Service |
✔ |
27/08/2018 |
✔ |
|
|
Melbourne Health |
✔ |
✔ |
20/08/2018 |
✔ |
|
Melbourne Cricket Ground Trust |
✔ |
20/07/2018 |
✔ |
|
|
Monash Health |
✔ |
✔ |
20/08/2018 |
✔ |
|
Moyne Health Services |
✔ |
20/08/2018 |
✔ |
|
|
Nathalia District Hospital |
✔ |
5/09/2018 |
✔ |
|
|
Northeast Health Wangaratta |
✔ |
6/09/2018 |
✔ |
|
|
Northern Health |
✔ |
27/08/2018 |
✔ |
|
|
Numurkah District Health Service |
✔ |
30/08/2018 |
✔ |
|
|
Omeo District Health |
✔ |
20/09/2018 |
✔ |
|
|
Orbost Regional Health |
✔ |
31/08/2018 |
✔ |
|
|
Otway Health |
✔ |
5/09/2018 |
✔ |
|
|
Peninsula Health |
✔ |
22/08/2018 |
✔ |
|
|
Peter MacCallum Cancer Centre |
✔ |
✔ |
22/08/2018 |
✔ |
|
Portland District Health |
✔ |
16/08/2018 |
✔ |
|
|
Robinvale District Health Services |
✔ |
31/08/2018 |
✔ |
|
|
Rochester and Elmore District Health Service |
✔ |
27/08/2018 |
✔ |
|
|
Rural Northwest Health |
✔ |
10/09/2018 |
✔ |
|
|
Seymour Health |
✔ |
27/08/2018 |
✔ |
|
|
South Gippsland Hospital |
✔ |
5/09/2018 |
✔ |
|
|
South West Healthcare |
✔ |
27/08/2018 |
✔ |
|
|
Stawell Regional Health |
✔ |
28/08/2018 |
✔ |
|
|
Swan Hill District Health |
✔ |
23/08/2018 |
✔ |
|
|
Tallangatta Health Service |
✔ |
29/08/2018 |
✔ |
|
|
Terang and Mortlake Health Service |
✔ |
20/08/2018 |
✔ |
|
|
The Queen Elizabeth Centre |
✔ |
18/09/2018 |
✔ |
|
|
The Royal Children's Hospital |
✔ |
✔ |
13/09/2018 |
✔ |
|
The Royal Victorian Eye and Ear Hospital |
✔ |
28/08/2018 |
✔ |
|
|
The Royal Women's Hospital |
✔ |
21/08/2018 |
✔ |
|
|
Timboon and District Healthcare Service |
✔ |
15/08/2018 |
✔ |
|
|
Tweddle Child and Family Health Service |
✔ |
18/09/2018 |
✔ |
|
|
Victorian Assisted Reproductive Treatment Authority |
✔ |
27/08/2018 |
✔ |
|
|
Victorian Health Promotion Foundation |
✔ |
28/08/2018 |
✔ |
|
|
Victorian Institute of Forensic Mental Health |
✔ |
29/08/2018 |
✔ |
|
|
Victorian Institute of Sport Limited |
✘ |
24/09/2018 |
✔ |
|
|
Victorian Institute of Sport Trust |
✔ |
20/09/2018 |
✔ |
|
|
Victorian Pharmacy Authority |
✔ |
28/08/2018 |
✔ |
|
|
West Gippsland Healthcare Group |
✔ |
14/09/2018 |
✔ |
|
|
West Wimmera Health Service |
✔ |
3/09/2018 |
✔ |
|
|
Western District Health Service |
✔ |
31/08/2018 |
✔ |
|
|
Western Health |
✔ |
16/08/2018 |
✔ |
|
|
Wimmera Health Care Group |
✔ |
23/08/2018 |
✔ |
|
|
Yarram and District Health Service |
✔ |
7/09/2018 |
✔ |
|
|
Yarrawonga Health |
✔ |
31/08/2018 |
✔ |
|
|
Yea and District Memorial Hospital |
✔ |
6/09/2018 |
✔ |
Source: VAGO.
Figure C4
Department of Justice and Regulation
|
Entity |
Significant state‑controlled entity |
Within legislative time frame |
Audit certification date |
Clear audit opinion |
|---|---|---|---|---|
|
Country Fire Authority |
✔ |
✔ |
30/08/2018 |
✔ |
|
Court Services Victoria |
✔ |
11/09/2018 |
✔ |
|
|
Department of Justice and Regulation |
✔ |
✔ |
17/09/2018 |
✔ |
|
Emergency Services Telecommunications Authority |
✔ |
3/09/2018 |
✔ |
|
|
Metropolitan Fire and Emergency Services Board |
✔ |
✔ |
24/08/2018 |
✔ |
|
Office of Public Prosecutions |
✔ |
31/08/2018 |
✔ |
|
|
Professional Standards Council of Victoria |
✘ |
25/09/2018 |
✔ |
|
|
Residential Tenancies Bond Authority |
✔ |
7/09/2018 |
✔ |
|
|
Senior Master of the Supreme Court |
✔ |
28/08/2018 |
✔ |
|
|
Sentencing Advisory Council |
✔ |
10/09/2018 |
✔ |
|
|
Victoria Legal Aid |
✔ |
31/08/2018 |
✔ |
|
|
Victoria Police (Office of the Chief Commissioner of Police) |
✔ |
✔ |
6/09/2018 |
✔ |
|
Victoria State Emergency Service Authority |
✔ |
12/09/2018 |
✔ |
|
|
Victorian Commission for Gambling and Liquor Regulation |
✔ |
✔ |
6/09/2018 |
✔ |
|
Victorian Equal Opportunity and Human Rights Commission |
✔ |
11/09/2018 |
✔ |
|
|
Victorian Institute of Forensic Medicine |
✔ |
7/09/2018 |
✔ |
|
|
Victorian Law Reform Commission |
✔ |
3/09/2018 |
✔ |
|
|
Victorian Legal Services Board and Commissioner |
✔ |
✔ |
17/08/2018 |
✔ |
|
Victorian Responsible Gambling Foundation |
✔ |
17/09/2018 |
✔ |
Source: VAGO.
Figure C5
Department of Premier and Cabinet
|
Entity |
Significant state-controlled entity |
Within legislative time frame |
Audit certification date |
Clear audit opinion |
|---|---|---|---|---|
|
Department of Premier and Cabinet |
✔ |
✔ |
31/08/2018 |
✔ |
|
Independent Broad‑based Anti‑corruption Commission (IBAC) |
✔ |
9/09/2018 |
✔ |
|
|
Infrastructure Victoria |
✔ |
5/09/2018 |
✔ |
|
|
Shrine of Remembrance Trustees |
✔ |
24/08/2018 |
✔ |
|
|
Victorian Electoral Commission |
✔ |
17/08/2018 |
✔ |
|
|
Victorian Inspectorate |
✔ |
7/09/2018 |
✔ |
|
|
Victorian Ombudsman |
✔ |
10/09/2018 |
✔ |
|
|
Victorian Public Sector Commission |
✔ |
5/09/2018 |
✔ |
Source: VAGO.
Figure C6
Department of Economic Development, Jobs, Transport and Resources
|
Entity |
Significant state-controlled entity |
Within legislative time frame |
Audit certification date |
Clear audit opinion |
|---|---|---|---|---|
|
Australian Centre for the Moving Image |
✔ |
31/08/2018 |
✔ |
|
|
Department of Economic Development, Jobs, Transport and Resources |
✔ |
✔ |
18/09/2018 |
✔ |
|
Docklands Studios Melbourne Pty Ltd |
✔ |
17/08/2018 |
✔ |
|
|
Energy Safe Victoria |
✔ |
17/08/2018 |
✔ |
|
|
Film Victoria |
✔ |
23/08/2018 |
✔ |
|
|
Game Management Authority |
Not yet signed |
|||
|
Library Board of Victoria |
✔ |
10/09/2018 |
✔ |
|
|
Melbourne Recital Centre Limited |
✔ |
31/08/2018 |
✔ |
|
|
Museums Board of Victoria |
✔ |
3/09/2018 |
✔ |
|
|
National Gallery of Victoria, Council of Trustees |
✔ |
✔ |
31/08/2018 |
✔ |
|
Public Transport Development Authority |
✔ |
✔ |
4/09/2018 |
✔ |
|
Roads Corporation |
✔ |
✔ |
31/08/2018 |
✔ |
|
Taxi Services Commission |
✔ |
18/09/2018 |
✔ |
|
|
Veterinary Practitioners Registration Board of Victoria |
✔ |
25/08/2018 |
✔ |
|
|
Victorian Fisheries Authority |
✔ |
10/09/2018 |
||
|
Visit Victoria |
✔ |
7/09/2018 |
✔ |
Source: VAGO.
Figure C7
Department of Treasury and Finance
|
Entity |
Significant state-controlled entity |
Within legislative time frame |
Audit certification date |
Clear audit opinion |
|---|---|---|---|---|
|
CenITex |
✔ |
4/09/2018 |
✔ |
|
|
Department of Treasury and Finance |
✔ |
✔ |
17/09/2018 |
✔ |
|
Essential Services Commission |
✔ |
12/09/2018 |
✔ |
Source: VAGO.
|
Entity |
Significant state-controlled entity |
Within legislative time frame |
Audit certification date |
Clear audit opinion |
|---|---|---|---|---|
|
Judicial College of Victoria |
✔ |
7/09/2018 |
✔ |
|
|
Judicial Commission of Victoria |
Not yet signed |
Source: VAGO.
Figure C9
Parliament of Victoria
|
Entity |
Significant state-controlled entity |
Within legislative time frame |
Audit certification date |
Clear audit opinion |
|---|---|---|---|---|
|
Parliament of Victoria |
✔ |
23/08/2018 |
✔ |
Source: VAGO.
Figure C10
Victorian Auditor-General's Office
|
Entity |
Significant state-controlled entity |
Within legislative time frame |
Audit certification date |
Clear audit opinion |
|---|---|---|---|---|
|
Victorian Auditor-General's Office |
✔ |
21/08/2018 |
✔ |
Source: VAGO.
Public non-financial corporations
Figure C11
Department of Environment, Land, Water and Planning
|
Entity |
Significant state-controlled entity |
Within legislative time frame |
Audit certification date |
Clear audit opinion |
|---|---|---|---|---|
|
Alpine Resorts Co-ordinating Council |
✘ |
24/09/2018 |
✔ |
|
|
Barwon Region Water Corporation |
✔ |
27/08/2018 |
✔ |
|
|
Barwon South West Waste and Resource Recovery Group |
✔ |
28/08/2018 |
✔ |
|
|
Central Gippsland Region Water Corporation |
✔ |
31/08/2018 |
✔ |
|
|
Central Highlands Region Water Corporation |
✔ |
3/09/2018 |
✔ |
|
|
City West Water Corporation |
✔ |
✔ |
3/09/2018 |
✔ |
|
Coliban Region Water Corporation |
✔ |
31/08/2018 |
✔ |
|
|
East Gippsland Region Water Corporation |
✔ |
7/09/2018 |
✔ |
|
|
Falls Creek Alpine Resort Management Board |
✔ |
13/03/2018 |
✔ |
|
|
Gippsland and Southern Rural Water Corporation |
✔ |
7/09/2018 |
✔ |
|
|
Gippsland Waste and Resource Recovery Group |
✔ |
11/09/2018 |
✔ |
|
|
Goulburn Murray Rural Water Corporation |
✔ |
✔ |
3/09/2018 |
✔ |
|
Goulburn Valley Region Water Corporation |
✔ |
30/08/2018 |
✔ |
|
|
Goulburn Valley Waste and Resource Recovery Group |
✔ |
12/09/2018 |
✔ |
|
|
Grampians Central West Waste and Resource Recovery Group |
✔ |
7/09/2018 |
✔ |
|
|
Grampians Wimmera Mallee Water Corporation |
✔ |
31/08/2018 |
✔ |
|
|
Loddon Mallee Waste and Resource Recovery Group |
✔ |
15/08/2018 |
✔ |
|
|
Lower Murray Urban and Rural Water Corporation |
✔ |
5/09/2018 |
✔ |
|
|
Melbourne Water Corporation |
✔ |
✔ |
28/08/2018 |
✔ |
|
Metropolitan Waste and Resource Recovery Group |
Not yet signed |
|||
|
Mount Buller and Mount Stirling Alpine Resort Management Board |
✔ |
26/02/2018 |
✔ |
|
|
Mount Hotham Alpine Resort Management Board |
✔ |
19/03/2018 |
✔ |
|
|
North East Region Water Corporation |
✔ |
22/08/2018 |
✔ |
|
|
North East Waste and Resource Recovery Group |
✔ |
9/08/2018 |
✔ |
|
|
Phillip Island Nature Parks |
✔ |
5/09/2018 |
✔ |
|
|
Southern Alpine Resort Management Board |
✔ |
08/03/2018 |
✔ |
|
|
South East Water Corporation |
✔ |
✔ |
23/08/2018 |
✔ |
|
South Gippsland Region Water Corporation |
✔ |
10/09/2018 |
✔ |
|
|
Wannon Region Water Corporation |
✔ |
27/08/2018 |
✔ |
|
|
Western Region Water Corporation |
✔ |
23/08/2018 |
✔ |
|
|
Westernport Region Water Corporation |
✔ |
11/09/2018 |
✔ |
|
|
Yarra Valley Water Corporation |
✔ |
✔ |
28/08/2018 |
✔ |
|
Zoological Parks and Gardens Board |
✘ |
27/09/2018 |
✔ |
Source: VAGO.
Figure C12
Department of Health and Human Services
|
Entity |
Significant state-controlled entity |
Within legislative time frame |
Audit certification date |
Clear audit opinion |
|---|---|---|---|---|
|
Ballarat General Cemeteries Trust |
✔ |
5/09/2018 |
✔ |
|
|
Bendigo Cemeteries Trust |
✔ |
31/08/2018 |
✔ |
|
|
Geelong Cemeteries Trust |
✔ |
15/08/2018 |
✔ |
|
|
Greater Metropolitan Cemeteries Trust |
✔ |
16/08/2018 |
✔ |
|
|
Kardinia Park Stadium Trust |
✔ |
23/08/2018 |
✔ |
|
|
Melbourne and Olympic Parks Trust |
✔ |
29/08/2018 |
✔ |
|
|
Mildura Cemetery Trust |
✔ |
3/09/2018 |
✔ |
|
|
Queen Victoria Women's Centre Trust |
✔ |
27/08/2018 |
✔ |
|
|
Southern Metropolitan Cemeteries Trust |
✔ |
2/08/2018 |
✔ |
|
|
State Sport Centres Trust |
✔ |
27/08/2018 |
✔ |
Source: VAGO.
Figure C13
Department of Justice and Regulation
|
Entity |
Significant state-controlled entity |
Within legislative time frame |
Audit certification date |
Clear audit opinion |
|---|---|---|---|---|
|
Greyhound Racing Victoria |
✔ |
30/08/2018 |
✔ |
|
|
Harness Racing Victoria |
✔ |
3/09/2018 |
✔ |
Source: VAGO.
Figure C14
Department of Premier and Cabinet
|
Entity |
Significant state-controlled entity |
Within legislative time frame |
Audit certification date |
Clear audit opinion |
|---|---|---|---|---|
|
VITS LanguageLoop |
✔ |
27/08/2018 |
✔ |
Source: VAGO.
Figure C15
Department of Economic Development, Jobs, Transport and Resources
|
Entity |
Significant state-controlled entity |
Within legislative time frame |
Audit certification date |
Clear audit opinion |
|---|---|---|---|---|
|
Agriculture Victoria Services Pty Ltd |
✔ |
29/08/2018 |
✔ |
|
|
Australian Grand Prix Corporation |
✔ |
17/08/2018 |
✔ |
|
|
Dairy Food Safety Victoria |
✔ |
28/08/2018 |
✔ |
|
|
Development Victoria |
✔ |
28/08/2018 |
✔ |
|
|
Emerald Tourist Railway Board |
✘ |
9/10/2018 |
✔ |
|
|
Fed Square Pty Ltd |
✔ |
6/09/2018 |
✔ |
|
|
Geelong Performing Arts Centre Trust |
✔ |
21/08/2018 |
✔ |
|
|
Greater Sunraysia Pest Free Area Industry Development Committee |
✔ |
18/09/2018 |
✔ |
|
|
Launch Vic |
Not yet signed |
|||
|
Melbourne Convention and Exhibition Trust |
✔ |
21/08/2018 |
✔ |
|
|
Melbourne Market Authority |
✔ |
3/09/2018 |
✔ |
|
|
Melbourne Port Lessor Pty Ltd |
✔ |
✔ |
22/08/2018 |
✔ |
|
Murray Valley Wine Grape Industry Development Committee |
✔ |
17/09/2018 |
✔ |
|
|
Port of Hastings Development Authority |
✔ |
4/09/2018 |
✔ |
|
|
PrimeSafe |
✔ |
29/08/2018 |
✔ |
|
|
V/Line Corporation |
✔ |
30/08/2018 |
✔ |
|
|
VicForests |
✔ |
3/09/2018 |
✔ |
|
|
Victorian Arts Centre Trust |
✔ |
29/08/2018 |
✔ |
|
|
Victorian Major Events Company Limited |
Not yet signed |
|||
|
Victorian Ports Corporation (Melbourne) |
✔ |
29/08/2018 |
✔ |
|
|
Victorian Rail Track |
✔ |
✔ |
3/09/2018 |
✔ |
|
Victorian Regional Channels Authority |
✔ |
28/08/2018 |
✔ |
|
|
Victorian Strawberry Industry Development Committee |
✔ |
3/08/2018 |
✔ |
Source: VAGO.
Figure C16
Department of Treasury and Finance
|
Entity |
Significant state-controlled entity |
Within legislative time frame |
Audit certification date |
Clear audit opinion |
|---|---|---|---|---|
|
Accident Compensation Conciliation Service |
✔ |
22/08/2018 |
✔ |
|
|
State Electricity Commission of Victoria |
✔ |
✔ |
21/08/2018 |
✔ |
|
Victorian Plantations Corporation (shell) |
✔ |
18/09/2018 |
✔ |
Source: VAGO.
Public financial corporations
Figure C17
Department of Treasury and Finance
|
Entity |
Significant state‑controlled entity |
Within legislative time frame |
Audit certification date |
Clear audit opinion |
|---|---|---|---|---|
|
State Trustees Limited |
Not yet signed |
|||
|
Transport Accident Commission |
✔ |
✔ |
4/09/2018 |
✔ |
|
Treasury Corporation of Victoria |
✔ |
✔ |
21/08/2018 |
✔ |
|
Victorian Funds Management Corporation |
✔ |
20/08/2018 |
✔ |
|
|
Victorian Managed Insurance Authority |
✔ |
✔ |
30/08/2018 |
✔ |
|
Victorian WorkCover Authority (WorkSafe Victoria) |
✔ |
✔ |
28/08/2018 |
✔ |
Appendix D. Financial reporting maturity framework
Figure D1
Financial reporting maturity framework
|
Component |
Risk definition |
|||
|---|---|---|---|---|
|
Developing |
Intermediate |
Mature |
Advanced |
|
|
|
|
|
|
|
|
|
|
|
|
|
|
|
|
|
|
|
|
|
|
|
|
|


Source: VAGO.
Appendix E. Management letter risk rating definitions
Figure E1
Risk definitions applied to issues reported in audit management letters
|
Rating |
Description |
Management action required |
|---|---|---|
|
High |
This issue represents:
|
|
|
Moderate |
This issue represents:
|
|
|
Low |
This issue represents:
|
|
Source: VAGO.
Appendix F. Water sector financial sustainability risk indicators
This appendix sets out the definitions and criteria we used for the current and prior years to assess and report on financial sustainability risks across the water sector.
These financial sustainability indicators are only indicative, highlighting ongoing and emerging financial sustainability risks at a sector and group level—metropolitan, regional urban and rural.
It is important to note that a definitive view of financial sustainability requires a more holistic analysis beyond historical financial reporting, taking into account forward-looking financial forecasts and plans, operations and an entity's environment, particularly the regulatory environment within which these water entities must operate.
Figure F1 shows the indicators we used to assess the financial sustainability risks of the water entities covered by this report. These indicators should be considered collectively and are more useful when assessed over time as part of trend analysis.
Figure F1
Financial sustainability indicator definitions and formulas
|
Indicator |
Definition |
Formula |
|---|---|---|
|
Short-term financial sustainability indicators |
||
|
Cash interest cover |
This measures an entity's ability to meet ongoing interest payments and ability to service debt. The higher the ratio, the better the ability for the entity to meet its interest payments from borrowings. |
Net operating cash flows before net interest and tax payments / Net interest payments |
|
Internal financing (%) |
This measures an entity's ability to finance capital works using cash generated by its operating cash flows. The higher the percentage, the greater the ability for the entity to finance capital works from its own funds. |
Net operating cash flows less dividends / Net capital expenditure |
|
Current ratio |
This measures an entity's ability to pay existing liabilities in the next 12 months. A ratio greater than 1.0 means there are more cash and liquid assets than short-term liabilities. |
Current assets / Current liabilities (excluding long‑term employee provisions and revenue in advance) |
|
EBITDA margin (%) |
This measures an entity's ability to generate surplus to fund its operations. This measure is generally used for entities with significant fixed assets and/or debt financing. The larger the EBITDA margin, the stronger the result. |
Earnings before interest, tax, depreciation and amortisation / Total revenue |
|
Net result margin (%) |
This measures how much of each dollar collected as revenue translates to net result. A positive result indicates a surplus, and the larger the percentage, the stronger the result. |
Net result after tax / Total revenue |
|
Long-term financial sustainability indicators |
||
|
Gearing ratio (%) |
This is a longer-term measure that compares all current and non-current interest-bearing liabilities to total assets. It complements the current ratio, which is a short-term measure. A lower ratio indicates that the entity relies less on debt to finance its assets. |
Total debt (including finance leases) / Total assets |
|
Return on assets (%) |
This ratio shows the percentage of profit the entity earns in relation to its overall resources. A positive result indicates the entity's resources are generating a surplus, and the larger the percentage, the stronger the result. |
Earnings before net interest and tax / Average total assets |
|
Return on equity (%) |
This is a measure of profitability which calculates how many dollars of profit an entity generates with each dollar of equity. A positive result indicates the entity is generating a surplus with each dollar of shareholders' equity, and the larger the percentage, the stronger the result. |
Net profit after tax / Average total equity |
|
Capital replacement |
This compares of the rate spending on infrastructure, property, plant and equipment, and intangibles with depreciation and amortisation. This is a long-term indicator, as capital expenditure can differ in the short term if there are insufficient funds available from operations, and borrowing is not an option. A ratio less than 1.0 means the spending on capital works has not kept pace with consumption of assets. |
Cash outflows for property, plant and equipment and intangibles / Depreciation and amortisation |
|
Gross debt to revenue |
This assesses an entity's ability to pay the principal and interest on borrowings, as and when they fall due, from the funds that the entity generates. The lower the ratio, the less revenue the entity is required to use repay its total debt. |
Total interest-bearing liabilities (including finance lease) / Total revenue |
|
Net debt to revenue |
This assesses an entity's ability to pay the principal and interest on borrowings, as and when they fall due, from the funds it generates. The lower the ratio, the less revenue the entity is required to use to repay its total debt. |
Total interest-bearing liabilities (including finance lease) less cash and cash equivalent / Total revenue |
Source: VAGO.
Appendix G. Glossary
Asset
An item or resource controlled by an entity that will be used to generate economic benefits.
Asset valuation
The fair value of a non-current asset on a specified date.
Audit Act 1994
Victorian legislation establishing the Auditor-General's operating powers and responsibilities and detailing the nature and scope of audits that the Auditor-General may carry out.
Audit committee
Helps a governing board to fulfil its governance and oversight responsibilities and strengthen the accountability of senior management.
Audit opinion
A written expression, within a specified framework, indicating the auditor's overall conclusion about a financial (or performance) report based on audit evidence.
Capital expenditure
Money an entity spends on:
- new physical assets, including buildings, infrastructure, plant and equipment
- renewing existing physical assets to extend their service potential or life.
Clear audit opinion
A positive written expression provided when the financial report has been prepared and presents fairly the transactions and balances for the reporting period in keeping with the requirements of the relevant legislation and Australian accounting standards. Also referred to as an unqualified audit opinion.
Control environment
Processes within an entity's governance and management structure that provide reasonable assurance about the achievement of an entity's objectives in terms of the reliability of financial reporting, the effectiveness and efficiency of operations, and compliance with applicable laws and regulations.
Current asset
An asset that will be sold or realised within 12 months of the end of the financial year being reported on, such as term deposits maturing in three months or stock items available for sale.
Current liability
A liability that will be settled within 12 months of the end of the financial year being reported on, such as payment of a creditor for services provided to the entity.
Debt
Money owed by one party to another party.
Deficit
When total expenditure is more than total revenue.
Depreciation
Systematic allocation of the value of an asset over its expected useful life, recorded as an expense.
Eliminations
Removing the effect of transactions between entities when preparing consolidated financial statements.
Entity
A corporate or unincorporated body that has a public function to exercise on behalf of the state or is wholly owned by the state, including departments, statutory authorities, statutory corporations and government business enterprises.
Equity or net assets
Residual interest in the assets of an entity after its liabilities have been deducted.
Expense
The outflow of assets or the depletion of assets an entity controls during the financial year, including expenditure and the depreciation of physical assets. An expense can also be the incurrence of liabilities during the financial year, such as increases to a provision.
Financial report
A document reporting the financial outcome and position of an entity for a financial year, which contains financial statements including a comprehensive income statement, a balance sheet, a cash flow statement, a comprehensive statement of equity, and notes.
Financial sustainability
An entity's ability to manage financial resources so it can meet its current and future spending commitments, while maintaining assets in the condition required to provide services.
Financial year
A period of 12 months for which a financial report is prepared, which may be a different period to the calendar year.
Fiscal targets
Targets set by the government to meet short- and medium-term economic objectives.
General government sector
All government departments, offices and other bodies that provide services free of charge or at prices significantly below their cost of production, less eliminations. General government services include those that are mainly non-market-based, those that are largely for collective consumption by the community, and those that involve the transfer or redistribution of income. These services are financed mainly through taxes, other compulsory levies and user charges.
Going concern
An entity that is expected to be able to pay its debts when they fall due, and continue in operation without any intention or necessity to liquidate or otherwise wind up its operations.
Governance
The control arrangements used to govern and monitor an entity's activities to achieve its strategic and operational goals.
Internal audit
A function of an entity's governance framework that examines and reports to management on the effectiveness of the entity's risk management, internal controls and governance processes.
Internal control
A method of directing, monitoring and measuring an entity's resources and processes to prevent and detect error and fraud.
Investment
Public or private sector expenditure for the development and/or use of assets, intended to result in medium- to long-term service and/or financial benefits.
Issues
Weaknesses or other concerns in the governance structure of an entity identified during a financial audit, which are reported to them in a management letter.
Liability
A present obligation of the entity arising from past events, the settlement of which is expected to result in an outflow of assets from the entity.
Management letter
A letter the auditor writes to the governing body, the audit committee and the management of an entity outlining issues identified during the financial audit.
Material error or adjustment
An error that may result in the omission or misstatement of information, which could influence the economic decision of users taken on the basis of the financial statements.
Materiality
Information is material if its omission, misstatement or non-disclosure has the potential to affect the economic decisions of users of the financial report, or the discharge of accountability by management or those charged with governance. The size, value and nature of the information and the circumstances of its omission or misstatement help in deciding how material it is.
Net result
The value that an entity has earned or lost over the stated period—usually a financial year—calculated by subtracting an entity's total expenses from its total revenue for that period.
Non-current asset
An asset that will be sold or realised later than 12 months after the end of the financial year being reported on, such as investments with a maturity date of two years or physical assets the entity holds for long-term use.
Non-current liability
A liability that will be settled later than 12 months after the end of the financial year being reported on, such as repayments on a five-year loan that are not due in the next 12 months.
Physical asset
A non-financial asset that is a tangible item an entity controls, and that will be used by the entity for more than 12 months to generate profit or provide services, such as building, equipment or land.
Public financial corporation sector
Public sector corporations, including the government's central borrowing authorities, that provide financial services.
Public non-financial corporation sector
Public entities that provide goods and / or services in a competitive market.
Qualified audit opinion
An opinion issued when the auditor concludes that an unqualified opinion cannot be expressed because of:
- disagreement with those charged with governance or
- conflict between applicable financial reporting frameworks or
- limitation of scope.
A qualified opinion is considered to be unqualified except for the effects of the matter that relates to the qualification.
Revaluation
The restatement of a value of non-current assets at a particular point in time.
Revenue
Inflows of funds or other assets or savings in outflows of service potential, or future economic benefits in the form of increases in assets or reductions in liabilities of an entity, other than those relating to contributions by owners, that result in an increase in equity during the reporting period.
Risk
The chance of a negative or positive impact on the objectives, outputs or outcomes of an entity.
Risk register
A tool an entity uses to help identify, monitor and mitigate risks. The register may appear in the form of a plot graph or a table.
Significant state-controlled entities
Those entities that are collectively deemed to have a significant effect on the transactions and balances reported in the state's annual financial report.
Metropolitan Hospitals 2017–18 Dashboard
We have developed four data dashboards, which are interactive visualisation tools summarising the financial statement data for all Victorian public hospitals. They have been grouped into the following cohorts:
- metropolitan
- regional
- rural
- small rural.
Do you need help using the dashboard? Read our dashboard instructions.
Dashboard instructions
Financial year selectionThe dashboard contains data from three financial years.
|
|
Hospital selectionYou can explore the data by selecting hospitals in the dashboards:
|
|
| To access a detailed view of each visualisation or selection tool, hover over the top right of each pane and click the ‘focus mode’ button. |
|
| To return to the dashboard from ‘focus mode’, click ‘Back to report’ at the top left of the window. |
|
| To view other indicators, use the navigation arrows at the bottom of the window. |
|
|
Or click on the number of pages to view a list of all indicators. The pages are organised as follows:
|
|
| To view the dashboard at full screen, click the ‘Full screen’ button at the bottom right of the dashboard. |
|
| To share the dashboard via email, LinkedIn, Facebook or Twitter, click the ‘Share’ button at the bottom right of the dashboard. |
|
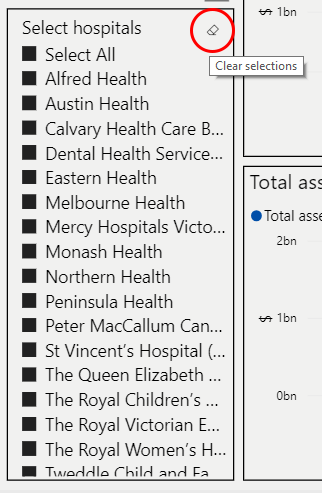

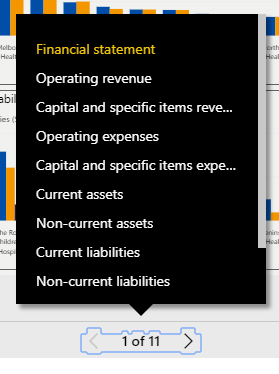


Regional Hospitals 2017–18 Dashboard
We have developed four data dashboards, which are interactive visualisation tools summarising the financial statement data for all Victorian public hospitals. They have been grouped into the following cohorts:
- metropolitan
- regional
- rural
- small rural.
Do you need help using the dashboard? Read our dashboard instructions.
Dashboard instructions
Financial year selectionThe dashboard contains data from three financial years.
|
|
Hospital selectionYou can explore the data by selecting hospitals in the dashboards:
|
|
| To access a detailed view of each visualisation or selection tool, hover over the top right of each pane and click the ‘focus mode’ button. |
|
| To return to the dashboard from ‘focus mode’, click ‘Back to report’ at the top left of the window. |
|
| To view other indicators, use the navigation arrows at the bottom of the window. |
|
|
Or click on the number of pages to view a list of all indicators. The pages are organised as follows:
|
|
| To view the dashboard at full screen, click the ‘Full screen’ button at the bottom right of the dashboard. |
|
| To share the dashboard via email, LinkedIn, Facebook or Twitter, click the ‘Share’ button at the bottom right of the dashboard. |
|
Rural Hospitals 2017–18 Dashboard
We have developed four data dashboards, which are interactive visualisation tools summarising the financial statement data for all Victorian public hospitals. They have been grouped into the following cohorts:
- metropolitan
- regional
- rural
- small rural.
Do you need help using the dashboard? Read our dashboard instructions.
<
Dashboard instructions
Financial year selectionThe dashboard contains data from three financial years.
|
|
Hospital selectionYou can explore the data by selecting hospitals in the dashboards:
|
|
| To access a detailed view of each visualisation or selection tool, hover over the top right of each pane and click the ‘focus mode’ button. |
|
| To return to the dashboard from ‘focus mode’, click ‘Back to report’ at the top left of the window. |
|
| To view other indicators, use the navigation arrows at the bottom of the window. |
|
|
Or click on the number of pages to view a list of all indicators. The pages are organised as follows:
|
|
| To view the dashboard at full screen, click the ‘Full screen’ button at the bottom right of the dashboard. |
|
| To share the dashboard via email, LinkedIn, Facebook or Twitter, click the ‘Share’ button at the bottom right of the dashboard. |
|
Small Rural Hospitals 2017–18 Dashboard
We have developed four data dashboards, which are interactive visualisation tools summarising the financial statement data for all Victorian public hospitals. They have been grouped into the following cohorts:
- metropolitan
- regional
- rural
- small rural.
Given the large number of small rural hospitals, four of the pages found in the metropolitan, regional and rural data dashboards have been further split:
- the financial statement page has been split into ‘comprehensive operating statement’ and ‘balance sheet’ pages
- the operating revenue page has been split into ‘operating revenue and government grants’ and ‘operating revenue excluding government grants’ pages
- the operating expenses page has been split into ‘operating expenses and employee expenses’ and ‘operating expenses excluding employee expenses’ pages
- the capital and specific items expenses page has been split into ‘capital and specific items expenses and depreciation & amortisation’ and ‘capital and specific items and expenses excluding depreciation & amortisation’.
Do you need help using the dashboard? Read our dashboard instructions.
Dashboard instructions
Financial year selectionThe dashboard contains data from three financial years.
|
|
Hospital selectionYou can explore the data by selecting hospitals in the dashboards:
|
|
| To access a detailed view of each visualisation or selection tool, hover over the top right of each pane and click the ‘focus mode’ button. |
|
| To return to the dashboard from ‘focus mode’, click ‘Back to report’ at the top left of the window. |
|
| To view other indicators, use the navigation arrows at the bottom of the window. |
|
|
Or click on the number of pages to view a list of all indicators. The pages are organised as follows:
|
|
| To view the dashboard at full screen, click the ‘Full screen’ button at the bottom right of the dashboard. |
|
| To share the dashboard via email, LinkedIn, Facebook or Twitter, click the ‘Share’ button at the bottom right of the dashboard. |
|

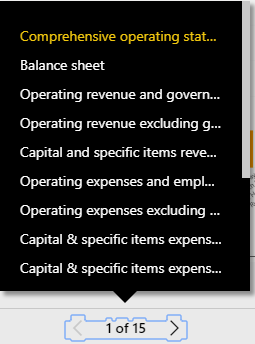
Water Entities 2017–18 Dashboard
Our dashboard is an interactive visualisation tool summarising the financial statement data for all Victorian water entities.
Water entities provide a range of water distribution and sewage disposal services, including supplying water and sewerage services, managing bulk water storage and looking after specific recreational areas, such as caravan parks.
There are 19 water entities in Victoria, each operating as a standalone business with its own board and responsibility for its own management and performance. The board of each water entity reports to the Minister for Water through the Department of Environment, Land, Water and Planning.
Based on their common characteristics, the 19 water entities are split into three groups—Metropolitan, Regional and Rural.
Do you need help using the dashboard? Read our dashboard instructions.
Dashboard instructions
| Instructions for specific pages | |
|
Water entities map page This page shows the approximate boundaries of water entities. Select an entity group (i.e. Metropolitan / Regional urban / Rural) to display the relevant map. Note: This page only displays the approximate boundaries of water entities. This page is not linked to selections made in other pages. |
|
|
Financial summary page This page summarises results for the main components of financial statements. You can filter the data by period (financial year), entity or entity group (please follow relevant instructions below). Note: If you have selected multiple entities or entity groups, the charts will aggregate your selection results and show a single total value for your selection. |
|
|
Data analysis page This page allows you to visualise up to two charts. |
|
|
|
|
|
|
|
|
|
| General instructions for all pages | |
|
Period (financial year) selection To filter data from a particular period, click the downward arrow to expand the selection list and select the period you want to view. Note: The selection on this filter will only apply to the visualisations on that page. |
|
|
Entity or entity group selection You can explore the data by selecting water entities / entity groups in the dashboards. You may need to click on the arrow to expand or collapse the selection list (circled in red in the picture).
Note: Selections made on this filter will only be applied to all visualisations on the page being viewed, not other pages. |
|
| To navigate between pages in the dashboard, use one of the following methods: | |
|
|
|
|
|
|
| The dashboard is easiest to navigate in the full screen view. Click the button at the bottom left of the window. | |
| To access a detailed view of each chart, hover over the chart and click the ‘Focus Mode’ button at the top right of the window. |
|
| To return to the dashboard from ‘Focus Mode’, click ‘Back to Report’ at the top left of the window. |
|
| To share the link to the dashboard via email, LinkedIn, Facebook or Twitter, click the ‘Share’ button at the bottom left of the window. |
|