Fair Presentation of Service Delivery Performance 2023
Overview
What we examined
We examined whether the public sector fairly presents its service delivery performance information.
We assessed 10 Victorian Government departments’ performance statements in the Department of Treasury and Finance’s (DTF) Budget Paper No. 3: Service Delivery (BP3) against the mandatory requirements and better practice guidance of DTF’s Resource Management Framework (RMF).
We focused on 120 new performance measures across all departments and the Department of Energy, Environment, and Climate Action’s (DEECA) presentation of environmental sustainability information.
Why this is important
The government spends public money to deliver goods and services to Victorians and uses performance information to inform its decisions.
Departments need to fairly report the delivery of their services so that Parliament and the community can hold them to account for their performance.
This means the reader must be able to understand and assess the government’s service delivery and have confidence in the information.
Our previous reports on government service delivery performance have found that departments have not fully met their reporting responsibilities as required by the RMF.
What we concluded
Departments continue to introduce new measures that do not meet the requirements of the RMF.
Departments also are not consistently reporting changes to their objectives, outputs and measures.
This means that performance information is not fairly presented and does not enable Parliament and the community to properly assess departments’ performance.
We found examples of inaccurate reporting and insufficient data quality controls in the information provided by DEECA. This means we cannot be assured that DEECA’s BP3 environmental sustainability reporting is accurate and reliable.
What we recommended
We recommended that:
- DTF review the RMF criteria and improve guidance to help departments better comply with RMF requirements
- DEECA review its environmental sustainability measures
- DEECA improve its data management and quality processes to improve the accuracy of its BP3 reporting.
Video presentation
Key findings

Source: VAGO
Our recommendations
| Recommendations | Agency response(s) | |||||
|---|---|---|---|---|---|---|
|
Department of Treasury and Finance |
1 |
Review the better practice performance measure criteria in the Resource Management Framework (referred to as the ACCURATE criteria) and consider:
departments to consistently apply the criteria
(See Section 2). |
Accepted in principle |
|||
|
2 |
Include detailed guidance on service delivery mapping (of inputs, activities and outputs) in the Resource Management Framework to assist departments to develop appropriate output-based performance measures (see Section 2). |
Accepted |
||||
|
3 |
Provide departments training and support to develop output-based performance measures that comply with the Resource Management Framework (see Section 2). |
Accepted |
||||
|
4 |
Include standard wording in the Resource Management Framework for departments to use when reporting changes to their objectives or outputs (see Section 2). |
Accepted |
||||
|
Department of Energy, Environment and Climate Action
|
5 |
Review its environmental sustainability measures to ensure they meet the requirements of the Resource Management Framework and fairly present the performance of the department. This includes more clearly presenting its direct service delivery performance in relation to delivery partners (see Section 3). |
Accepted in principle |
|||
|
6 |
Review current data quality management practices across Budget Paper No. 3: Service Delivery reporting to meet the Victorian Data Quality Standard and implement any additional data quality controls required to improve data accuracy (see Section 3). |
Accepted |
||||
|
7 |
Ensure that performance reporting records are kept in a manner that allows for independent verification. This should include (at minimum):
(See Section 3). |
Accepted |
||||
1. A framework for service delivery performance
Every year VAGO assesses whether Victorian government departments are fairly presenting their service delivery performance in Budget Paper No. 3: Service Delivery (BP3). Departments develop this information using guidance provided by Victoria’s Resource Management Framework (RMF) and in consultation with the Department of Treasury and Finance (DTF).
Department names
In January 2023, machinery-of-government changes affected some departments.
In this report we use old department names when referring to data from the past (for example, in BP3 2022–23) and current department names when referring to 2023–24 data.
Departments report on service delivery performance through BP3
Why service delivery performance is important
Each year as part of the state budget, Victorian government departments report their service delivery performance in BP3’s departmental performance statements. This is a requirement of the Financial Management Act 1994 (FMA). DTF coordinates this process on behalf of the Treasurer.
In their performance statements, departments specify the government-funded goods and services (outputs) they will provide for that budget year. Each output is supported by associated performance measures and targets. BP3 is presented in such a way that the reader can see how the outputs delivered by departments support the objectives that department is aiming to achieve.
In 2023–24, the total expected output cost for all Victorian government departments is $71.9 billion.
Service delivery performance information should reflect outputs
A department’s performance statement in BP3 outlines its objectives, outputs, performance measures, targets for the upcoming financial year and actual results from the previous financial year. Readers should be able to use this information to understand what the department intends to achieve (its objectives) with the outputs it delivers.
This means that performance information in BP3 should reflect the provision of goods and services and not the inputs or processes used to create them or the outcomes of service provision.
Figure 1: Service delivery map
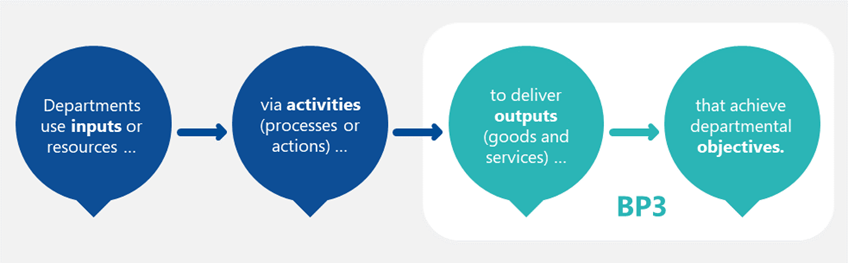
Source: VAGO
Outputs should have a meaningful mix of measures
The RMF requires the accountable officer (in most cases, the secretary of the department) to ensure each output has a meaningful mix of performance measures that can provide an assessment of the department’s service efficiency and effectiveness.
This means that most outputs should have some quantity, quality and timeliness measures, together with a measure of total output cost.
Departments’ funding is based on output performance
Each department submits an invoice to DTF at the end of the financial year to support the release of funding for the services that department has delivered. This process is known as revenue certification. The Treasurer, advised by DTF, releases this funding (known as appropriation revenue) to departments based on their success in delivering their outputs and meeting their BP3 performance targets.
Publishing non-output performance information
Each department also publishes performance information in its annual report. This can include information that does not directly relate to outputs – for example, internal departmental processes and staff metrics. Departments can also publish performance information on their departmental websites.
DTF helps departments develop their performance information
DTF guides departmental performance reporting
DTF manages and implements the RMF. This describes to departments the requirements for developing service delivery performance information. It gives a mix of mandatory requirements, supplementary requirements and guidance for departments.
Departments develop their new performance measures as part of the annual budget process. An important part of DTF’s oversight role is ensuring departments comply with any mandatory requirements of the RMF throughout this process.
A department’s secretary, as the accountable officer, is responsible for delivering the outputs outlined in BP3 to the agreed standard. The secretary must also ensure the departmental performance statements are endorsed by the relevant minister(s) before submission to DTF during the budget process.
Updates to the RMF
DTF has updated the RMF since our last report. These updates include:
- providing guidance on government objectives and priorities (in response to our 2021 Measuring and Reporting on Service Delivery report)
- including a requirement that DTF can request data and methodology underpinning departments’ performance measures (in response to our 2021 Measuring and Reporting on Service Delivery report)
- providing additional guidance to departments on how to explain why they have discontinued output performance measures.
PAEC reviews changes to output performance measures
Parliament’s Public Accounts and Estimates Committee (PAEC) reviews changes departments make to their output performance measures. This includes new measures departments have introduced and their proposals to discontinue measures.
PAEC publishes the results and recommendations from its review. In some cases, PAEC highlights issues it finds with the department’s proposed changes to measures. It can also make recommendations for new measures related to certain investments or initiatives.
Parliament also publishes the government’s response to PAEC’s recommendations.
Funding for objectives, not outcomes
DTF’s departmental funding model, as described in the RMF, is based on funded outputs that are aligned to a department’s objectives. The RMF does not refer to the role of outcomes in service delivery. The Department of Premier and Cabinet’s (DPC) Outcomes Reform in Victoria, however, highlights the importance of outcomes in driving public sector effort.
In our 2021 Measuring and Reporting on Service Delivery report we recommended that DTF and DPC integrate these policies to support more coherent and cohesive departmental performance reporting. This is due for completion in June 2024.
Service delivery performance information must be fairly presented
What fair presentation means
We created a framework based on the RMF to inform our annual assessments of whether the information is presented fairly. This aligns with the ACCURATE better practice criteria included in the Attachment to the RMF. Appendix D in this report explains the rationale for our assessment of each step in the framework.
Service delivery performance information is fairly presented when it:
- represents what it says it represents
- is capable of measurement
- is accurate, reliable and auditable.
How we assess fair presentation
|
To assess whether performance information … |
We determined whether … |
|---|---|
|
Represents what it says it represents |
|
|
Is capable of measurement |
|
|
Is accurate, reliable and auditable |
|
Previous VAGO reviews have recommended improvements to fair presentation
This is our second limited assurance review in a series that will assess the way departments present their output performance. This report builds on our previous reports:
- Measuring and Reporting on Service Delivery (our 2021 report). This report included 11 recommendations to improve fair presentation of performance information.
- Fair Presentation of Service Delivery Performance 2022. This was the first of an annual series of reviews and included 3 recommendations to DTF to assist departments in reporting their service delivery performance.
Our online dashboard enables assessment of departments’ performance
About our dashboard
We have developed an online dashboard to allow users to easily access and analyse historical BP3 performance results. You can use our fair presentation of service delivery performance dashboard to:
- compare departments’ performance results against performance targets
- drill down to examine trends for individual measures over time
- export raw data on output performance measures.
We updated the dashboard in November 2023 to include departments’ most current output performance information.
DTF is developing a dashboard
DTF told us it is developing options for an output performance dashboard. It aims to publish this dashboard in 2024, subject to the government’s consideration.
2. Assessing the fair presentation of departmental performance statements
In this section we show the results of our assessment of new performance measures using the framework outlined in Section 1. We also summarise the changes that departments have made to their objectives and outputs since BP3 2022–23.
BP3 2023–24 measures
Departments have a total of 1,353 performance measures in 2023–24.
We focused our assessment on changes to departments’ performance statements since 2022–23. This means we assessed the 120 new performance measures introduced in 2023–24 and all discontinued measures, as well as changes to objectives and outputs.
Changes to performance measures are not consistent with the RMF
There are 120 new and 134 discontinued measures
In 2023–24, departments introduced a total of 120 new performance measures. Appendix G shows the number of new performance measures for each department by measure attribute (quality, quantity or timeliness).
Departments have proposed to discontinue 134 measures for 2023–24. Appendix H shows the number of proposed discontinued measures for each department by measure attribute.
Most new measures are quantity measures
We recorded the attribute of each of the 120 new performance measures as reported in BP3.
Figure 2: Number of new performance measures by attribute (2023–24)
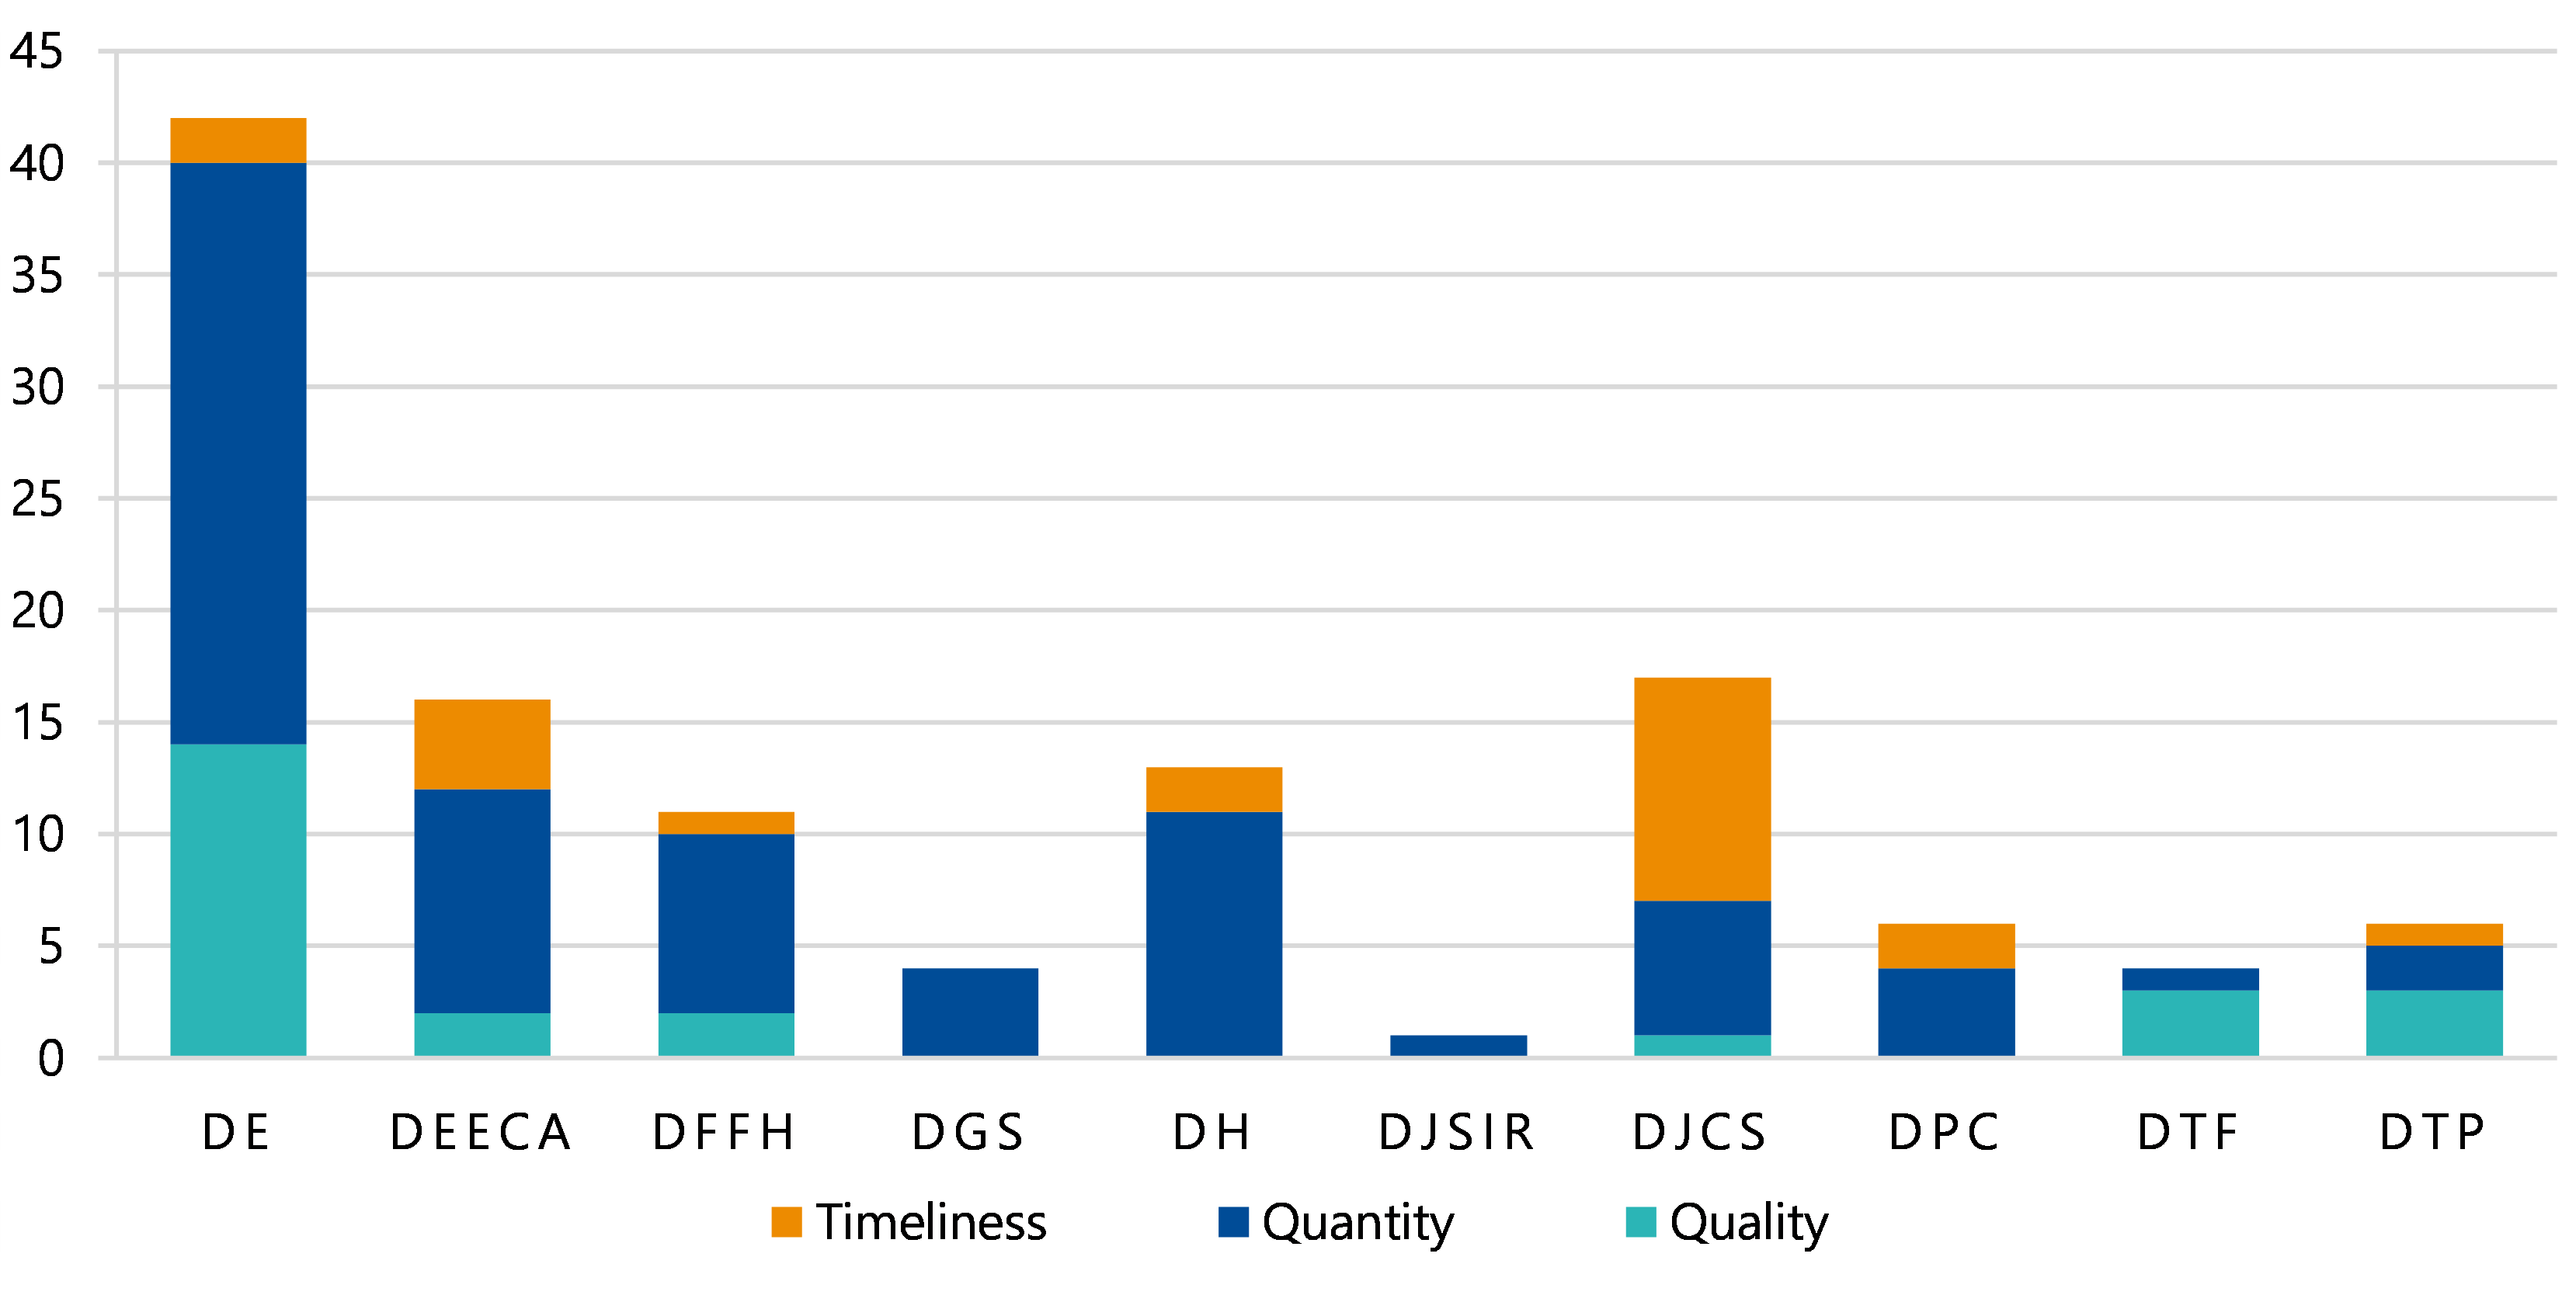
Note: DE= Department of Education, DEECA = Department of Energy, Environment and Climate Action, DFFH = Department of Families, Fairness and Housing, DGS = Department of Government Services, DH = Department of Health, DJSIR = Department of Jobs, Skills, Industry and Regions, DJCS = Department of Justice and Community Safety, DPC = Department of Premier and Cabinet, DTF = Department of Treasury and Finance, DTP = Department of Transport and Planning.
Source: VAGO analysis of DTF’s BP3 2023–24.
Most new performance measures (61 per cent) were of the quantity of goods or services delivered. In 2023–24, departments introduced 22 timeliness measures, representing 18 per cent of all new measures.
Departments are required to review their outputs and performance measures each year to ensure the information remains relevant. The Department of Education (DE) introduced 42 new measures in 2023–24 alongside revisions to its objective and output group structure.
67 per cent of outputs have quantity, quality, timeliness and cost measures
In 2023–24, 67 per cent of outputs had a mix of performance measures across 4 attributes.
|
Departments that include measures across 4 attributes for all outputs |
Departments that include measures covering only 2 attributes (cost and one other) for some outputs |
|---|---|
|
|
DE does not have any outputs with measures of all 4 attributes.
The RMF requires each output to have a good balance of measures to give the reader a clear picture of what a department is trying to achieve and how it is performing.
58 per cent of departments’ new measures relate to outputs
We classified each of the 120 new performance measures introduced in 2023–24 as a measure of input, process (activity), output or outcome (as explained in Figure 1).
|
We found … |
Were measures of … |
And should be reported … |
|---|---|---|
|
58 per cent |
outputs |
in BP3. |
|
42 per cent |
inputs, processes or outcomes |
in the department’s annual report or internal reporting systems. |
The inclusion of input, process and outcomes measures does not meet the RMF’s requirement to measure output performance, which is the key accountability mechanism of the state’s funding model.
The RMF refers to inputs, processes and outputs, but does not clearly define these terms. For other performance measure characteristics discussed in this report, the RMF provides detailed information and checklists for departments to develop better practice measures. Despite the department funding model being based on outputs, there is no detailed information in the RMF about how departments should classify their inputs, processes and outputs.
44 per cent of new measures are not useful
We assessed whether new performance measures are useful. This means they can inform strategic decision-making about government resource allocation or give stakeholders a clear understanding of the goods and services the department is delivering.
|
Of the 120 new performance measures … |
While the remaining… |
|---|---|
|
56 per cent would:
|
44 per cent are not useful to inform high-level government decision-making or do not provide an understanding of the department’s service delivery. This is often because the measures relate to inputs, processes or outcomes and not outputs. |
Many of the performance measures that do not meet our criteria may be useful for other reasons, such as internally monitoring performance.
56 per cent of new measures are directly attributable
We assessed whether new performance measures are attributable. This means departments must have some kind of control over their service delivery by either directly providing the goods and services or being responsible for the performance.
|
Of the 120 new performance measures … |
While the remaining … |
|---|---|
|
56 per cent were:
|
44 per cent were partly attributable. These measures remain within the responsibility, or reflect actions, of the department, but external factors (such as demand for services or user behaviour) may influence performance results. The RMF allows for this. |
73 per cent of new measures are relevant
We assessed whether new performance measures are relevant. This means that measures align with their associated output and departmental objective.
|
Of the 120 new performance measures … |
While the remaining… |
|---|---|
|
73 per cent align with the output and the departmental objective |
27 per cent do not clearly indicate how achieving the target will assist the department to achieve its objective. |
When measures do not align with departmental objectives it can be difficult for the reader to determine how a department will achieve what it intends.
73 per cent of new measures are clear
We assessed whether new performance measures are clear. This means measures are written with clear, concise and non-technical language and what is being measured is not ambiguous.
|
Of the 120 new performance measures … |
While the remaining… |
|---|---|
|
73 per cent were written clearly and demonstrated what is being measured |
27 per cent:
|
The RMF states that output descriptions should refer to the targeted beneficiary of the goods or services. However, there is no similar requirement for performance measures to do this.
While we assessed most new measures to be clear against the requirements of the RMF, we found that measures can be unclear about who will receive the service or who will deliver the services. This means the reader cannot fully understand what the measure represents in terms of the services delivered.
Just under half the new measures enable comparison
over time
We assessed whether new performance measures can help compare a department’s performance over time.
|
Of the 120 new performance measures … |
While the remaining… |
|---|---|
|
49 per cent allow for comparison of performance over time |
51 per cent cannot show performance compared with changes in population size or demand for services. |
Many of the measures we assessed as not comparable are quantity measures. These can provide a volume of the goods or services provided. However, they cannot provide an assessment of performance in relation to changes in the target population size or demand for those services. For these measures, contextual information not included in BP3 is often needed for the reader to compare a department’s performance over time.
There are no new efficiency measures
Departments did not introduce any measures of efficiency of service delivery in 2023–24. In our 2021 report we highlighted the absence of cost efficiency measures in department’s performance statements.
DTF accepted our recommendation to improve guidance material in the RMF to help departments develop cost efficiency measures. DTF committed to updating the RMF by June 2023. At the time of writing this report, the update is yet to occur.
Departments want more guidance from DTF to develop new measures
Departments told us there is currently no advice on the cost threshold for introducing new measures.
Based on information from DTF, departments do not have a clear understanding of when to develop a new measure or align a new initiative to an existing measure.
There are 134 measures proposed to be discontinued
Departments proposed to discontinue 134 measures in 2023–24. The RMF provides guidance to departments on when to discontinue a measure, as well as standard wording they should include in BP3’s Appendix A to explain this change. We examined departments’ reasons for proposing to discontinue performance measures. These included that:
- old measures were being replaced with new ones (46 measures)
- program funding had ended (8 measures)
- project milestones had been met (8 measures).
Departments did not provide explanations for 14 of the measures proposed to be discontinued.
Two departments proposed to discontinue a measure each, but these were not included in BP3’s Appendix A. PAEC’s review of proposed discontinued measures for these departments was based on information provided separately to PAEC.
19 per cent of measures discontinued within a year
In 2022–23, 110 new measures were introduced in BP3. Of these, 21 were proposed to be discontinued in 2023–24. This means 19 per cent of new measures introduced in 2022–23 were active BP3 measures for just one year.
The RMF states that performance measures should remain consistent over time to enable comparison of performance. Continuous or unexplained changes within performance statements mean the reader cannot accurately assess performance year on year.
PAEC found issues with 15 discontinued measures
Departmental proposals to discontinue performance measures are subject to review by PAEC. PAEC released its 2023–24 Budget Estimates report on 3 October 2023. PAEC supported most of the proposals to discontinue measures in 2023–24 but raised issues about 15 (or 11 per cent).
These included instances where discontinuing a measure would result in a gap in service delivery reporting or where PAEC considered it important that the department continue to report on specific programs or services.
Appendix H shows how many performance measures each department proposed to discontinue and how many PAEC had issues with.
Changes to departments’ objectives and outputs are not consistently explained
Departments can change objectives in some circumstances
Departmental objectives are the results that departments hope to achieve. Objectives are designed to show progress over time, so departments should not change them each year.
The RMF allows departments to make changes to objectives to reflect machinery-of-government changes or changes to the government’s strategic direction. The RMF requires any changes to a department’s objectives in BP3 to be accompanied by an explanation.
Changes to some objectives have not been explained
Since BP3 2022–23, all departments have changed their objectives in some way, except the Department of Government Services (DGS). As a newly created department, it could not report changes since the previous year, but it did introduce 3 new objectives for 2023–24.
Many changes reflect the machinery-of-government changes that took effect from January 2023.
Departments reported these changes in different ways. Only 4 departments provided sufficient commentary to explain all changes to their objectives. Five departments did not. This includes:
- providing no explanation (4 departments)
- providing explanations for some changes but not others (one department).
Appendix E shows the changes to departmental objectives since BP3 2022–23.
Departments review their outputs each year
Departments review their outputs each year to ensure they remain relevant. They can change their output structure as part of the budget process. The RMF provides that departments should consider how any changes to their outputs will affect the comparability of performance over time. There is no guidance in the RMF for how departments should explain changes to their output structures.
Departments did not consistently report output changes
In BP3 2023–24, 9 departments made changes to their outputs. DFFH was the only department that did not make any changes.
Most output changes reflected machinery-of-government changes. These included:
- 15 outputs transferred between departments
- 4 outputs split into new outputs across various departments.
Seven departments also renamed outputs, disaggregated outputs or combined outputs. These changes impacted a total of 16 outputs from 2022–23.
We found that these changes were not consistently reported across departments. For example:
- DTF listed all machinery-of-government output changes across all departments in an introductory table in BP3
- some departments duplicated DTF’s information in their individual performance statements, while others did not
- some departments reported the department from which the output was transferred from, while others did not.
Where this volume of change occurs, it is important that the changes are consistently and clearly reported.
Appendix F shows the changes that departments made to outputs from 2022–23 to 2023–24 and the reasons for those changes.
Comparing how departments collect and store their performance information
Most departments collect and store BP3 data
We asked departments if they collect and store the data they use to calculate their BP3 performance results. Departments provided responses for 1,227 measures reported in BP3 2023 24 (excluding output cost measures).
Departments collect and store the majority of the data they use to calculate their BP3 results:
|
For … |
Of BP3 2023–24 measures, departments … |
|---|---|
|
71 per cent |
collect the data used to calculate and report the result. |
|
74 per cent |
store the data used to calculate and report the result. |
We found that departments collect their data for BP3 reporting through a decentralised model. This means that individual groups across the department collect or manage the collection of data (through external agencies or entities) for individual BP3 measures. Groups report results to a centralised reporting unit, which collates the data for BP3 reporting.
In a decentralised model it is essential that departments have robust and consistently applied data management practices. This will allow confidence in the accuracy of their data across all BP3 measures.
Departments use a range of information to calculate BP3 results
We asked departments about the format of their BP3 data. Departments reported that the raw data used to calculate the results reported in BP3 comes in a variety of formats, including:
- Excel or CSV files
- Word or PDF files
- SQL databases
- bespoke databases
- Outlook calendars and meeting minutes
- online surveys
- funding agreements and invoices
- case management systems.
For 117 measures (or 10 per cent), departments reported that they did not know the format of the relevant data or they needed to do further investigation to be able to respond.
Departments report differences in the time it will take to provide BP3 data
The RMF states that information collected for performance measures needs to be transparent and there should be a clear management audit trail of data treatment, calculation and reporting.
Departments must also make the data and methodology underpinning BP3 performance measures available on request to DTF. This is a new requirement of the RMF, implemented by DTF in response to our 2021 report.
We asked departments how long it would take to provide the raw data files for their BP3 measures on request. Figure 3 shows response times.
For most measures (68 per cent) departments stated they could provide data files in less than 2 weeks. Departments did not know, or did not provide a response, for 154 measures (13 per cent).
We found that there are variations across departments in how long it would take to provide their BP3 data. For example:
• one department stated it can provide all its data within 2 weeks
• one department would take over a month to provide it for over half of its measures.
Figure 3: Department responses to how long it would take to provide raw BP3 data files upon request
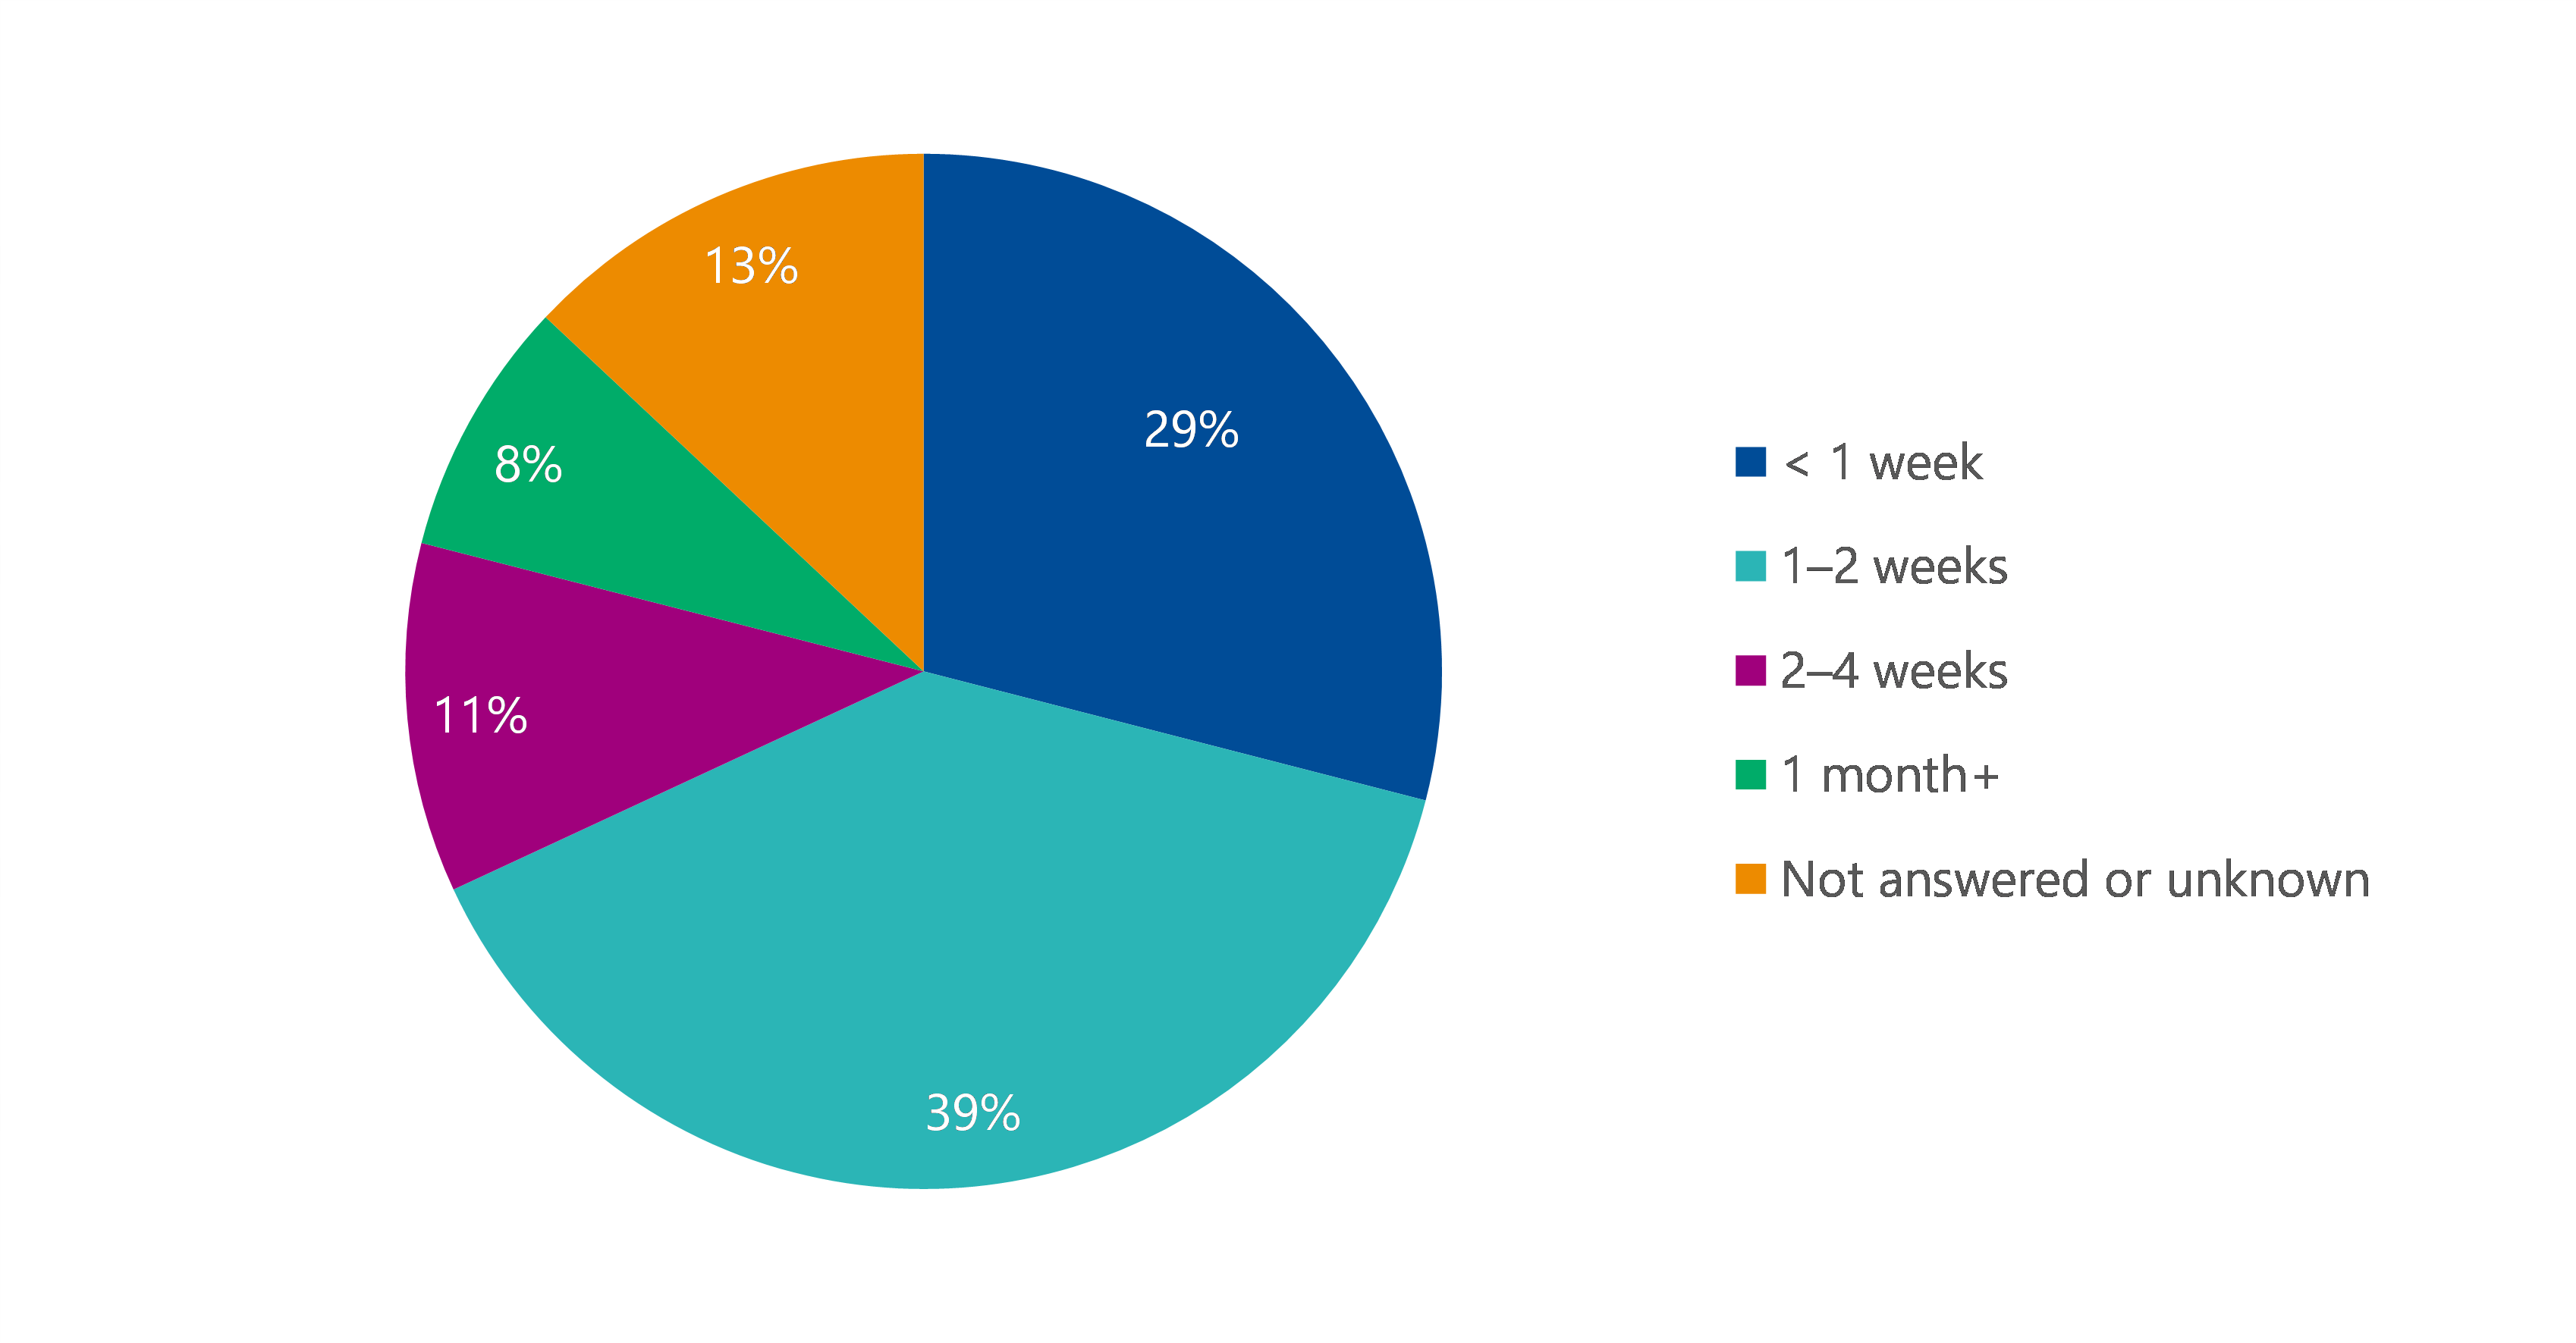
Source: VAGO analysis of departmental responses to data scoping survey.
Department’s data dictionaries update
Data dictionaries create a common understanding of data items that can be applied consistently by data suppliers. In Fair Presentation of Service Delivery Performance 2022 we found departments were at varying stages of maturity in developing BP3 data dictionaries. DTF accepted our recommendation to include information on how to develop a data dictionary in the RMF and has undertaken to add it to the RMF by June 2024.
What we found and what we recommend
What we found through our assessments
We found that most new measures introduced by departments in 2023–24 do not follow some aspects of the RMF. This finding is consistent with our previous reports.
Departments continue to introduce measures that do not reflect outputs, are not clear or do not enable an accurate comparison of performance over time. These measures do not support the fair presentation of service delivery performance. This means that Parliament and the public may find it difficult to hold departments accountable for their performance and for the use of public money.
There were significant changes to the departmental performance statements in 2023–24. These changes mainly reflect machinery-of-government changes. The inconsistent way departments reported these changes diminishes the transparency of reporting across years. It also suggests that stronger guidance and oversight is needed from DTF when developing the performance statements.
Departments have proposed to discontinue 19 per cent of measures that were in place for only one year. This volume of change and the short-term nature of these measures suggest that departments do not fully understand the requirements of the RMF to develop good performance measures.
Most departments stated that they collect and store the data to report their BP3 results. This would indicate they are well placed to meet new RMF requirements to provide this information to DTF on request. There is, however, variance across departments in how long it would take to provide this information.
Our previous reports have made a number of recommendations that departments are continuing to work through and implement. This means that some of the improvement expected from these recommendations may not have happened yet.
What we recommend regarding output performance measures
DTF is working to strengthen the state’s performance management framework. As part of this review, and in addition to our previous recommendations, we recommend that DTF:
- review the better practice performance measure criteria in the RMF (referred to as the ACCURATE criteria) and consider:
- making the criteria mandatory
- including more detailed information and examples to support departments to consistently apply the criteria
- requiring departments to make clear within the budget papers:
- which entity is delivering the service
- who the targeted beneficiary is
- providing detailed information about how departments can develop quantity measures that allow comparison of performance over time, taking into account changes in population or demand
- include detailed guidance on service delivery mapping (of inputs, activities and outputs) in the RMF to assist departments to develop appropriate output-based performance measures
- provide departments training and support to develop output-based performance measures that comply with the RMF
- include standard wording in the RMF for departments to use when reporting changes to their objectives or outputs.
3. Assessing DEECA’s reporting on environmental sustainability
We take a closer look at a different department’s performance information each year. This year we examined environmental sustainability performance reporting by DEECA for the water, energy and climate action portfolios. We also looked at the accuracy and reliability of its environmental sustainability BP3 performance results.
DELWP is now DEECA
The Department of Environment, Land, Water and Planning (DELWP) became the Department of Energy, Environment and Climate Action (DEECA) in January 2023. We refer to DEECA throughout this section for clarity and simplicity.
Defining environmental sustainability
Defining sustainability
The United Nations (UN) defines sustainability as ‘meeting the needs of the present without compromising the ability of future generations to meet their own needs’.
The UN Sustainable Development Goals (SDGs) are a set of goals aimed at addressing global challenges and creating a more sustainable future by 2030. The 17 goals, each with supporting targets and indicators, encompass a wide range of economic, social and environmental issues.
The UN SDGs provide a globally accepted framework through which countries can measure their contribution to sustainable development at a local and global level. Australia endorsed the 2030 Agenda for Sustainable Development in 2015.
How DEECA manages environmental sustainability
DEECA’s responsibilities
DEECA is the Victorian government department responsible for:
- agriculture
- climate action
- energy
- environment
- emergency management
- forestry
- resources
- water functions.
Environmental sustainability is a key focus of DEECA’s portfolio responsibilities.
DEECA aligns its reporting to the UN SDGs
In its Corporate Plan 2023–2027, DEECA has aligned its departmental outcomes to 8 of the UN SDGs. SDGs 6, 7 and 13 relate to DEECA’s water, energy and climate action portfolios.
DEECA told us that its business planning and prioritisation process requires all priority projects and services to align to the UN SDG framework. We tested the alignment of DEECA’s performance information to UN SDGs 6, 7 and 13 by assessing whether DEECA’s BP3 service delivery measures reflect the indicators that support the SDGs.
We found that there was alignment between most indicators and DEECA’s BP3 measures. This alignment was stronger in some cases than in others.
Figure 4: Examples of alignment between UN SDG indicators and DEECA’s BP3 objectives and measures
| Goal | Indicator | BP3 objective | BP3 measure/s |
|---|---|---|---|
|
Clean water and sanitation (Goal 6) |
Proportion of bodies of water with good ambient water quality |
Safe, sustainable and productive water resources |
Long-term water monitoring site parameters maintained |
|
Affordable and clean energy (Goal 7) |
Proportion of population with primary reliance on clean fuels and technology |
Reliable, sustainable and affordable energy services |
Applications for Solar PV rebates for:
|
|
Climate action (Goal 13) |
Total greenhouse gas emissions per year |
Net zero emission, climate-ready economy and community |
Completion of annual greenhouse gas emissions report Annual energy saved by Victorian schools participating in the ResourceSmart Schools program |
Source: VAGO analysis of UN SDG targets and indicators and DEECA’s BP3 2023–24 departmental performance statement.
DEECA spends 36 per cent of its output budget on climate action, energy and water services
BP3 2023–24 reports that DEECA plans to spend $972.5 million on climate action, energy and water services. This is 36 per cent of the department’s total output budget ($2.7 billion).
Figure 5: DEECA climate action, energy and water performance measures and budget (2023–24)
| Output | Output description in BP3 2023–24 | Performance measures (number) | Output cost ($m) |
|---|---|---|---|
|
Climate Action |
This output leads the development and implementation of strategic, whole-of-government climate action policy and programs that contribute to Victoria’s 2045 target of net zero greenhouse gas emissions and building the state’s resilience to climate change. |
6 |
15.7 |
|
Energy |
This output advocates for the provision of reliable, sustainable and affordable energy services through energy programs, including renewable energy development, energy efficiency and affordability improvements, and facilitation of new investment. |
12 |
289.5 |
|
Solar Victoria |
The Solar Victoria output implements multi-year programs to incentivise the uptake of solar panel energy systems and hot water systems, and interest-free loans for battery storage for homes with existing solar energy systems, as Victoria transitions to a lower emissions future, reducing fossil fuel usage and air pollution, and allowing independence from conventional energy supplies. Through this output, Solar Victoria supports investment in household energy technology innovation to find new and improved ways to meet future energy demand. |
9 |
164.2 |
|
Effective Water Management and Supply |
This output develops policies, provides strategic advice and oversees regulatory systems and institutional arrangements to effectively manage Victoria’s water resources. Through this output, the department delivers on-ground environmental programs to improve the health of waterways, water industry reform, governance and performance oversight, integrated water management, sustainable irrigation programs, and makes water resource information accessible to enable informed decision making. |
16 |
503.1 |
Source: VAGO analysis of DTF’s BP3 2023–24.
DEECA’s accounting for environmental assets
DEECA has also adopted the UN System of Environmental-Economic Accounting (SEEA) to better understand the condition of environmental assets and their impact on economic and social wellbeing. The UN SEEA is the official international framework for natural capital accounting. It seeks to integrate economic and environmental data.
DEECA most recently applied the SEEA framework to assess the economic impacts of the 2019–20 bushfires in Victoria.
The challenge of reporting on environmental sustainability
Environmental sustainability cuts across multiple portfolios
While DEECA is the lead agency for environmental sustainability, all departments have responsibility for environmental sustainability in some way. For example, Financial Reporting Direction 24, issued by DTF under the FMA, requires government departments and public sector entities to:
- report on environmental indicators (as specified by the Direction) in the organisation’s annual report
- identify and manage government exposure to climate-related risks
- promote continuous improvement in environmental reporting by government entities.
Departments also consider environmental sustainability in the delivery of their outputs and policy settings.
Environmental sustainability is embedded in all DEECA outputs
While we focused specifically on the climate action, energy and water outputs, environmental sustainability is spread across all DEECA’s outputs.
The climate action output, for example, represents specific and smaller-scale service deliverables. However, DEECA told us it embeds climate action throughout all its work streams.
Our framework for assessing DEECA’s environmental sustainability measures
VAGO’s service performance framework
The key to performance reporting is naming the intended output and developing the right measures for it. DEECA’s outputs for water, energy and climate action services reflect the department’s oversight, regulatory and coordination role rather than as a direct service provider.
Figure 6 shows the service performance framework we used to assess DEECA’s output performance reporting for 43 environmental sustainability measures.
Figure 6: Environmental sustainability performance framework

Source: VAGO.
DEECA can improve its environmental sustainability performance measures to more fairly present performance
63 per cent of DEECA’s environmental sustainability measures relate to outputs
We assessed DEECA’s water, energy and climate action performance measures listed in BP3 2023 24 against our service performance framework. We found 27 of the 43 measures (63 per cent) relate to the provision of outputs.
We classified 6 performance measures as outcome measures. These measures reflect the impact of the goods or services provided (for example, the share of Victoria’s electricity generation from renewable sources). DEECA should monitor the performance against input, process and outcome measures through reporting systems other than BP3.
Figure 7 shows our classification of measures by input, outcome, output and process.
Figure 7: Classification of DEECA’s sustainability measures
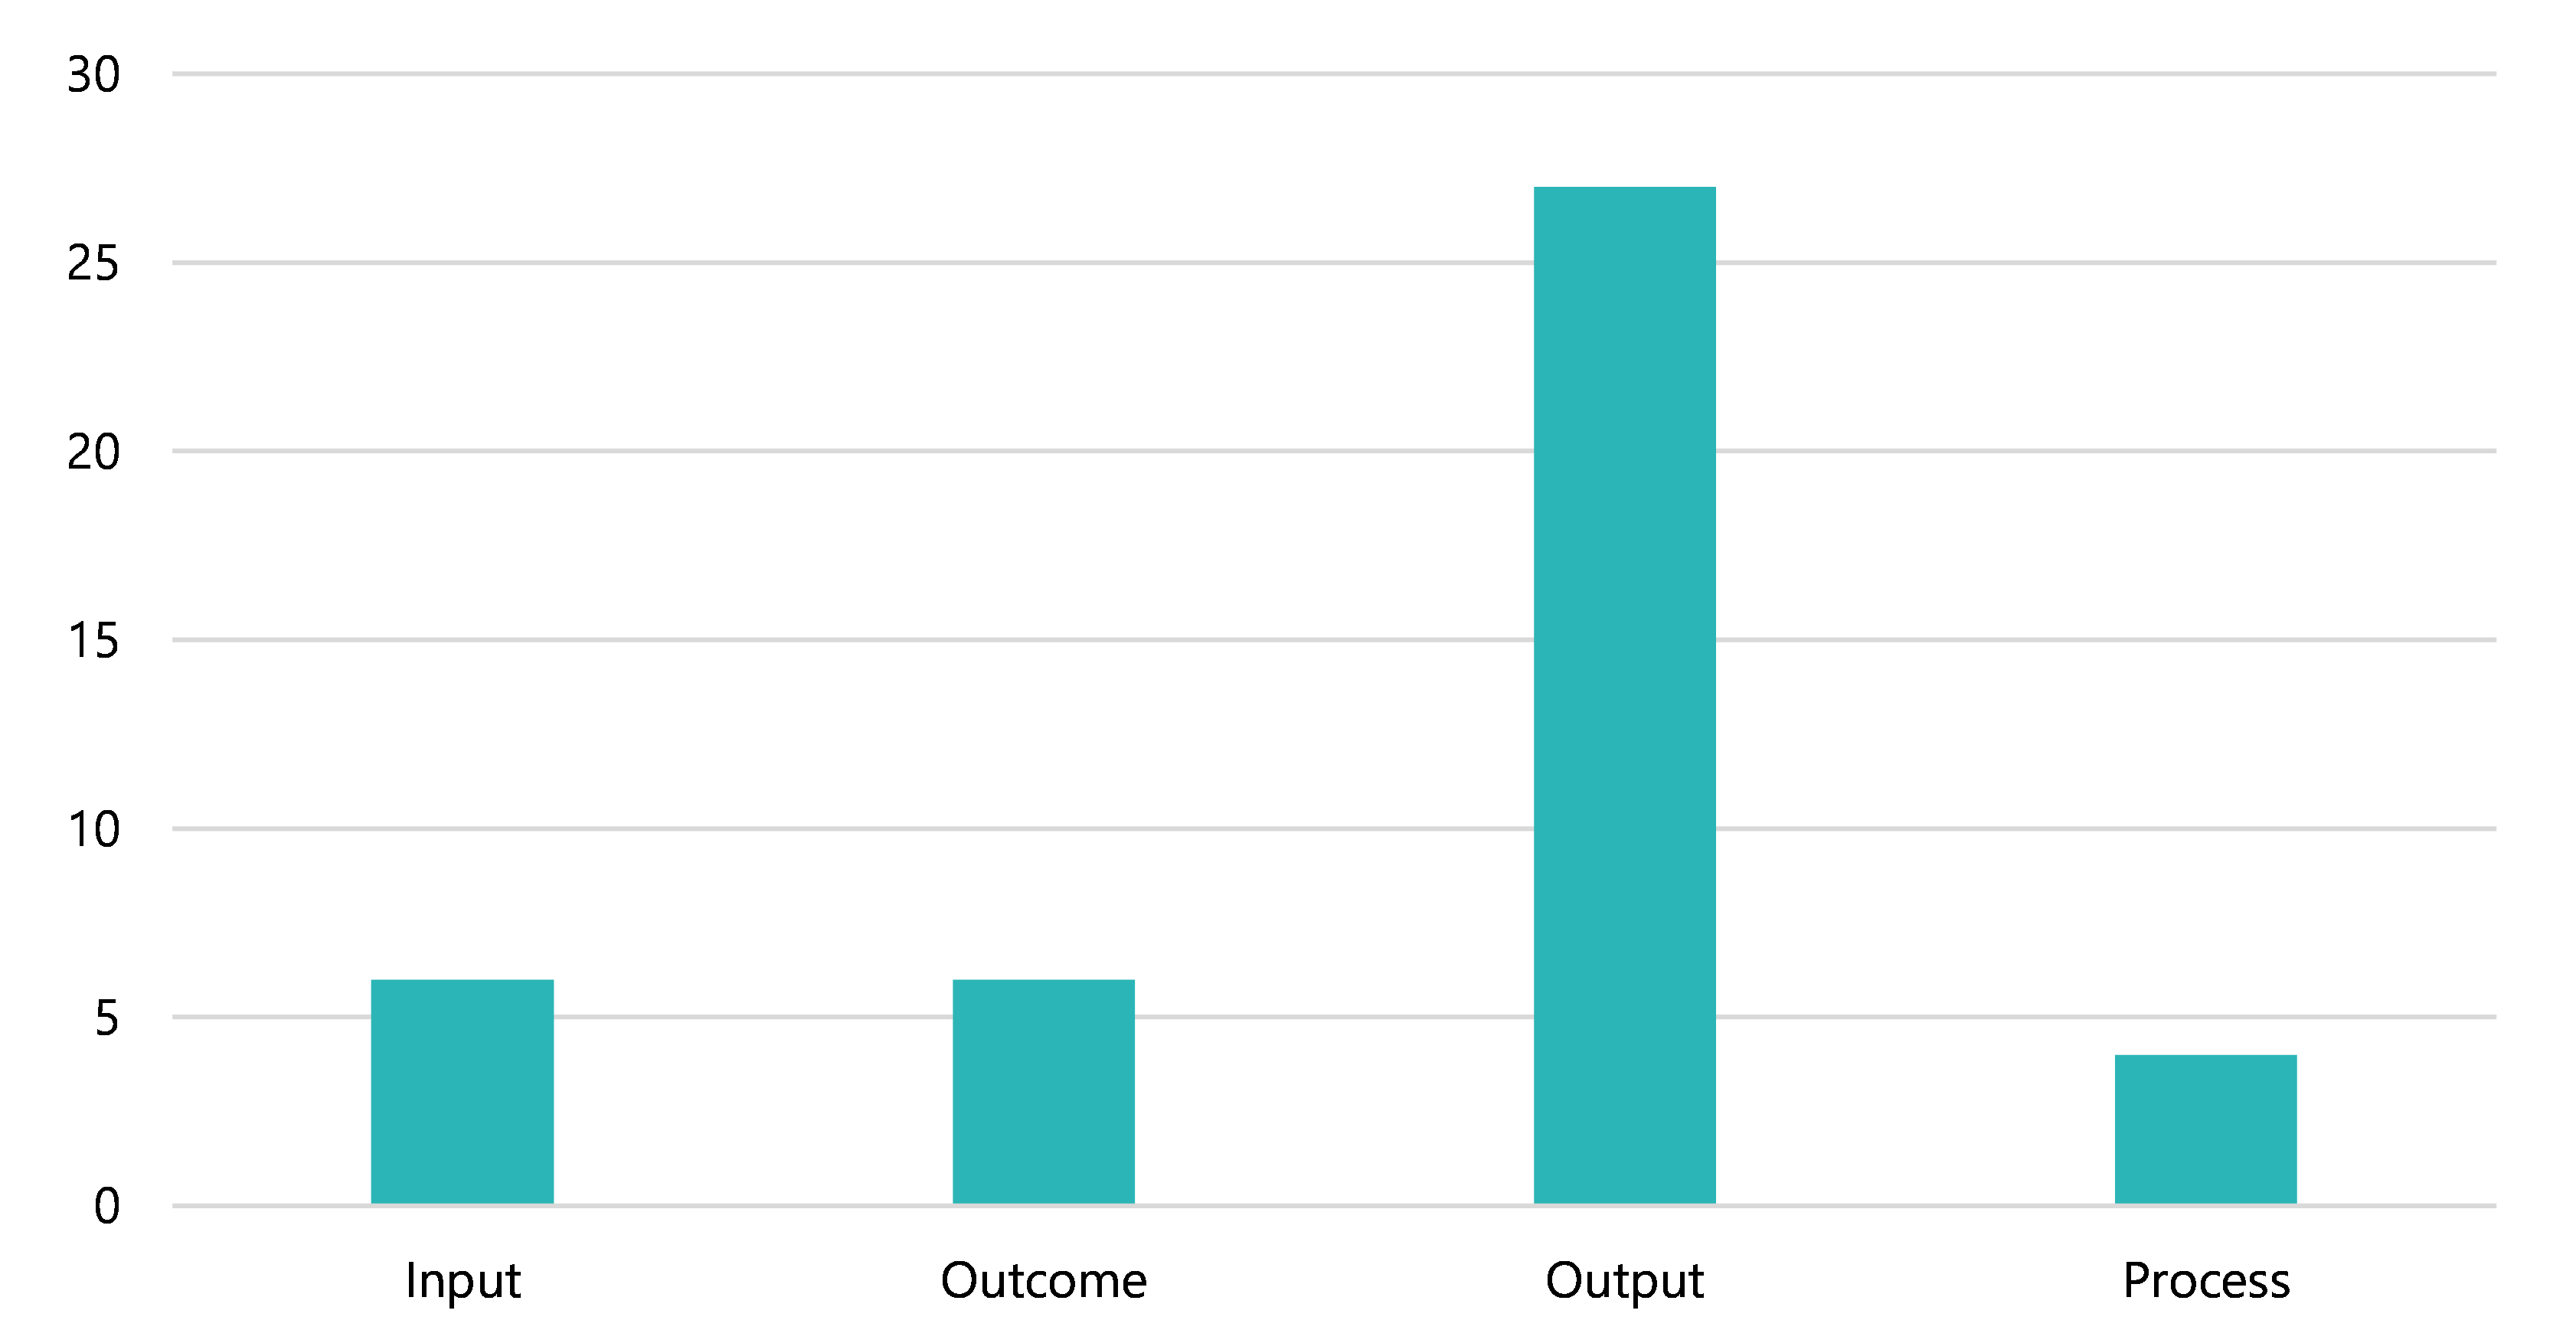
Source: VAGO.
42 per cent of measures are better suited to internal reporting
We found that only 25 (of the 43) sustainability performance measures (58 per cent) would be useful for informing government decision-making in the context of BP3 reporting.
These are some examples of DEECA’s sustainability measures that would be better suited to inform internal departmental monitoring and reporting:
|
Measures that do not help stakeholders understand service delivery (output) performance |
Measures that do not inform strategic decisions about priorities and resourcing |
|---|---|
|
Victorian schools participating in the ResourceSmart Schools program |
Delivery of agreed milestones for climate action policy, advice and research within agreed timeframes |
|
Climate and hydrology research activities underway that focus specifically on Victoria |
Rebated installations audited by the Solar Homes Audit Program to be conducted in accordance with the Solar Homes Assurance Framework plan |
72 per cent of measures are attributable
We found 31 (of the 43) environmental sustainability performance measures (72 per cent) were either directly attributable or within DEECA’s responsibility. Another 11 measures (26 per cent) were partly attributable to the department.
External forces (such as demand for services or user behaviour) may influence some of the measures assessed as partly attributable. For example:
- the annual energy saved by Victorian schools participating in the ResourceSmart Schools program can be impacted by the number of schools participating in the program
- consumer choice may influence the number of applications for solar battery loans approved.
We also found one measure (‘New Energy Jobs Fund projects completed’) where performance is not attributable to DEECA.
95 per cent of measures are relevant
We found 41 environmental sustainability performance measures (95 per cent) aligned with outputs or departmental objectives. This is significantly higher than what we found for all new measures introduced in 2023–24 (73 per cent).
Most measures are clearly written
When departments use technical terms or do not explain what is being measured, we consider those performance measures unclear.
We found that 34 of the sustainability performance measures (79 per cent) were clearly written. However, we found 9 measures (21 per cent) were not clear.
DEECA has already indicated that it will review some of these measures for clarity. These include:
- delivery of agreed milestones for climate action policy, advice and research within agreed timeframes
- compliance with the salinity management actions agreed in the Murray–Darling Basin Agreement.
53 per cent of measures are comparable over time
We found only 53 per cent of environmental sustainability measures (23 measures) can be used to compare results over time. All other measures did not allow comparison of performance in relation to changes in population or demand. For example, results for the measure of applications for solar battery loans approved depends on the demand for this technology, which may change year to year.
There is an imbalance of quantity, quality and timeliness measures
DEECA has an imbalance of quantity, quality and timeliness measures across the water, energy and climate outputs. Twenty-six (or 60 per cent) of the 43 measures are measures of quantity, with only 6 quality measures and 7 timeliness measures. This means there are far fewer measures that give the reader an overview of the quality of DEECA’s service delivery and whether it delivers services within agreed timeframes.
Figure 8: Mix of cost, quality, quantity and timeliness measures for DEECA in BP3 2023–24
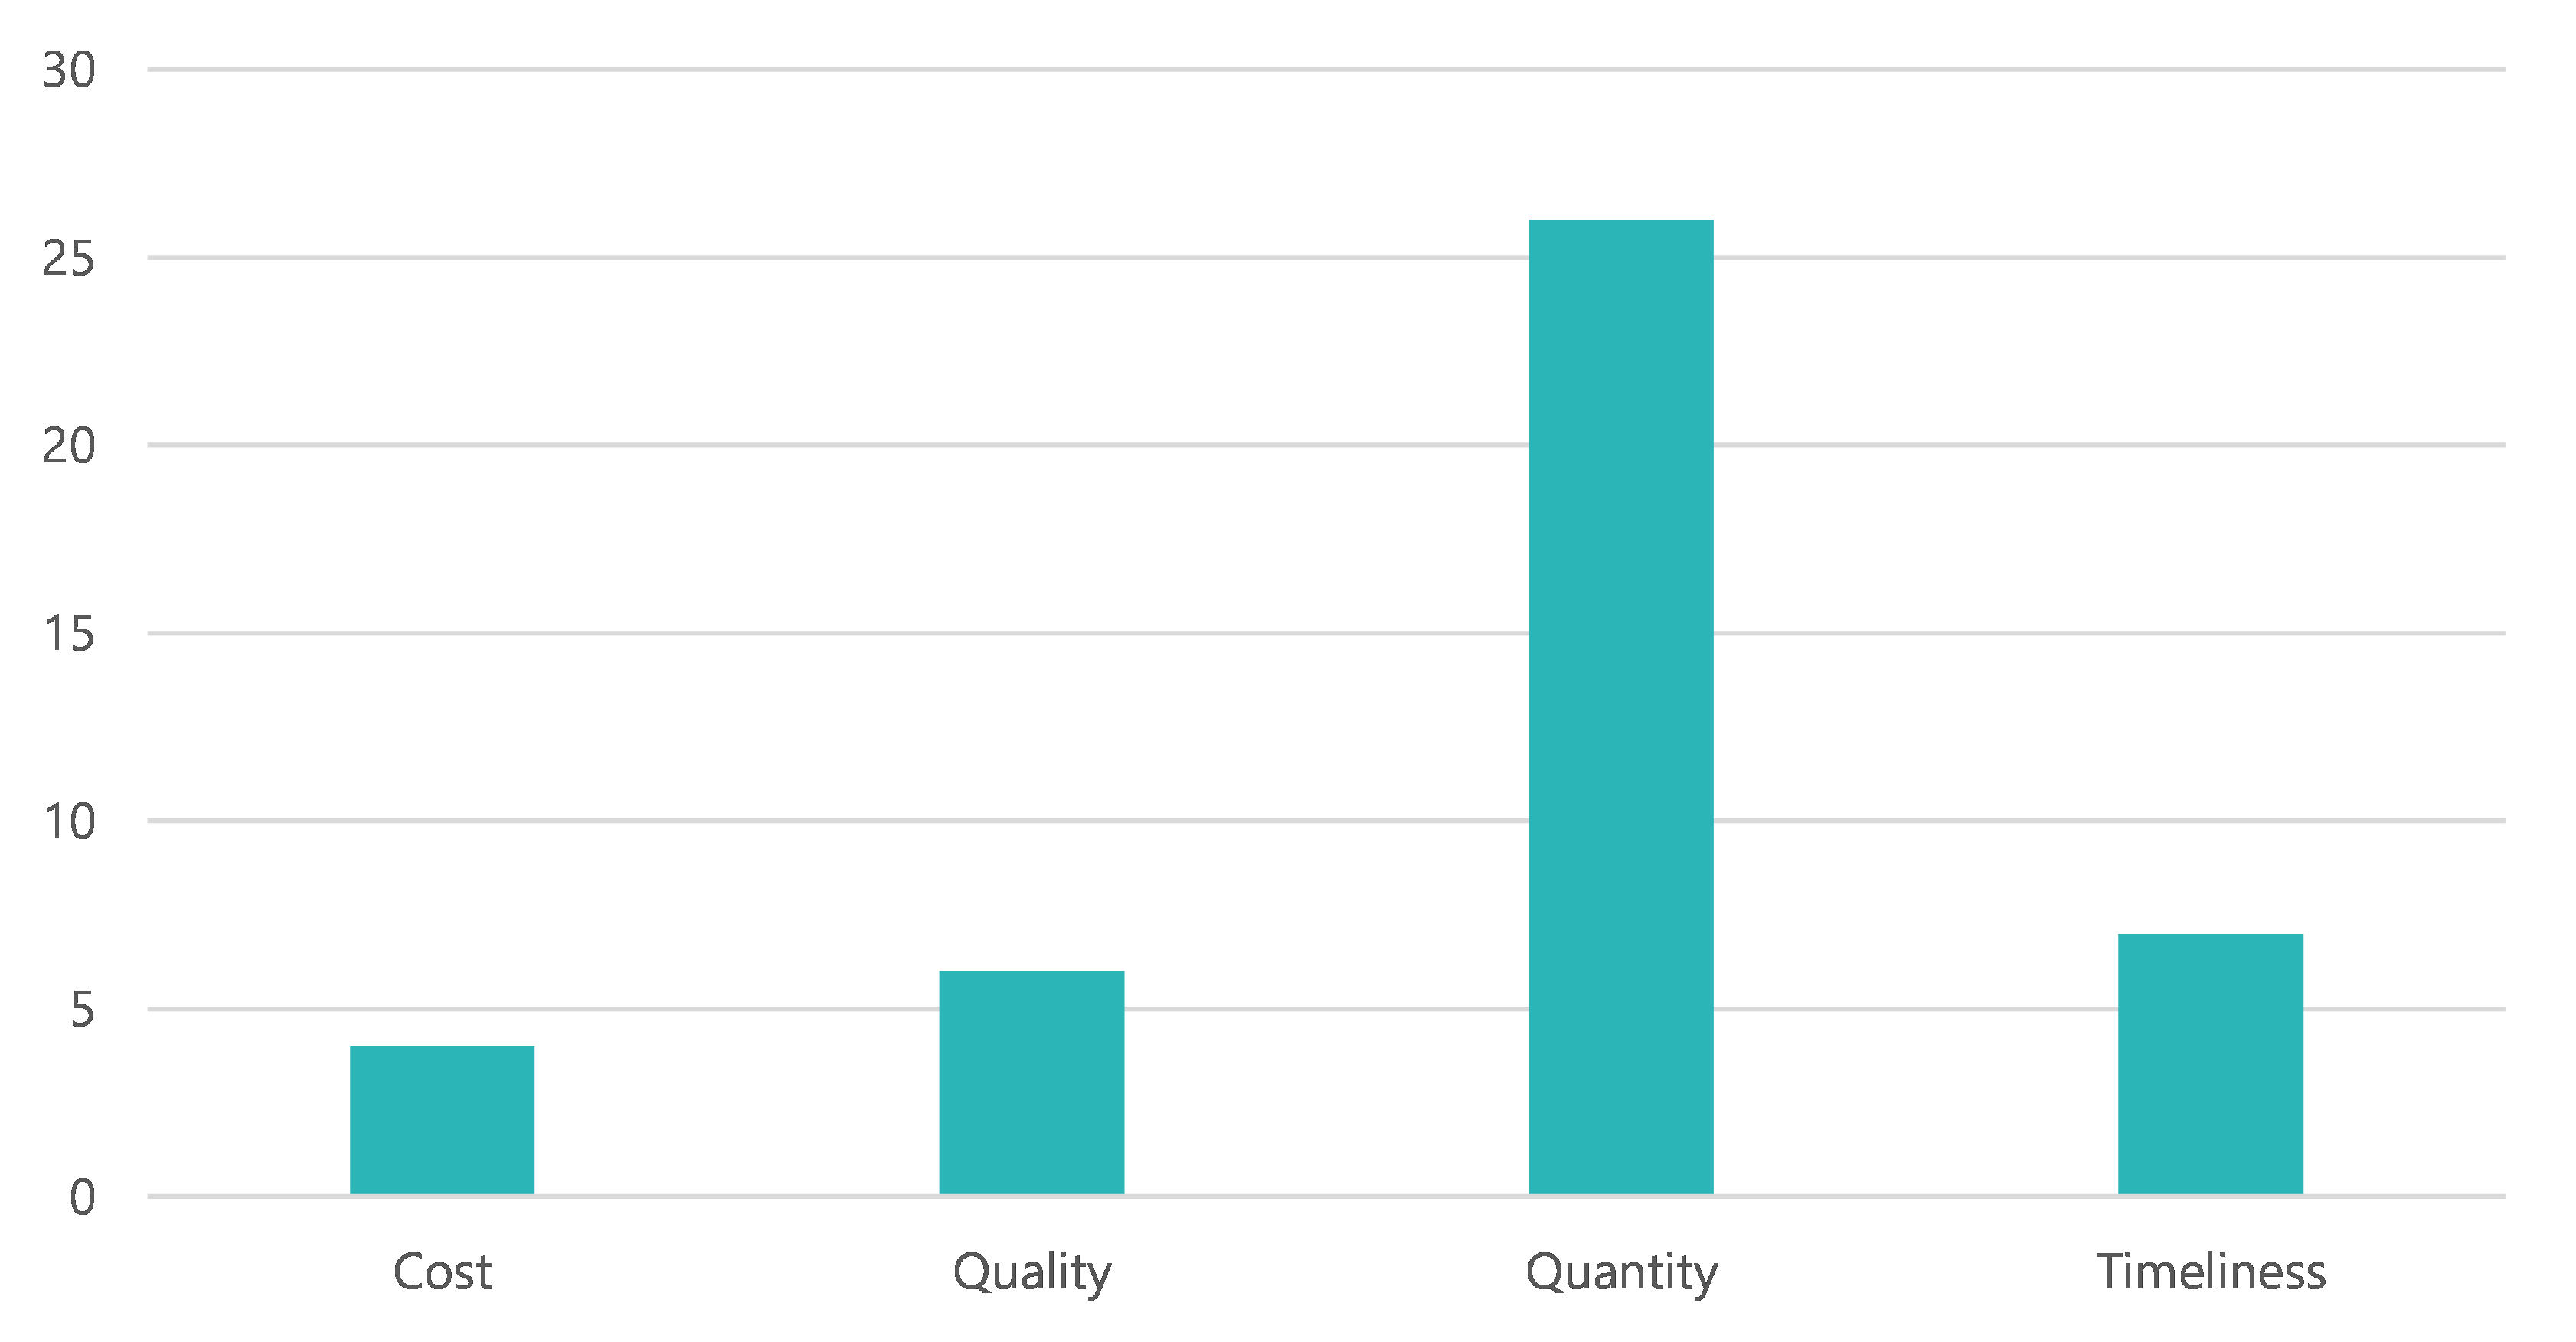
Source: VAGO’s analysis of BP3 2023–24.
DEECA has no measures of efficiency
DEECA has no output performance measures for service efficiency. DEECA has advised us that it will investigate unit cost measures for inclusion in BP3 when DTF provides revised guidance in the RMF.
DEECA needs stronger data controls to ensure the accuracy and reliability of its environmental sustainability BP3 data
BP3 results need to be verifiable
The RMF states that output performance measures should have a sound evidence base. Data should be available so results against the performance measures can be observed and reported. It also states there should be processes in place to retain performance records to a standard that allows an independent auditor to verify information integrity.
We could not replicate results for 59 per cent of measures
We asked DEECA for the data, documentation and methodology it used to support the calculation of results for its environmental sustainability performance measures (excluding cost and new measures) published in BP3 since 2018–19.
DEECA provided information for 32 of the 33 requested measures. DEECA was not able to provide data in a timely way, advising us that for some measures the data would take over a month to provide. We also needed additional information to complete our assessments after DEECA’s initial provision of data.
DEECA also advised us that due to machinery-of-government changes, it has not been responsible for reporting against some measures for the period of data we requested.
We used this data to replicate the results published in BP3. We were unable to replicate results for most measures:
|
We found … |
For … |
|---|---|
|
We could not replicate results |
59 per cent of measures. |
|
We could replicate or understand how DEECA reported the results |
41 per cent of measures. |
Source: VAGO, based on DEECA information.
Where we were unable to replicate the reported results, this was because:
- there were calculation errors
- data definitions were unclear or not provided
- data quality issues impacted our ability to replicate them.
Some datasets can be updated after the reporting date
DEECA exported some data from relevant databases to send to us. DEECA told us that in some cases, changes can be made retrospectively to data to reflect status updates. This may occur, for example, where a previously accepted application may be rejected after the reporting date. This means it is possible that some results were reported accurately at the time but have subsequently changed. However, DEECA could not provide us with documentation to verify the results were accurate at the time of reporting.
DEECA has some data quality controls in place
We asked DEECA what controls it has in place to ensure that data collected is as complete as possible and processed as accurately as possible. DEECA told us that the following controls are in place for all its BP3 measures:
- staff training (including guidance materials and documentation)
- metadata documentation (data dictionaries)
- quality assurance processes (through peer review or independent review)
- restricted user access to reporting system
- use of minimum mandatory fields and some pre-filled information when entering data.
We found data quality issues with 75 per cent of measures
We assessed the quality of data supporting the environmental sustainability BP3 results against a traffic light (red–amber–green) rating system:
|
We gave this percentage of measures … |
This colour rating … |
If we could … |
|---|---|---|
|
41 |
R |
|
|
34 |
A |
|
|
25 |
G |
|
Note: R = red, A = amber, G = green.
Source: VAGO, based on DEECA information.
We found data quality issues with the data underpinning most of DEECA’s environmental sustainability measures. This means that despite DEECA having some controls in place, we cannot be assured that these controls are enough to ensure results are accurate and reliable.
During our discussions with DEECA, it identified some improvements it can make to improve its data accuracy and quality. Some of these improvements include:
- better record-keeping and verification practices
- requesting raw data from portfolio agencies
- making more detailed business rules.
DEECA’s data management practices do not meet the Victorian Data Quality Standard
The Victorian Government Information Management Framework applies to all government departments. The Data Quality Standard, part of the framework, helps departments implement best practice in data management. This includes having a data quality statement and data quality management plan, clear roles and responsibilities for data management and an information asset register for critical datasets.
We asked DEECA about its data and information management controls for the environmental sustainability performance measures. DEECA told us that:
- it has some documentation that partially meets the requirements of a data quality statement and a data quality management plan, but it does not have the full requirements in place
- all BP3 performance measures are reported through the department’s internal reporting system, which requires a Responsible and/or Reporting Officer
- it does not have a whole-of-department information asset register. The department does have an online reporting system to manage BP3 measure metadata, with fields including legislative requirements, governance roles, information lifecycle, security and access requirements, as well as information about the quality of data.
A previous VAGO review identified issues with data collection and management
Our Environment and Sustainability Sector: Performance Reporting review, tabled in 2013, assessed the effectiveness of the then Department of Environment and Primary Industries’ (DEPI) public performance reporting (DEPI was renamed DELWP in 2015).
Through this review we found the department applied inconsistent standards and processes for collecting, recording and validating data it used to measure performance. We also found that DEPI did not clearly document performance measure definitions. We recommended improvements for performance data collection and management.
These findings are consistent with the findings of this review.
Roles and responsibilities are not clear in DEECA’s water performance measures
Reporting performance of multiple agencies
As a Victorian government department, DEECA must report results against output performance measures set out in BP3. These measures reflect services that are funded through departments’ outputs. For some outputs, such as ‘Effective Water Management and Supply’, this means DEECA is reporting the performance of other service providers that it funds.
Many departments report on such services. The RMF requires departments to report on activities that are attributable to core responsibilities and service delivery mechanisms of the department or portfolio agencies. However, departments do not have to specify which entity is delivering the service.
An overview of Victoria’s water sector
|
DEECA |
The water sector’s lead agency, responsible for administration of the water sector, as well as policy and regulation. The department works with the delivery partners below to manage the state’s water resources. |
|---|---|
|
Water corporations |
Responsible for:
|
|
Catchment management authorities (CMAs) |
Victorian Government statutory authorities, responsible for the integrated planning and coordination of land, water and biodiversity management in each catchment and land protection region. |
|
Victorian Environmental Water Holder |
A statutory authority responsible for holding and managing Victoria’s environmental water entitlements. |
Governance of the water sector
Water corporations and CMAs are entities under the responsibility of the Minister for Water. The minister appoints the boards of water corporations and CMAs and is accountable for their performance. In its role as the responsible agency, DEECA provides support to the minister.
DEECA also provides funding to water corporations and CMAs as follows:
- State (and federal) funding is provided to water corporations for the delivery of specific government objectives.
- DEECA manages state funding allocated to CMAs to deliver state government initiatives and carry out their role managing catchment and waterway health.
How DEECA manages water performance
DEECA told us it has a range of tools to impact the performance of its delivery partners against BP3 measures. These include:
- managing the provision of funding according to funding agreements with agreed milestones
- requesting regular reporting on deliverables to the department that allows it to compare performance across entities
- establishing output standards for natural resource management (for example, DELWP Output Data Standard: Core Standard for Natural Resource Management Reporting).
How DEECA reports water performance
DEECA reports results against 16 performance measures in the ‘Effective Water Management and Supply’ output. For some of these measures, the responsibility for service provision lies with CMAs, water corporations or other entities. This is because the activities are funded (or partly funded) through that output.
DEECA does not specify which entity provides the service, nor is it required to by the RMF. This means it is difficult to separate DEECA’s performance from that of other entities using the performance measures as they are currently written (see Figure 9).
Figure 9: Entities responsible for service delivery for a sample of DEECA’s ‘Effective Water Management and Supply’ performance measures in BP3 2023–24
| Performance measure | Delivery partner | Context |
|---|---|---|
|
Water market information products published annually to ensure water users can make informed decisions |
N/A |
DEECA publishes this information. |
|
Households or community housing assisted in the Community Rebate and Housing Retrofit Program |
Water corporations |
Program run by water corporations, which send qualified plumbers to undertake a water audit and retrofit |
|
Waterway licenses and permits processed within statutory timeframes |
CMAs |
Licences and permits processed by CMAs |
|
New flood studies funded to ensure communities understand flood risk and to inform investment in flood warning and mitigation measures |
Local government, |
Local councils deliver studies. CMAs provide councils with support to develop funding proposals and deliver the project. DEECA coordinates the state’s financial contribution to successful proposals. |
Note: N//A means not applicable.
Source: VAGO, based on DEECA information.
DEECA reports outputs of delivery partners
As outlined in Figure 6, we have identified one of DEECA’s outputs as oversight and regulatory services. Using the service delivery logic mapping (see Figure 1), we would classify outputs of service delivery partners as inputs or activities into DEECA’s oversight role, rather than as DEECA outputs.
Outputs delivered by service delivery partners could be better represented in DEECA’s performance statements by measures that demonstrate its oversight and regulatory role (DEECA’s output). The measures could reflect the levers the department has to affect the performance for those measures. This would more fairly present DEECA’s actual performance.
Performance reporting by other water entities
As public entities, water corporations and CMAs must table an annual report of operations in Parliament:
- CMAs must include a report on the condition and management of land and water resources in their region and the carrying out of their functions
- Water corporations must include a report against key performance indicators as directed by the Minister for Water. VAGO audits the performance statements of water corporations before they are tabled in Parliament.
The Essential Services Commission also releases a public report each year on the performance of the urban water corporations. The reports focus on key issues of customer bill levels and the quality and reliability of water and sewerage services.
There is no requirement for alignment between performance reporting
Victorian government departments must comply with the Model Report for Victorian Government Departments (model report) issued by DTF. The model report provides guidelines for departments to develop their annual reports and includes instructions on how to report performance against output performance measures. Other public sector entities are not required to comply with the model report.
CMAs, water corporations and other DEECA-funded delivery partners do not need to report their contribution to DEECA’s BP3 measure results in their annual reports. This means readers cannot properly understand which entity delivers the service reflected in the BP3 measures and in what capacity.
What we found and what we recommend
What we found through our assessments
DEECA aligns its environmental sustainability objectives to the UN SDGs. Supporting BP3 measures are also in alignment with SDG targets and indicators.
We found that DEECA’s environmental sustainability measures do not fully comply with the RMF. In particular, many measures were not considered useful in the context of government decision-making and nearly half the measures did not enable a comparison over time. DEECA also does not have a balance of quantity, quality and timeliness measures.
We found that DEECA’s current set of BP3 ‘Effective Water Management and Supply’ measures do not allow readers to understand DEECA’s oversight and regulatory role for its service delivery partners.
Based on the information provided, we identified issues with DEECA’s data management and data quality processes. These issues mean we cannot assure the accuracy of some of its environmental sustainability BP3 results published since 2018–19. For some measures, DEECA was also unable to provide the documentation it used to verify the accuracy of the results at the time of publication.
What we recommend
We recommend that DEECA:
- review its environmental sustainability measures to ensure they meet the requirements of the RMF and fairly present the performance of the department. This includes more clearly presenting its direct service delivery performance in relation to delivery partners
- review current data quality management practices across BP3 reporting to meet the Victorian Data Quality Standard and implement any additional data quality controls required to improve data accuracy
- ensure that performance reporting records are kept in a manner that allows for independent verification. This should include (at minimum):
- a copy of any raw data used and/or an extract of any point-in-time data used to calculate and report on BP3 results. This also applies to measures where data is provided by third parties
- the methodology used to calculate the results
- documentation of processes used to assure the accuracy of reported BP3 data.
Appendix A: Submissions and comments
Click the link below to download a PDF copy of Appendix A. Submissions and comments.

Appendix B: Abbreviations, acronyms and glossary
Click the link below to download a PDF copy of Appendix B. Acronyms, abbreviations and glossary.
Click here to download Appendix B. Acronyms, abbreviations and glossary
Appendix C: Review scope and method
Click the link below to download a PDF copy of Appendix C. Scope of this audit.
Appendix D: How VAGO assessed departmental measures
Download a PDF copy of Appendix D: How VAGO assessed departmental measures.
Download Appendix D: How VAGO assessed departmental measures
Appendix E: Departmental objective changes
Download a PDF copy of Appendix E: Departmental objective changes.
Appendix F: Departmental output changes
Download a PDF copy of Appendix F: Departmental output changes.
Appendix G: New performance measures by department, by attribute
Download a PDF copy of Appendix G: New performance measures by department, by attribute.
Download Appendix G: New performance measures by department, by attribute
Appendix H: Discontinued performance measures
Download a PDF copy of Appendix H: Discontinued performance measures.