Local Government: 2015–16 Audit Snapshot
Overview
In this report, we detail matters arising from the 2015–16 financial and performance report audits of the 79 councils, 11 regional library corporations and 14 associated entities that make up the local government sector. We also assess the sector's financial performance during 2015–16 and its sustainability as at 30 June 2016.
Three recommendations are made to councils in this report.
Local Government: 2015–16 Audit Snapshot: Message
Ordered to be published
VICTORIAN GOVERNMENT PRINTER November 2016
PP No 221, Session 2014–16
President
Legislative Council
Parliament House
Melbourne
Speaker
Legislative Assembly
Parliament House
Melbourne
Dear Presiding Officers
Under the provisions of section 16AB of the Audit Act 1994, I transmit my report Local Government: 2015–16 Audit Snapshot.
Yours faithfully

Andrew Greaves Auditor-General
24 November 2016
Audit overview
In this report, we detail matters arising from the 2015–16 financial and performance report audits of the 79 councils, 11 regional library corporations and 14 associated entities that make up the local government sector. We also assess the sector's financial performance during 2015–16 and its financial sustainability as at 30 June 2016.
Conclusion
At 30 June 2016, local governments collectively generated a net surplus for the year of $1.6 billion. We assess the sector generally as having relatively low financial sustainability risks. However, this is not uniform. Financial sustainability issues are emerging for the cohort of 19 small shire councils. Declining revenues are forecasted for this cohort over the next three years, while expenditure is expected to remain consistent.
Asset valuation processes across the sector require more attention. Some councils do not:
- provide complete and accurate asset registers to their valuation experts for review
- have sufficient understanding to review and challenge their valuers' assessments
- have appropriate governance measures to identify and mitigate risks associated with the valuation process.
Findings
Financial audit outcomes
We issued clear audit opinions for the 2015–16 financial and performance statements of the 79 councils in the local government sector.
We reviewed the internal control framework of each council as part of our financial audits, and reported on 211 new internal control weaknesses that require attention. Councils have not taken remedial action to rectify similar issues we raised in prior audits—45 per cent of these issues have not been resolved at 30 June 2016. The weaknesses we have identified have the potential to result in material frauds or errors going undetected. They need to be resolved in a more timely way.
Financial performance
The local government sector generated a combined net surplus of $1.6 billion for the 2015–16 financial year. Most of this was contributed by the nine interface councils[1] from their cash and in-kind developer contributions, both of which are recognised as revenue when they are handed over to councils. These interface councils recorded $692.4 million in contributions in 2015–16—$519.5 million in assets and $172.9 million in cash—a 54.7 per cent increase on the prior year.
While in-kind developer contributions are recognised as revenue when received, councils then have an ongoing obligation to maintain the assets they receive and also to spend developers' cash contributions on community assets.
At the sector level, while developer contributions were up, payments of Commonwealth financial assistance grants to councils were down compared to the prior year. However, this was largely a timing difference. The first tranche of the 2015–16 grant was paid early and therefore was recognised during 2014–15, so only half the 2015–16 grant was recognised as revenue in 2015–16.
Financial position
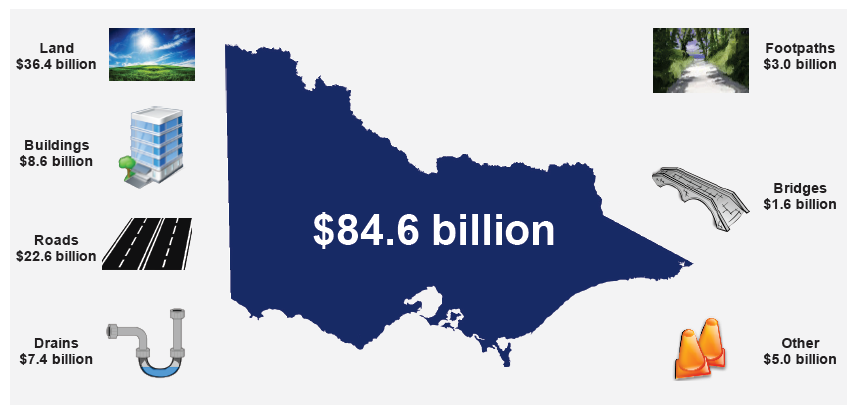
At 30 June 2016, the local government sector was responsible for $84.6 billion of fixed assets. Councils control a large variety of fixed assets to enable them to deliver services to their communities—such as land, buildings, roads and drainage. Overall, we were satisfied that the value of fixed assets reported by the sector at 30 June 2016 is materially accurate.
However, not all councils have complete underlying data about their assets. In 2015–16, 31 councils found $149.3 million of assets that they had not known about or recorded. Our case studies illustrate that this is a recurring issue.
By improving their asset data, and asset valuation frameworks, councils will be able to use this information for purposes other than financial reporting. In particular, this would provide additional details for councils to consider as part of their asset maintenance and capital works planning.
At 30 June 2016, the local government sector held $3.4 billion in cash and investment assets, and $1.2 billion in interest-bearing liabilities. The sector has a low level of net debt.
Financial sustainability
Overall, we assessed the local government sector as having a relatively low financially sustainable risk at 30 June 2016. When assessed against six financial sustainability risk ratios, the sector received positive ratings for both short- and long-term indicators of financial sustainability risk, but this was not a uniform result.
Small shire councils
Our financial sustainability analysis of the five council cohorts indicated that, taken collectively, the 19 small shire councils have emerging financial sustainability risks.
This cohort generated a combined net deficit of $0.1 million for the 2015–16 financial year, $67.3 million less than last year. This related directly to the timing of the financial assistance grants. This cohort did not collect other revenue to counteract this impact, unlike other cohorts within the sector. This resulted in increased financial sustainability risks for the small shire council cohort.
Looking ahead, the small shire council cohort is expecting to experience a decline in capital grant revenue over the next three financial years. From our review of the cohort councils' unaudited budgets, this loss of revenue—combined with a steady level of expenditure—will have the following impact:
- a decline in the net result of the cohort
- a reduction of funds available for investment in property, plant and equipment—with the number of councils within this cohort forecast to spend less than depreciation on their assets over each of the three financial years.
Recommendations
We recommend that councils:
- promptly address matters raised in this and previous years' audits to prevent their potential reoccurrence and rectify any weaknesses in their control environment to mitigate the risk of their financial statements having material errors (see Part 2)
- review their asset valuation frameworks and incorporate better practice elements as required (see Part 4)
- ensure the asset register is accurate and reconciled with asset management systems (see Part 4).
Responses to recommendations
We have consulted with all local councils and the Department of Environment, Land, Water & Planning, and we considered their views when reaching our audit conclusions. As required by section 16(3) of the Audit Act 1994, we gave a draft copy of this report, or relevant extracts, to those agencies and asked for their submissions and comments.
The following is a summary of those responses. The full responses are included in Appendix A.
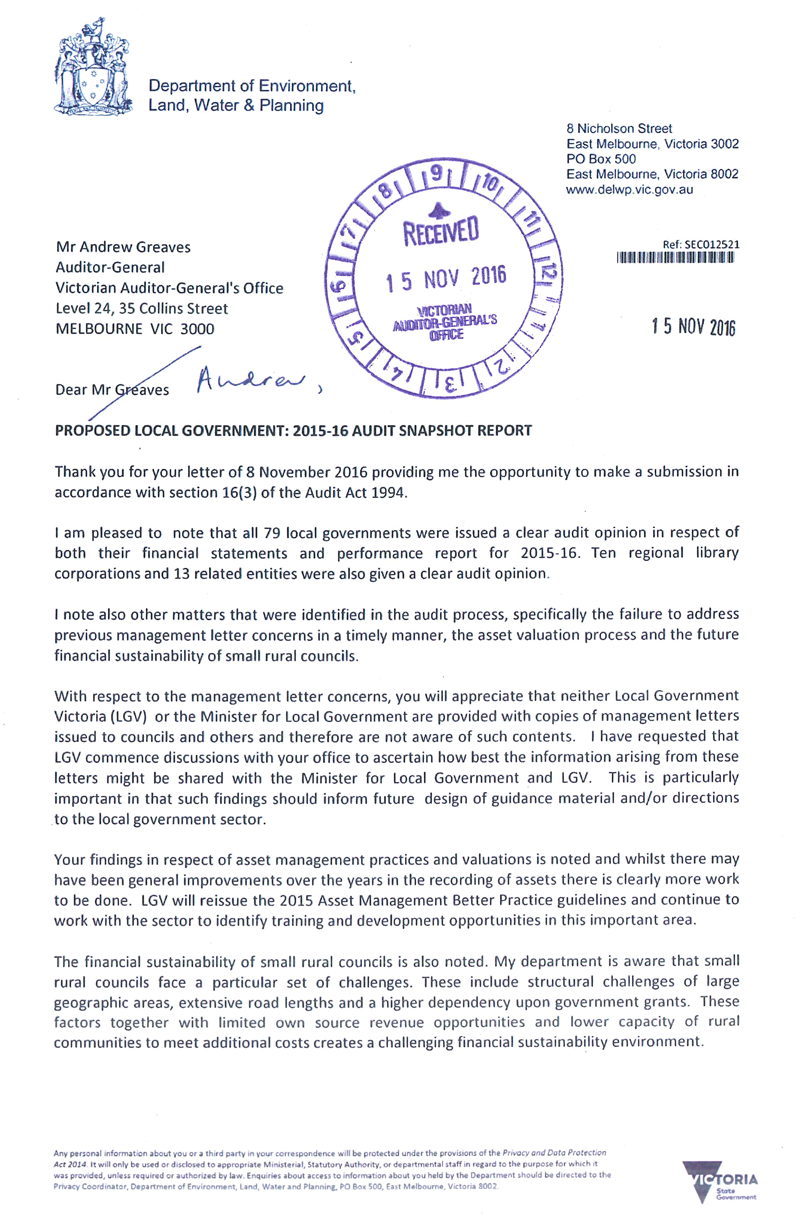
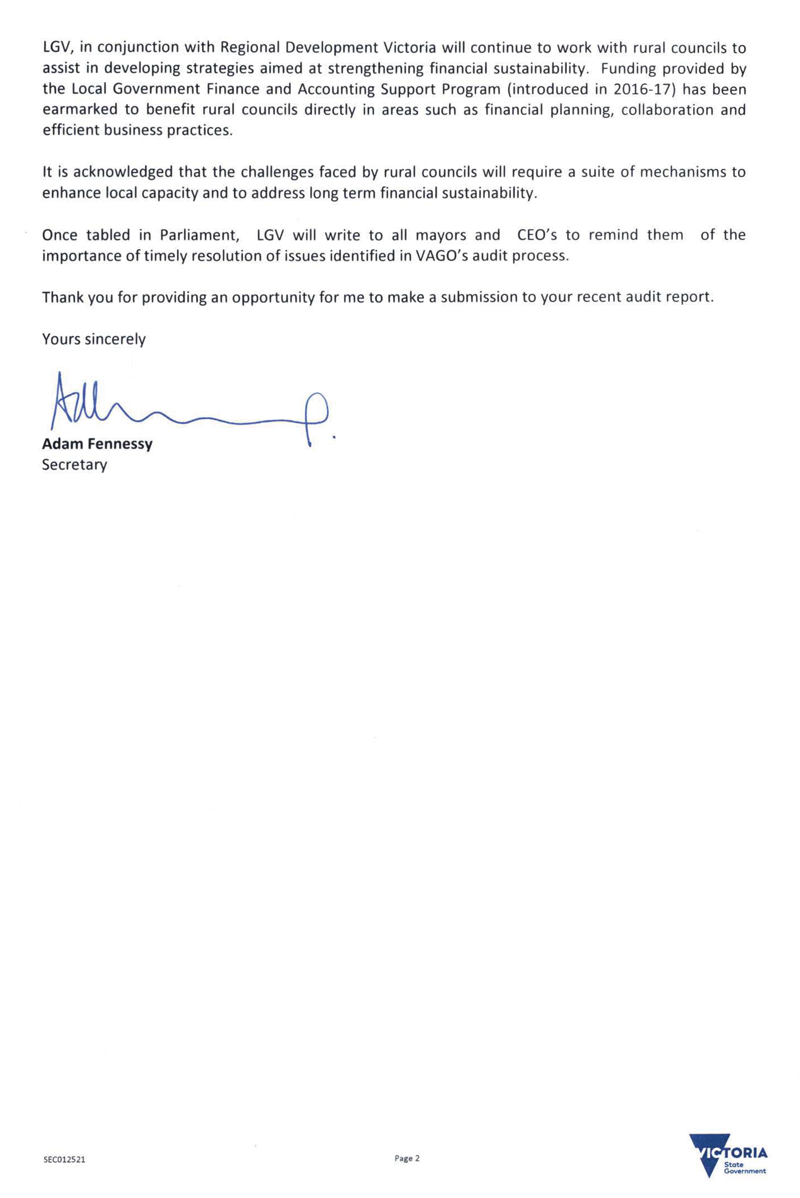
The Department of Environment, Land, Water & Planning responded, noting that 79 local governments were issued a clear opinion on their financial statements and performance reports for 2015–16. Local Government Victoria (LGV) is to begin discussions to decide how councils may share their information from management letters with the Minister for Local Government and LGV. LGV will reissue its Asset Management Better Practice Guidelines and continue to work with the sector to improve asset management practices. In conjunction with Regional Development Victoria, LGV will work with rural councils to assist in developing strategies to strengthen the financial sustainability of small rural councils.
Footnote
[1] Interface councils are the nine municipalities that form a ring around metropolitan Melbourne. See Appendix B.
1 Context
1.1 The local government sector
Victoria's constitution recognises local government as the third tier of government. It comprises 79 councils, 11 regional library corporations and 14 associated entities. In this report, the local government sector refers to the 79 councils.
We have classified councils into five cohorts based broadly on size, demographics and funding. These cohorts are consistent with the classification that Local Government Victoria (LGV) uses. Figure 1A provides details of the cohorts used.
Figure 1A
Council cohorts
Cohort |
Definition |
Number of councils |
|---|---|---|
Metropolitan |
A metropolitan council is predominantly urban in character and located within Melbourne's densely populated urban core and its surrounding less populated territories. |
22 |
Interface |
An interface council is one of the nine municipalities that form a ring around metropolitan Melbourne. |
9 |
Regional city |
A regional city council is a council that is partly urban and partly rural in character. |
10 |
Large shire |
A large shire is defined as a municipality with more than 16 000 inhabitants that is predominantly rural in character. |
19 |
Small shire |
A small shire council is defined as a municipality with less than 16 000 inhabitants that is predominantly rural in character. |
19 |
79 |
||
Source: VAGO.
Appendix B lists the councils included in each cohort.
1.2 What we cover in this report
In this report, we detail the outcomes of the 2015–16 financial audits of Victoria's local government sector. We identify and discuss the key matters arising from our audits, and provide an analysis of information included in councils' financial reports.
Figure 1B outlines the structure of this report.
Figure 1B
Report structure
Part |
Description |
|---|---|
2: Results of audits |
Provides commentary on the results of the financial and performance report audits and the financial outcomes of the 79 councils for 2015–16. Discusses our findings from our review of internal control and/or financial reporting matters identified during the 2015–16 financial audits and previous audits. |
3: Financial sustainability |
Provides an insight into the local government sector's financial sustainability risks, based on financial sustainability risk indicators analysed over the preceding five financial years, and provides forecasts for the next three years. |
4: Asset valuations |
Provides commentary on the asset valuation frameworks in place across the 79 councils. |
The financial audits of the 104 entities included in this report were undertaken in accordance with section 15 of the Audit Act 1994 and Australian Auditing and Assurance Standards. The total cost of preparing this report was $210 000, which is funded by Parliament.
2 Results of audits
In this Part we detail the outcomes of our financial audits of the local government sector for the 2015–16 financial year. We discuss the main reasons for the combined net result achieved by the 79 councils, and focus our analysis on the five council cohorts.
We also comment on the internal control matters we found during 2015–16, and provide an update on matters raised in previous audits.
2.1 Financial audit outcomes for 2015–16
2.1.1 Financial report opinions
Independent audit opinions add credibility to financial reports by providing reasonable assurance that the information reported is reliable and accurate. A clear audit opinion confirms that the financial report presents fairly the transactions and balances for the reporting period, in accordance with the requirements of the applicable accounting standards and relevant legislation.
All 79 councils were issued with clear audit opinions for their financial statements for the financial years ended 30 June 2015 and 30 June 2016.
At the date of reporting, 10 regional library corporations and 14 associated entities had been issued with clear audit opinions for their financial statements for the financial year ended 30 June 2016. The audit of one regional library corporation is still to be finalised.
2.1.2 Performance statement opinions
Councils' performance statements contain 90 performance indicators, of which we audit 30. Our audit opinion notes that the performance statement presents fairly, in all material respects, the outcome of the audited performance indicators.
We issued all 79 councils with clear audit opinions for their performance statements for the financial years ended 30 June 2015 and 30 June 2016.
2.2 Council financial results
Figure 2A summarises the key financial balances of the local government sector—comprising the 79 councils—for the financial year ended 30 June 2016. The sector generated a net surplus of $1.6 billion ($1.5 billion in 2014–15).
We measure financial performance using net result—the difference between revenues and expenses. We measure financial position as the difference between total assets and total liabilities.
Figure 2A
Key balances for local government sector for the financial year ended 30 June 2016
|
Cohort |
Revenue $ million |
Expenditure $ million |
Net result $ million |
Net assets $ million |
|---|---|---|---|---|
|
Metro |
4 000.6 |
3 441.3 |
559.3 |
44 561.0 |
|
Interface |
2 428.9 |
1 626.6 |
802.3 |
17 875.5 |
|
Regional city |
1 373.5 |
1 205.2 |
168.3 |
9 875.3 |
|
Large shire |
1 126.9 |
1 060.1 |
66.8 |
9 731.0 |
|
Small shire |
447.7 |
447.8 |
–0.1 |
4 087.5 |
|
Total |
9 377.6 |
7 781.0 |
1 596.6 |
86 130.3 |
Source: VAGO.
Figure 2B shows the net result of the cohorts for the financial years 2011–12 to 2018–19. The information for this figure, and all analysis in this Part, has been drawn from:
- councils' audited financial statements for the 2011–12 to 2015–16 financial years
- councils' 2016–17 budget, which contains forward estimates for the 2016–17, 2017–18 and 2018–19 financial years—this information has not been audited.
Figure 2B
Net result per council cohort for years ended 30 June 2012 to 2019

Note: Dashed line represents budgeted forward estimates.
Source: VAGO.
The net result for the sector at 30 June 2016 was a $100 million increase on the prior year. Two key revenue changes affected this result:
- timing of grant funding provided to councils—which reduced revenue, due to half of the funding being received in the prior year
- growth in developer contributions—which increased revenue.
Financial assistance grants
The combined net result of the 79 councils is influenced by the timing of payments of the financial assistance grant from the Commonwealth Government—received through the state government. This grant is provided to councils each year, to be used towards the provision of council services. Under Australian Accounting Standard AASB 1004 Contributions, councils are required to recognise this income in the financial year it is received, even if it relates to the provision of services in the following financial year.
In recent financial years, councils have sometimes received a portion of the grant early. The first payment for 2015–16 was received in June 2015. This resulted in additional revenue of $269.8 million, which councils would ordinarily have recorded in 2015–16, being recorded in 2014–15.
During 2015–16, councils received the balance of their financial assistance grants for that financial year, but the first payment of their 2016–17 grant was paid in 2016–17. This meant that councils recognised only $269.6 million grant income in 2015–16, compared to $811.5 million in 2014–15.
In 2014, the Commonwealth Government announced that it would stop indexation of the financial assistance grant until 2017–18. This means that the total value of the grant provided to Victoria will be similar each year until 2017–18, and may not reflect the cost increases councils incur as they provide services to their communities. As a result, councils will need to ensure they have other funds available to meet any shortfall in grant funding.
Developer contributions
Developer contributions are received either as cash or physical assets (in-kind contributions) when a new community has been built. The council then maintains the assets on an ongoing basis. Items include infrastructure—footpaths, roads, drainage—or community buildings, such as a school or library. Alternatively, the developer will provide cash to enable the council to build these items as required. Both types of contribution are recognised as revenue when they are handed over to the council.
While total in-kind developer contributions are recognised as revenue up front, councils have an ongoing obligation to maintain the assets they receive and also to spend developers' cash contributions on community assets.
Interface councils generated the largest surplus in most of the last five financial years. This reflects their 'growth council' status—which means that they undertake more community development than other councils. This results in these councils receiving more developer contributions than other councils each financial year. The peak in 2015–16 was driven by $692.4 million in contributions, a 54.7 per cent increase on the $447.7 million they received in 2014–15.
2.3 Financial reporting controls
When carrying out our financial audits of the sector, we found that councils' internal controls generally were adequate for financial reporting. However, we found instances where important internal controls needed to be strengthened.
We report the weaknesses we find in a council's internal controls to the mayor, chief executive officer and audit committee in a management letter.
2.3.1 Issues identified in 2015–16
In 2015–16, we reported 211 issues that we classified as extreme, high and medium risk in our management letters across the 79 councils. Figure 2C summarises the issues by area and risk. Appendix C provides additional information on our risk ratings, and our expected time lines for resolving issues.
Figure 2C
Reported issues by area and risk rating for 2015–16
|
Area of issue |
Risk rating of issue |
|||
|---|---|---|---|---|
|
Extreme |
High |
Medium |
Total |
|
|
Governance |
– |
1 |
8 |
9 |
|
Information systems |
1 |
19 |
26 |
46 |
|
General ledger |
– |
1 |
6 |
7 |
|
Revenue and receivables |
– |
– |
13 |
13 |
|
Expenditure and payables |
– |
1 |
21 |
22 |
|
Employee benefits |
– |
1 |
16 |
17 |
|
Property, infrastructure, plant and equipment |
– |
5 |
85 |
90 |
|
Cash and other assets |
– |
1 |
6 |
7 |
|
Total |
1 |
29 |
181 |
211 |
Note: Issues rated as low risk are excluded from this analysis.
Source: VAGO.
We found the key areas of weakness across the councils relate to the areas of information systems (IS) controls and fixed assets.
Information systems
IS are an integral part of day-to-day council processes. In particular, each council has several key systems that feed into the financial reporting processes. It is important that data held within these systems is secure, and the risk of an unauthorised person accessing the data and systems in minimised.
Across the 79 councils, we raised 46 issues relating to:
- poor patch installation—the latest security updates may not be in place across a particular system or on networked computers
- the use of software that is no longer supported by the provider—these applications will not be subject to updates that enable them to remain secure
- poor password policies—increasing the risk that an unauthorised user may be able to gain access to the IS
- back-up restoration procedures were not documented and/or had not been recently tested—increasing the risk that they may not work when required, resulting in lost data.
All of these issues increase the vulnerability of council IS systems to a potential loss of data or the failure of a particular system, which would reduce the integrity of the data available to the council, and potentially affect their financial information.
Property, infrastructure, plant and equipment
We raised 90 issues regarding the fixed assets and the valuation framework in place across the 79 councils, including failure to:
- regularly update the fixed asset register to ensure that it is accurate and complete
- put an asset valuation policy in place for non-current physical assets
- identify and mitigate asset valuation risks through the risk management process
- conduct a thorough review of valuers'reports before adopting the results of the valuation.
These issues are discussed further in Part 4 of this report, where we assess the non-current physical assets valuation frameworks in place across the 79 councils.
2.3.2 Status of issues raised in previous audits
Through our management letters, we provide an update on the status of internal controls that have been identified and reported during previous audits. We monitor these issues to ensure that they are resolved. Figure 2D shows the status of these issues, as reported in our management letters to the 79 councils.
Figure 2D
Prior-period internal control deficiency issues—resolution status by risk
|
Issue status |
Risk rating |
||
|---|---|---|---|
|
High |
Medium |
Total |
|
|
Unresolved |
17 |
81 |
98 |
|
Resolved |
25 |
97 |
122 |
|
Total |
42 |
178 |
220 |
Note: Issues rated as low risk are excluded from this analysis.
Source: VAGO.
While councils are taking corrective action—with 55 per cent of prior-year issues resolved in 2015–16—issues are still being left unresolved for too long. We recommend that high risk issues are resolved within two months of our management letter being issued. Medium risk issues should be resolved within six months.
3 Financial sustainability
In this Part we review the financial results and performance of Victoria's local government sector for the 2015–16 financial year. We also provide an assessment of each council cohort according to six financial sustainability risk indicators at 30 June 2016.
We discuss the main reasons for the net results achieved, and analyse the trends in key balances—such as types of revenue and capital expenditure—for eight financial years from 2011–12 to 2018–19.
3.1 Conclusion
At 30 June 2016, the local government sector had a relatively low financial sustainability risk assessment.
However, the small shire council cohort is facing an increased financial sustainability risk, with budget projections for the next three financial years showing a fall in expected revenue. This will reduce the funds these councils have available to invest in new and replacement assets which may adversely affect the services they can provide to their communities.
3.2 Financial sustainability risks
To be financially sustainable, councils should aim to generate enough revenue from their own operations to meet their financial obligations, and to fund asset replacement and asset acquisitions.
We use six financial sustainability risk indicators over a five-year period to assess the potential financial sustainability risks in the local government sector. The financial sustainability indicators, risk assessment criteria and benchmarks we use in this report are described in Appendix D.
Figure 3A summarises the financial sustainability risk ratings for the sector at 30 June 2016 based on the council cohorts. The financial sustainability risk indicators are calculated using the financial transactions and balances of each council's audited financial report.
Figure 3A
Financial sustainability risk indicators for the local government sector at 30 June 2016
|
Average across councils for year ended 30 June 2016 |
|||||||||
|---|---|---|---|---|---|---|---|---|---|
|
Indicator |
All councils |
Metro |
Interface |
Regional |
Large |
Small |
|||
|
Net result |
per cent |
11.4 |
13.7 |
29.0 |
9.4 |
4.9 |
–0.1 |
||
|
Liquidity |
ratio |
2.4 |
2.2 |
2.9 |
2.1 |
2.2 |
2.7 |
||
|
Internal financing |
per cent |
138.0 |
211.7 |
171.6 |
111.7 |
101.8 |
93.2 |
||
|
Indebtedness |
per cent |
26.1 |
16.3 |
27.6 |
36.2 |
30.3 |
20.2 |
||
|
Capital replacement |
ratio |
1.5 |
1.6 |
1.6 |
1.5 |
1.3 |
1.2 |
||
|
Renewal gap |
ratio |
1.0 |
1.1 |
0.9 |
0.9 |
1.0 |
1.0 |
||
Note: Yellow result = medium risk assessment; green result = low risk assessment.
Source: VAGO.
3.2.1 Overall analysis
Figure 3B shows that, over the past five years, the local government sector is in a financially sustainable position.
Figure 3B
Financial sustainability risk indicators for the local government sector at 30 June, 2012 to 2016
|
All councils for 30 June |
||||||||
|---|---|---|---|---|---|---|---|---|
|
Indicator |
2012 |
2013 |
2014 |
2015 |
2016 |
|||
|
Net result |
per cent |
13.0 |
13.7 |
8.0 |
15.6 |
11.4 |
||
|
Liquidity |
ratio |
2.1 |
2.1 |
1.9 |
2.3 |
2.4 |
||
|
Internal financing |
per cent |
128.1 |
100.0 |
92.0 |
147.8 |
138.0 |
||
|
Indebtedness |
per cent |
28.7 |
23.1 |
23.7 |
26.3 |
26.1 |
||
|
Capital replacement |
ratio |
1.8 |
1.6 |
1.6 |
1.5 |
1.5 |
||
|
Renewal gap |
ratio |
1.2 |
1.1 |
1.1 |
1.0 |
1.0 |
||
Note: Yellow result = medium risk assessment; green result = low risk assessment.
Source: VAGO.
The slight drop in the net result indicator between 2015–16 and 2014–15 reflects the disparity in the payment schedules for the financial assistance grant. However, the result is still positive. This—when combined with a strong liquidity result for all cohorts—indicates that councils are in a good financial position, and able to meet their commitments when they fall due over the next 12 months.
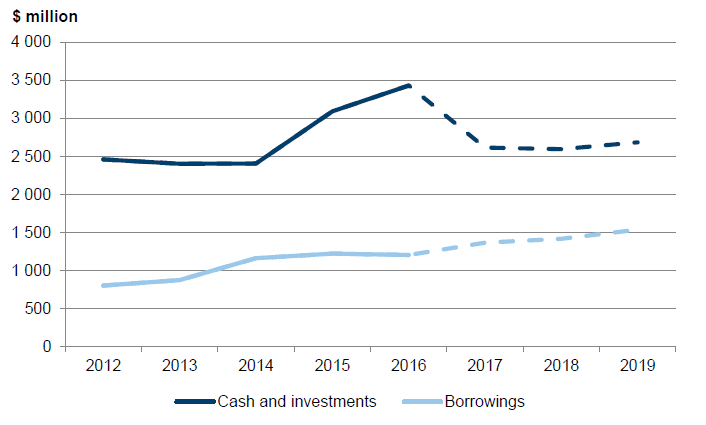
Our review of councils' financial statements has highlighted that the strong financial position is driven by a high level of cash and investment assets and a low level of borrowings at 30 June 2016. As shown in Figure 3C, this trend has been in place over the last five financial years, and is projected to continue over the budget period.
Figure 3C
Cash and investments and borrowings for the local government sector from 2011–12 to 2018–19
Note: Dashed line represents budget information.
Source: VAGO.
Figure 3C highlights:
- a peak in cash holding across the 79 councils at 30 June 2016—reflecting councils' building cash reserves
- an increase in borrowings from the 2012–13 financial year—this is linked to the Municipal Authority Victoria setting up a sponsored funding vehicle that enabled councils to borrow at lower rates.
As councils seek to increase their debt profile, they need to ensure that they are able to meet the repayments when they fall due.
The indebtedness indicator measures councils' ability to meet their non-current liabilities through own-source income—meaning, can they meet their longer-term debts through rates and other income raised by the council, rather than relying on grants for this purpose. Although this covers more than just the repayment of borrowings, it is a good indicator of whether the council is at risk of defaulting on a debt.
At 30 June 2016, the local government sector is rated strongly for this indicator, and is in a position to meet commitments as required. This is consistent with prior years.
The capital renewal indicator provides a snapshot of councils' spending on renewing and replacing their non-current physical assets. This is assessed against the level of depreciation expense for the financial year as this represents use of the assets within the same period. The internal financing ratio assesses whether this capital expenditure can be met from council funds, or additional funding is required.
3.2.2 Small shire councils
When compared with the local government sector as a whole, the small shire council cohort is facing a relatively higher level of financial sustainability risks—particularly in the forecast years. Figure 3D summarises the financial sustainability risk ratings for this cohort from 30 June 2012 to 30 June 2019.
Figure 3D
Financial sustainability risk indicators for the small shire cohort, 2012–19
|
Small shire cohort |
|||||||||
|---|---|---|---|---|---|---|---|---|---|
|
Indicator |
2012 |
2013 |
2014 |
2015 |
2016 |
2017 |
2018 |
2019 |
|
|
Net result |
per cent |
16.1 |
12.4 |
0.2 |
12.7 |
–0.1 |
8.2 |
3.4 |
1.2 |
|
Liquidity |
ratio |
2.7 |
2.6 |
2.1 |
2.8 |
2.7 |
2.1 |
2.0 |
1.8 |
|
Internal financing |
per cent |
148.3 |
98.8 |
78.1 |
140.9 |
93.2 |
93.3 |
103.7 |
99.4 |
|
Indebtedness |
per cent |
23.9 |
15.7 |
16.4 |
19.2 |
20.2 |
18.4 |
17.4 |
13.8 |
|
Capital replacement |
ratio |
2.1 |
1.7 |
1.8 |
1.4 |
1.2 |
1.7 |
1.3 |
1.1 |
|
Renewal gap |
ratio |
1.4 |
1.5 |
1.5 |
1.1 |
1.0 |
1.4 |
1.0 |
0.9 |
Note: Yellow result = medium risk assessment; green result = low risk assessment.
Source: VAGO.
Overall, small shire councils are facing additional pressures due to smaller year-on-year revenue increases, and steady increases in expenditure. This has a direct impact on the level of funds these councils have available for capital expenditure. This could potentially have an adverse impact on the services and infrastructure that councils are able to offer to their communities.
Net result
The small shire council cohort reported a net deficit of $0.1 million for the financial year. This reflects:
- a reduction of $69.8 million in revenue compared to the prior year, reflecting the receipt of the first payment of the 2015–16 financial assistance grant in 2014–15
- a combined deficit of $0.3 million from the councils' joint ventures, compared to a $0.2 million surplus in 2014–15.
The small shire councils are not budgeting to rebuild a strong surplus over the upcoming three financial years.
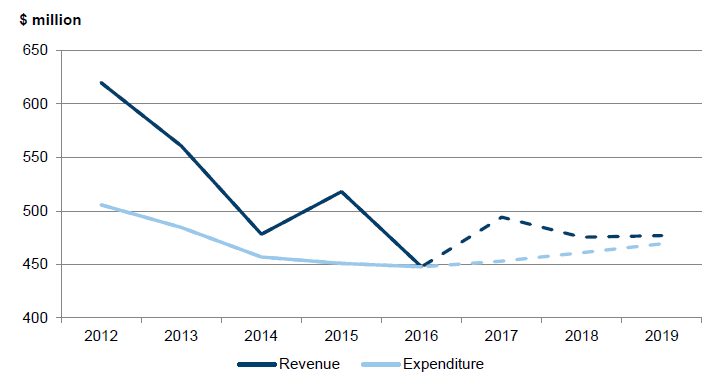
Figure 3E shows the revenue and expenditure for the small shire council cohort over the financial years ended 30 June 2012 to 2019.
Figure 3E
Revenue versus expenditure for the small shire council cohort at 30 June, 2012 to 2019
Note: Dashed line represents budget information.
Source: VAGO.
Figure 3E shows that the revenue for these councils is expected to fall slightly over the budget period, decreasing from $494.3 million in 2016–17 to $476.9 million in 2018−19, a fall of 3.5 per cent. This fall in revenue is linked to an expected 42.5 per cent reduction in capital grants. For these financial years, councils are expecting to generate only small increases in rates revenue—due to rate capping—and expect limited increases in their financial assistance grant.
Over the same period, the cohort's expenditure is expected to increase by 3.6 per cent, from $453.0 million in 2016–17 to $469.3 million in 2018–19. This will result in a small surplus, reducing each financial year. By 2018–19, the cohort projects to generate a collective surplus of $7.6 million.
Capital renewal and renewal gap analysis
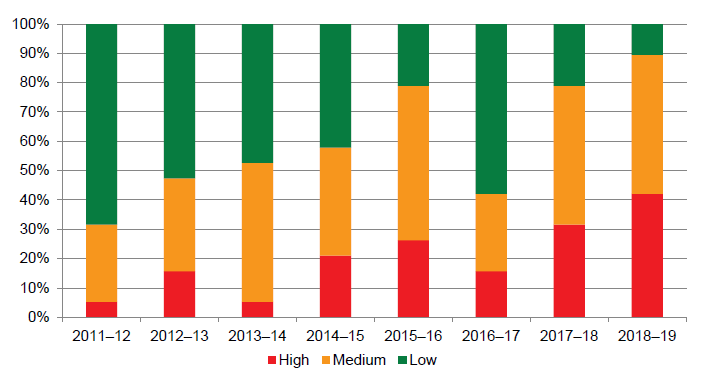
Figure 3F shows the capital renewal indicator for the small shire council cohort from 2011–12 to 2018–19. This chart indicates that the cohort is facing an increasing risk that they will not be able to replace or build new assets as required.
Figure 3F
Small shire council cohort—capital renewal financial sustainability indicator results, 2011–12 to 2018–19
Note: 2016–17 to 2018–19 analysis based on unaudited budget information.
Source: VAGO.
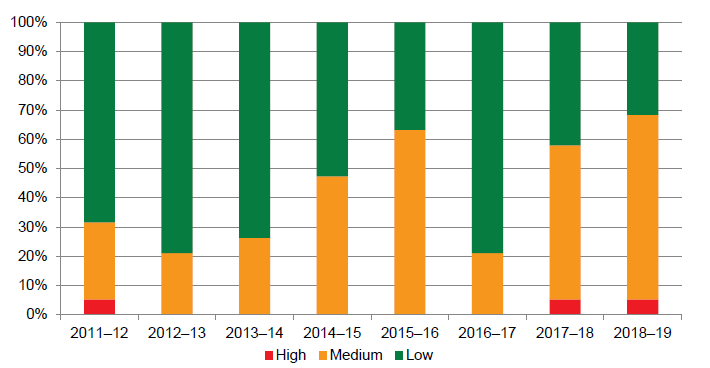
Figure 3G shows our assessment of the renewal gap indicator for the small shire council cohort. It shows our analysis of the level of capital renewal expenditure that was—or is forecast to be—spent on renewing their existing assets, and illustrates that spending on capital renewal is reducing, therefore spending will not be focused on replacing existing assets.
Figure 3G
Small shire council cohort—renewal gap financial sustainability indicator results, 2011–12 to 2018–19
Note: 2016–17 to 2018–19 analysis based on unaudited budget information.
Source: VAGO.
Although building new assets and infrastructure is important for the local community, councils need to ensure that existing assets can continue to be used as required. Councils need to find the right balance between new and replacement asset expenditure to offer the best outcomes for their community.
4 Asset valuations
At 30 June 2016, the 79 Victorian councils controlled $84.6 billion of fixed assets, compared with $78.4 billion in 2015. Councils hold a wide variety of fixed assets, both for community use—such as roads, bridges, drains—and to provide services to the community—such as buildings and land. Figure 4A provides a summary of the types of assets held across the local government sector at 30 June 2016.
Figure 4A
Fixed assets held by local government at 30 June 2016
Source: VAGO.
The information that councils hold about these assets needs to be accurate and complete. Understanding the details of an asset's location, condition, valuation and expected life span will enable a council to:
- inform asset management and maintenance planning
- identify underused assets that can be sold or re-purposed
- comply with the disclosure and valuation requirements of the Australian Accounting Standards.
This Part of the report focuses on the last of these items. We provide details on issues identified in our audit of council valuations for the financial year ended 30 June 2016. We also look at the asset valuation frameworks in place across the 79 councils during 2015–16, and provide two case studies highlighting the issues faced by the sector that affect their ability to report on the assets they hold.
4.1 Conclusion
Asset valuation frameworks in place across the 79 councils are not in line with better practice. Improvements to asset recognition processes are required to reduce the frequency of 'found' and duplicated assets recorded by councils.
4.2 Valuations
4.2.1 Australian Accounting Standards requirements
In their annual financial statements, councils are required to report on the value of their fixed assets in accordance with Australian Accounting Standards AASB 116 Property, Plant and Equipment and AASB 13 Fair Value Measurement. These accounting standards detail the valuation and reporting requirements councils need to comply with for financial reporting purposes.
The valuation process is complex due to the scale and variety of assets that councils control. Asset valuation requires sound management judgement, the engagement of a valuation expert, and the identification and use of a number of key assumptions to underpin the methodology applied when determining fair value. Incomplete or inaccurate asset information may lead to noncompliance with these standards, or result in a material error in the council's financial statements.
4.2.2 Cyclical asset valuations
Councils are required to review the value of their fixed assets annually, and engage valuers to undertake formal valuations as required. This is a complex process that relies on strong data and good judgement. If there is reason to believe the value of an asset is materially inaccurate, then a council should complete a revaluation.
Councils often have programs detailing when they will conduct a formal valuation process on each type of asset, rather than valuing all assets at the same time. For example, drains might be revalued every three years, but roads every second year. There are no set cycles for this process, and this approach is acceptable under AASB 116 and AASB 13.
Figure 4B summarises the revaluation cycles of the four main asset classes for the 79 councils.
Figure 4B
Revaluation cycles for major asset classes in the 79 councils
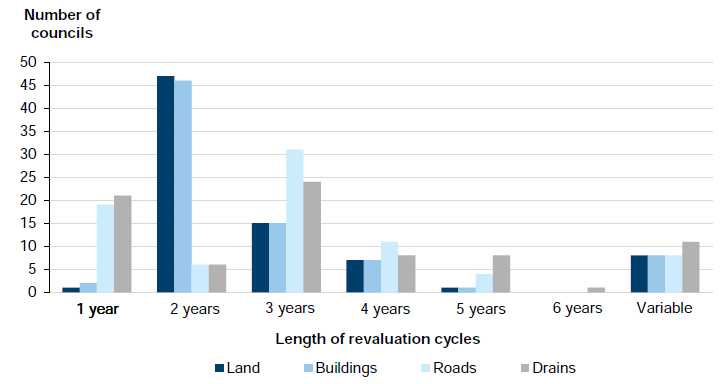
Note: 'Variable' indicates that revaluations take place within a range of years—for example, 2–5 years, 3–5 years or 'ad hoc'.
Source: VAGO.
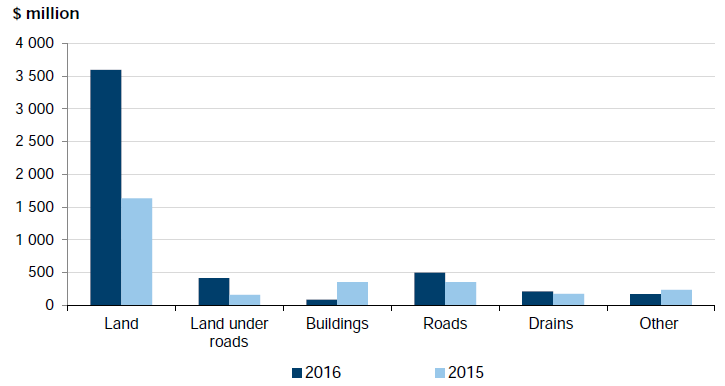
4.2.3 Financial impact of asset valuations
The revaluation of an asset class needs to be accounted for in the council's financial statements. Figure 4C shows the impact of asset valuations for the different asset categories across the local government sector for the last two financial years.
Figure 4C
Asset revaluation increments per asset category, for financial years ended 30 June 2015 and 30 June 2016
Source: VAGO.
4.2.4 Issues arising from 2015–16 valuation process
Due to its complexity, we identify asset revaluations as a key risk that we need to address through our financial audit. This means that we assess each element of the judgements made by management and the valuation experts to ensure that the figures reported in the financial statements are materially accurate.
During 2015–16, our review found the following issues with valuations:
- the use of incorrect unit costs when revaluing assets
- asset condition assessments not being completed for all revalued assets
- proposals to depreciate assets on a deterioration curve basis when a straight line basis is required.
Councils could improve their approach to valuations by implementing an appropriate quality assurance process, and improving communication between the council's accounting and finance area and their engineering area.
All of the issues we identified were resolved by the councils concerned before signing their financial statements.
Found, ghost and duplicate assets
A common issue across councils is the identification of 'found' assets—an asset that the council was unaware of, but for which they have control. As a result, the asset has not been valued nor included in the asset valuation process until the point it is found.
In 2015–16, councils have accounted for found assets either by:
- recording them as income in the financial year they were identified
- making a correction to the prior-year asset information.
During this process, 'ghost' or 'duplicate' assets may also be identified. A ghost asset is one that the council has been recording as an asset but is identified as no longer existing, and a duplicate is an asset that has been identified as a duplicate of an existing asset.
Across the local government sector, 31 councils identified $149.3 million of found assets in the 2015–16 financial year, and $36.8 million of duplicate and ghost assets.
4.2.5 Key systems
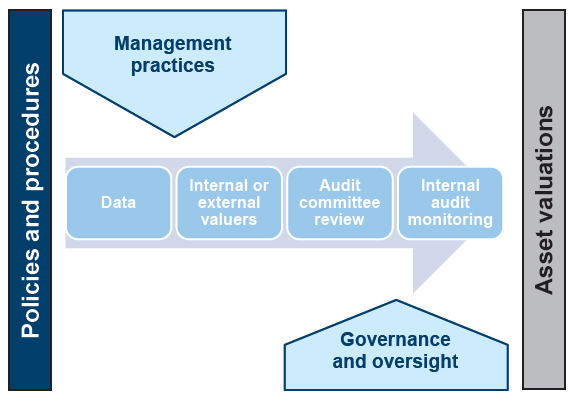
All councils have an asset register in place to collate information about their physical assets. The data in this register must be accurate and complete, both for financial reporting purposes and to assist in the valuation process. Figure 4D shows how these elements are linked.
Figure 4D
Asset valuation process
Source: VAGO.
Asset management system
The asset management system should store all of the data relating to the council's assets. Ideally, it should be available to both the finance and engineering functions of the council to enable asset information to be kept up to date, and to inform all aspects of asset management.
Asset register
Councils collate and store all financial information regarding their physical assets in an asset register. This is the key source of information for councils' financial statements. The asset register must be updated every time the council acquires, disposes of, or revalues an asset. Often the accounting and finance department of a council maintains the asset register.
Asset registers—which can be specialist systems or spreadsheets—are usually updated manually. Many have been in place for a number of years. This increases the risk that they contain errors. Council management must carry out regular quality assurance reviews of the data to confirm that it is complete and accurate.
Our review identified 57 councils (72 per cent) that carried out formal quality assurance reviews of data held in the asset register before providing the data to the valuers. If this review is not done, the valuation may not cover all assets, or may value the wrong assets. It is not the valuer's role to confirm the accuracy of the asset register—only to value the items listed.
Geographical Information System
All councils also operate a Geographical Information System (GIS). The GIS can hold a more detailed registry of all assets similar to the asset register, but with more information about individual assets— such as a description, accurately measured physical dimensions, the geographic location, and photos.
Often a council's engineering department maintains its GIS. Like the asset register, the system needs to be manually updated when a council acquires, disposes of, or reassesses the condition of an asset.
Integrity of the datasets
One of the ways to maintain accurate asset information is to reconcile these separate systems. By performing a reconciliation, councils will be able to identify and investigate any discrepancies, such as:
- assets missing from one system but included in another
- assets included in different asset classifications on the two systems.
By undertaking this reconciliation, council management will also build up a familiarity with their assets base, improving their ability to review and question the valuers' assessments as required.
4.2.6 Valuation frameworks across councils
Councils should have an effective asset valuation framework in place to provide guidance, oversight and management of the asset valuation process. The key elements of an asset valuation framework are shown in Appendix E.
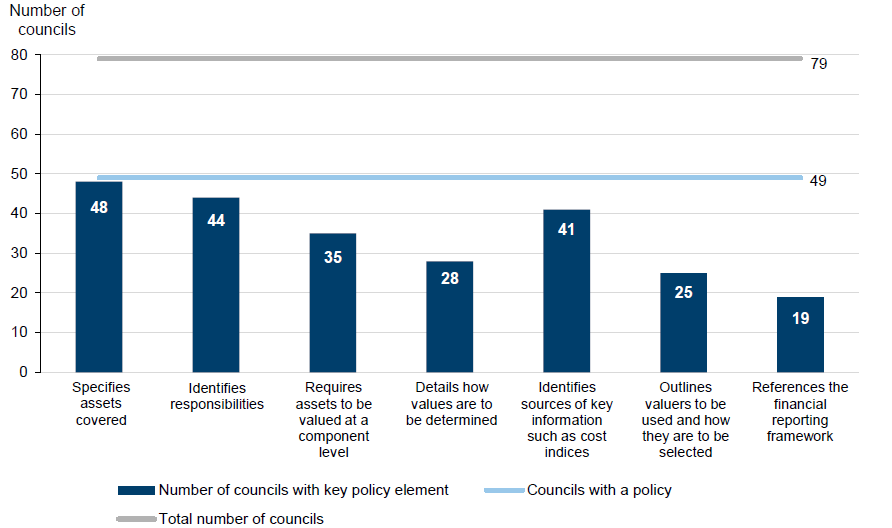
Our review identified 49 councils (62 per cent) had an approved or draft policy covering asset valuations. From those, 25 policies had been reviewed in the last two years, which means that these policies reflect the introduction of AASB 13 Fair Value Measurement for the financial year ended 30 June 2014. Older policies may not include these requirements.
Councils without policies mainly relied on accounting standards for guidance on asset valuations. Although this provides details on the financial statements reporting requirements, it does not cover key aspects of a valuation framework for individual councils, including:
- roles and responsibilities
- frequency of revaluation
- valuation approach and methods
- sources of valuation information
- quality assurance requirements.
Without a policy, councils lack formal direction about how to complete, manage and assess the valuation of their assets. This could lead to potential misstatements in the financial statements. In turn, incorrect valuations will affect the council's depreciation expenses and, potentially, their asset management processes.
Key elements of policies
We analysed the 49 asset valuation policies in place in the sector using the key elements listed in Appendix E. This analysis highlighted common weaknesses across the policies. This is illustrated in Figure 4E.
Figure 4E
Assessment of council asset valuation policies against key elements of better practice
Source: VAGO.
Councils need to improve their policies to include all elements of better practice. For example, by not identifying agreed sources of key information, there is a risk that councils are changing the information they use for each valuation from one cycle to the next. This may mean the valuations are not comparable and could result in wide fluctuations in the outcome. The eventual impact of this will be on the depreciation expense and asset revaluation reserve, and on the council's retained surplus.
Similarly, if councils do not specify whether assets should be valued at a component level or not, they are not providing a consistent methodology for capturing data within the asset register. By not capturing the components of an asset, councils are at risk of noncompliance with the requirement under AASB 116 Property, Plant and Equipment that major components of assets are identifiable and depreciated individually, rather than as a single asset—for example, a leisure centre is not recorded as a single item—but itemised as a building, a swimming pool, gym equipment, fixtures and fittings, etc. It may then be possible to further specify items such as components of the building.
By including all the better practice elements in their valuation frameworks, councils will be able to get the most accurate valuation for their assets possible at the appropriate time. As well as complying with the financial standards, this information can be used in their asset planning processes across the council, to ensure that both the finance and engineering functions have a complete and accurate list of all assets, their useful lives and values.
Management practices
Council management is responsible for maintaining complete and accurate records to prepare financial statements in line with reporting requirements. This includes maintaining control of the asset valuation process, making key decisions at each stage and ensuring that appropriate quality assurance procedures are in place.
Our review identified that 58 councils (73 per cent) review and agree to the terms of reference before starting the asset valuation process.
Similarly, we noted that management formally reviews the proposed methodology to be adopted by the valuers at 60 councils (76 per cent). This is important for management to be able oversee and understand the asset values.
All councils should use these elements of better practice, regardless of whether the valuers engaged are external contractors or internal council staff. In both cases, the valuers need to have reliable data from the asset systems to enable them to provide an accurate valuation.
Governance and oversight
A good governance and oversight process is required to ensure that the results of the asset revaluation stand up to scrutiny. Management must review and query valuers' reports to ensure that they understand any substantial movements in asset valuations within a financial year. Errors arising from the valuation process could lead to material misstatements in a council's financial statements.
Encouragingly, 75 of the 79 councils performed the quality assurance processes over asset valuation reports. These checks included reviewing the unit rates used, assessing the condition and remaining useful lives of assets, and determining asset component levels. Management generally sought answers to any queries from the valuers after reviewing the reports.
Asset valuation risks
Due to the complexity of asset valuations, councils need to identify and mitigate the risks arising from the revaluation process using their risk management framework. This will add an extra level of oversight to the valuation process.
Our review identified that 28 councils (35 per cent) have identified asset valuation risks as part of their risk registers. Councils who are not identifying, mitigating and resolving issues related to the asset valuation process have an increased risk of material errors arising during the process.
Working with audit committees
Councils require their audit committee to independently review the draft financial statements and to recommend whether they should be adopted. Therefore, the audit committee is an ideal high-level reviewer of asset valuation movements. The committee should complete its review before the financial statements are completed.
However, we found that 69 councils (87 per cent) did not separately brief the audit committees about the results of the valuation process to outline key movements in the asset balances.
Review by an audit committee of a revaluation's terms of reference, the key assumptions made in a revaluation and the reasons for the underlying movements in asset values will provide greater assurance over the revaluation process.
Although the audit committee review does not replace robust oversight by management, it should be included in the oversight process. Our recent report Audit Committee Governance, tabled in August 2016, notes that audit committees should be an independent and objective source of advice on matters including financial expertise. Reviewing and understanding asset revaluation movements is a key area where this should occur.
4.2.7 Case studies
Our review identified two councils that provide good examples of the challenges faced by councils as they undertake the valuation process.
Case study: Reconciling asset systems
Mornington Peninsula Shire Council has undertaken a comprehensive review of their asset register, including a reconciliation with the GIS system. As a result of this process, the council found assets they were previously unaware of, and removed duplications in the systems. The case study in Figure 4F provides an example of the issues that councils face.
Figure 4F
Case study: Mornington Peninsula Shire Council
|
Background Mornington Peninsula Shire Council (the shire) looks after an area of 723 square kilometres, and is responsible for $2.0 billion of non-current physical assets. Found assets The shire has a history of reporting found assets in their financial statements. Over the five financial years 2011–12 to 2015–16, $95.9 million of found assets were identified and recognised. These are outlined in this chart. 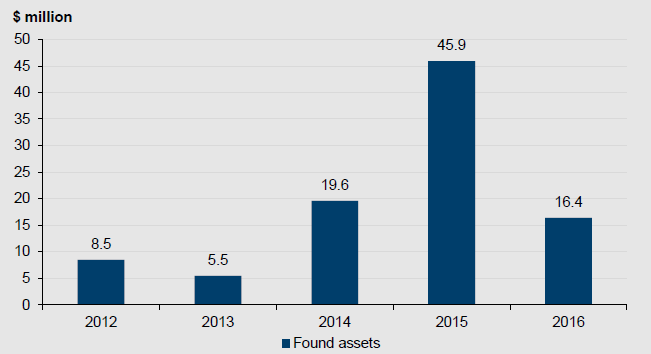 Fair value of found assets ($ million) for financial years ended 30 June 2012 to 2016
Source: VAGO. The high volume of found assets illustrates the risk of not having a complete register of assets, in particular, infrastructure and drainage assets. Identifying these assets To resolve the situation, the shire has used its infrastructure maintenance contracts to gradually identify assets that were not previously recorded, and update missing asset data. Using tools such as geospatial software linked to the fixed asset register, the asset management team has been able to map out infrastructure assets. In early 2016 the shire found $42.8 million of infrastructure assets in the asset register that did not exist. It derecognised these assets through the financial statements. Improving internal processes To get accurate and reliable data about the type and condition of the assets, regular communication between the asset management team (engineers and valuers) and the finance team is important. In the past, the asset management team at the shire entered new data and updated existing data without understanding the financial reporting implications. The finance team relied on this information and used it for reporting purposes. Starting in 2015–16, regular meetings between the finance and asset management teams have resulted in the fixed asset register having a greater degree of accuracy. |
Source: VAGO.
Case study: Found assets
If councils do not have a formal valuation policy, or good governance and oversight in place, errors may arise in the valuation process. These councils may also have a higher than expected number of found assets. Figure 4G provides a case study of Maroondah City Council, which illustrates the impact on a council in this situation.
Figure 4G
Maroondah City Council case study: Asset valuations and data issues
|
Background Maroondah City Council, part of the metropolitan cohort of councils, is located east of Melbourne and has a population of 111 000. At 30 June 2016, the council was responsible for $1.4 billion of non-current physical assets. The asset valuation framework Maroondah City Council has no documented asset valuation policy or procedures in place. Its asset valuation framework relies on its experienced and knowledgeable staff to carry out the valuations in line with mandated reporting requirements. The council engages external valuers to complete their asset valuations, with council management setting the terms of reference for the process. However, the external valuers are required to determine the datasets—such as cost indices for asset materials—and other information used in the review. This means that council management has limited oversight of the valuation methodologies. This may limit management's ability to review and challenge the final valuation report. The audit committee is briefed on valuation matters. However, this is completed as part of the financial statement review process, rather than as a separate briefing, which does not reflect the risks and management judgements involved in the asset valuation process. Found assets Maroondah City Council has identified a net total of $41.9 million in found assets and $0.7 million in duplicated assets over the financial years ended 30 June 2012 to 2016. These assets have been identified in two main ways:
An example of how drainage assets have been identified occurred in 2015–16, with the mapping of two reserves located in Ringwood and Croydon. Through this process, 3.9 kilometres of drains were identified as found assets. These have since been included in council's asset registers and included in the valuation schedules. At 30 June 2016, the council had yet to map the underground stormwater drainage in other reserves, including 13 large reserves, most of which contain cricket ovals or other sporting and play facilities, and about 25 small or 'link' reserves. These reserves may also contain unidentified underground stormwater drainage assets. |
Source: VAGO.
Appendix A. Audit Act 1994 section 16—submissions and comments
We have consulted with all councils and the Department of Environment, Land, Water & Planning, and we considered their views when reaching our audit conclusions. As required by section 16(3) of the Audit Act 1994, we gave a draft copy of this report, or relevant extracts, to named agencies and asked for their submissions and comments.
Responsibility for the accuracy, fairness and balance of those comments rests solely with the agency head.
A response was received from the Department of Environment, Land, Water & Planning.
RESPONSE provided by the Secretary, Department of Environment, Land, Water & Planning
RESPONSE provided by the Secretary, Department of Environment, Land, Water & Planning – continued
Appendix B. Local council cohorts
As detailed in Part 1, to assist with our analysis of the local government sector, the 79 local councils have been divided into five cohorts, based broadly on size, demographics and funding.
Figure B1 lists the local councils that make up each category.
Figure B1
Local council cohorts
Local council cohort |
|
|---|---|
Metropolitan—22 local councils |
|
Banyule City Council |
Manningham City Council |
Bayside City Council |
Maribyrnong City Council |
Boroondara City Council |
Maroondah City Council |
Brimbank City Council |
Melbourne City Council |
Darebin City Council |
Monash City Council |
Frankston City Council |
Moonee Valley City Council |
Glen Eira City Council |
Moreland City Council |
Greater Dandenong City Council |
Port Phillip City Council |
Hobsons Bay City Council |
Stonnington City Council |
Kingston City Council |
Whitehorse City Council |
Knox City Council |
Yarra City Council |
Interface—nine local councils |
|
Cardinia Shire Council |
Nillumbik Shire Council |
Casey City Council |
Whittlesea City Council |
Hume City Council |
Wyndham City Council |
Melton City Council |
Yarra Ranges Shire Council |
Mornington Peninsula Shire Council |
|
Regional city—10 local councils |
|
Ballarat City Council |
Latrobe City Council |
Greater Bendigo City Council |
Mildura Rural City Council |
Greater Geelong City Council |
Wangaratta Rural City Council |
Greater Shepparton City Council |
Warrnambool City Council |
Horsham Rural City Council |
Wodonga City Council |
Large shire—19 local councils |
|
Bass Coast Shire Council |
Moira Shire Council |
Baw Baw Shire Council |
Moorabool Shire Council |
Campaspe Shire Council |
Mount Alexander Shire Council |
Colac– Otway Shire Council |
Moyne Shire Council |
Corangamite Shire Council |
South Gippsland Shire Council |
East Gippsland Shire Council |
Southern Grampians Shire Council |
Glenelg Shire Council |
Surf Coast Shire Council |
Golden Plains Shire Council |
Swan Hill Rural City Council |
Macedon Ranges Shire Council |
Wellington Shire Council |
Mitchell Shire Council |
|
Small shire—19 local councils |
|
Alpine Shire Council |
Mansfield Shire Council |
Ararat Shire Council |
Murrindindi Shire Council |
Benalla Shire Council |
Northern Grampians Shire Council |
Buloke Shire Council |
Pyrenees Shire Council |
Central Goldfields Shire Council |
Borough of Queenscliffe |
Gannawarra Shire Council |
Strathbogie Shire Council |
Hepburn Shire Council |
Towong Shire Council |
Hindmarsh Shire Council |
West Wimmera Shire Council |
Indigo Shire Council |
Yarriambiack Shire Council |
Loddon Shire Council |
|
Source: VAGO.
Appendix C. Management letter risk ratings
Figure C1 shows the risk ratings applied to points raised during an audit review and included in a management letter.
Figure C1
Risk definitions applied to issues reported in audit management letters
Rating |
Definition |
Management action required |
|---|---|---|
Extreme |
The issue represents:
|
Requires immediate management intervention with a detailed action plan to be implemented within one month. Requires executive management to correct the material misstatement in the financial report as a matter of urgency to avoid a modified audit opinion. |
High |
The issue represents:
|
Requires prompt management intervention with a detailed action plan implemented within two months. Requires executive management to correct the material misstatement in the financial report to avoid a modified audit opinion. |
Medium |
The issue represents:
|
Requires management intervention with a detailed action plan implemented within three to six months. |
Low |
The issue represents:
|
Requires management intervention with a detailed action plan implemented within six to 12 months. |
Source: VAGO.
Appendix D. Financial sustainability risk indicators
Figure D1 lists the indicators used in assessing the financial sustainability risks of local councils in Part 3 of this report. These indicators should be considered collectively, and are more useful when assessed over time as part of a trend analysis.
Figure D1
Financial sustainability risk indicators
|
Indicator |
Formula |
Description |
|---|---|---|
|
Net result (%) |
Net result / Total revenue |
A positive result indicates a surplus, and the larger the percentage, the stronger the result. A negative result indicates a deficit. Operating deficits cannot be sustained in the long term. The net result and total revenue are obtained from the comprehensive operating statement. |
|
Liquidity (ratio) |
Current assets / Current liabilities |
This measures the ability to pay existing liabilities in the next 12 months. A ratio of one or more means there are more cash and liquid assets than short-term liabilities. |
|
Internal financing (%) |
Net operating cash flow / Net capital expenditure |
This measures the ability of an entity to finance capital works from generated cash flow. The higher the percentage, the greater the ability for the entity to finance capital works from their own funds. Net operating cash flow and net capital expenditure are obtained from the cash flow statement. |
|
Indebtedness (%) |
Non-current liabilities / own-sourced revenue |
Comparison of non-current liabilities (mainly comprising borrowings) to own-sourced revenue. The higher the percentage, the less the entity is able to cover non-current liabilities from the revenues the entity generates itself. Own-sourced revenue is used, rather than total revenue, because it does not include grants or contributions. |
|
Capital replacement (ratio) |
Cash outflows for property, plant and equipment / Depreciation |
Comparison of the rate of spending on infrastructure with its depreciation. Ratios higher than 1:1 indicate that spending is faster than the depreciation rate. This is a long-term indicator, as capital expenditure can be deferred in the short term if there are insufficient funds available from operations, and borrowing is not an option. Cash outflows for infrastructure are taken from the cash flow statement. Depreciation is taken from the comprehensive operating statement. |
|
Renewal gap (ratio) |
Renewal and upgrade expenditure/depreciation |
Comparison of the rate of spending on existing assets through renewing, restoring, and replacing existing assets with depreciation. Ratios higher than 1:1 indicate that spending on existing assets is faster than the depreciation rate. Similar to the investment gap, this is a long-term indicator, as capital expenditure can be deferred in the short term if there are insufficient funds available from operations, and borrowing is not an option. Renewal and upgrade expenditure are taken from the statement of capital works. Depreciation is taken from the comprehensive operating statement. |
Source: VAGO.
The analysis of financial sustainability risk in this report reflects on the position of each local council.
Financial sustainability risk assessment criteria
The financial sustainability risk of each local council has been assessed using the criteria outlined in Figure D2.
Figure D2
Financial sustainability risk indicators—risk assessment criteria
|
Risk |
Net result |
Liquidity |
Internal financing |
Indebtedness |
Capital replacement |
Renewal gap |
|---|---|---|---|---|---|---|
|
High |
Less than negative 10% |
Less than 0.75 |
Less than 75% |
More than 60% |
Less than 1.0 |
Less than 0.5 |
|
Medium |
Negative 10%– 0% |
0.75–1.0 |
75–100% |
40–60% |
1.0–1.5 |
0.5–1.0 |
|
Low |
More than 0%Generating surpluses consistently. |
More than 1.0 |
More than 100% |
40% or less |
More than 1.5 |
More than 1.0 |
Source: VAGO.
The financial sustainability risk for each council, for the financial years ended 30 June 2012 to 2016, are shown in Figures D3 to D32. For consolidated financial statements, amounts obtained for calculating financial sustainability indicators only relate to council. If these were not available for a complete data set, consolidated figures have been used.
Metropolitan councils
Figure D3
Metropolitan councils, net result 2012– 2016

Source: VAGO.
Figure D4
Metropolitan councils, liquidity 2012– 2016

Source: VAGO.
Figure D5
Metropolitan councils, internal financing 2012– 2016

Source: VAGO.
Figure D6
Metropolitan councils, indebtedness 2012– 2016

Source: VAGO.
Figure D7
Metropolitan councils, capital replacement 2012– 2016

Source: VAGO.
Figure D8
Metropolitan councils, renewal gap 2012– 2016

Source: VAGO.
Interface councils
Figure D9
Interface councils, net result 2012– 2016

Source: VAGO.
Figure D10
Interface councils, liquidity 2012– 2016

Source: VAGO.
Figure D11
Interface councils, internal financing 2012– 2016

Source: VAGO.
Figure D12
Interface councils, indebtedness 2012– 2016

Source: VAGO.
Figure D13
Interface councils, capital replacement 2012– 2016

Source: VAGO.
Figure D14
Interface councils, renewal gap 2012– 2016

Source: VAGO.
Regional city councils
Figure D15
Regional city councils, net result 2012– 2016

Source: VAGO.
Figure D16
Regional city councils, liquidity 2012– 2016

Source: VAGO.
Figure D17
Regional city councils, internal financing 2012– 2016

Source: VAGO.
Figure D18
Regional city councils, indebtedness 2012– 2016

Source: VAGO.
Figure D19
Regional city councils, capital replacement 2012– 2016

Source: VAGO.
Figure D20
Regional city councils, renewal gap 2012– 2016

Note: N/A = information not available.
Source: VAGO.
Large shire councils
Figure D21
Large shire councils, net result 2012– 2016

Source: VAGO.
Figure D22
Large shire councils, liquidity 2012– 2016

Source: VAGO.
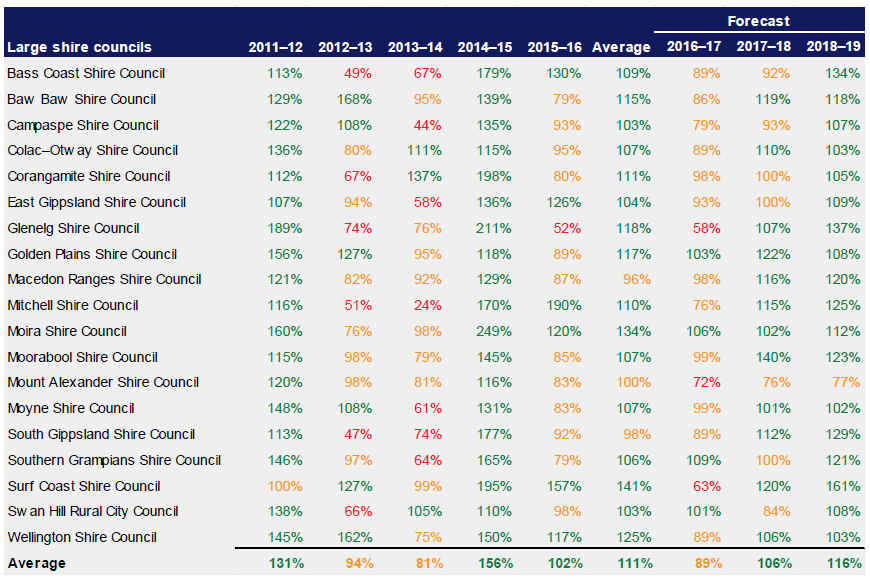
Figure D23
Large shire councils, internal financing 2012– 2016
Source: VAGO.
Figure D24
Large shire councils, indebtedness 2012– 2016

Source: VAGO.
Figure D25
Large shire councils, capital replacement 2012– 2016

Source: VAGO.
Figure D26
Large shire councils, renewal gap 2012– 2016

Note: N/A = information not available.
Source: VAGO.
Small shire councils
Figure D27
Small shire councils, net result 2012– 2016

Source: VAGO.
Figure D28
Small shire councils, liquidity 2012– 2016

Source: VAGO.
Figure D29
Small shire councils, internal financing 2012– 2016

Source: VAGO.
Figure D30
Small shire councils, indebtedness 2012– 2016

Source: VAGO.
Figure D31
Small shire councils, capital replacement 2012– 2016

Source: VAGO.
Figure D32
Small shire councils, renewal gap 2012– 2016

Source: VAGO.
Appendix E. Asset valuations
Figure E1 shows the key elements of an effective asset valuation framework for councils. Part 4 discusses the results of our analysis of the 79 councils according to this framework.
Figure E1
Key elements of an effective asset valuation framework
Elements |
|---|
Policy |
Measurement and valuation of non-current physical assets policy and guidelines exist and:
Policy and guidelines are approved. |
Management practices |
Terms of engagement with the appointed valuer documented and agreed with management, and aligned with the requirements of the exercise. Comprehensive and regular reporting to management and audit committee. Reasonableness of the valuation result assessed considering:
Recommendation by management to the audit committee and council regarding adoption of valuation results. Periodic review by management of policy, procedures and practices. |
Governance and oversight |
Policy and procedures approved by the audit committee. Periodic review of policies by management and audit committee. Internal audit used to review policy, processes and practice periodically. |
Source: VAGO.
Appendix F. Glossary
Asset
An item or resource controlled by an entity that will be used to generate future economic benefits.
Audit Act 1994
Victorian legislation establishing the Auditor-General's operating powers and responsibilities and detailing the nature and scope of audits that the Auditor-General may carry out.
Audit opinion
A written expression, within a specified framework, indicating the auditor's overall conclusion about a financial (or performance) report based on audit evidence.
Capital expenditure
Money an entity spends on:
- new physical assets, including buildings, infrastructure, plant and equipment
- renewing existing physical assets to extend the service potential or life of the asset.
Clear audit opinion
A positive written expression provided when the financial report has been prepared and presents fairly the transactions and balances for the reporting period in accordance with the requirements of the relevant legislation and Australian Accounting Standards—also referred to as an unqualified audit opinion.
Depreciation
Systematic allocation of the value of an asset over its expected useful life, recorded as an expense.
Emphasis of matter
A paragraph included in an audit opinion that refers to a matter appropriately presented or disclosed in the financial report that, in the auditor's judgement, is of such importance that it is fundamental to users' understanding of the financial report.
Equity or net assets
Residual interest in the assets of an entity after deduction of its liabilities.
Expense
The outflow of assets or the depletion of assets an entity controls during the financial year, including expenditure and the depreciation of physical assets. An expense can also be the incurrence of liabilities during the financial year, such as increases to a provision.
Financial report
A document reporting the financial outcome and position of an entity for a financial year, which contains an entity's financial statements, including a comprehensive income statement, a balance sheet, a cash flow statement, a comprehensive statement of equity and notes.
Financial sustainability
An entity's ability to manage financial resources so it can meet its current and future spending commitments, while maintaining assets in the condition required to provide services.
Financial year
A period of 12 months for which a financial report is prepared, which may be a different period to the calendar year.
Governance
The control arrangements used to govern and monitor an entity's activities to achieve its strategic and operational goals.
Internal control
A method of directing, monitoring and measuring an entity's resources and processes, in order to prevent and detect error and fraud.
Liability
A present obligation of the entity arising from past events, the settlement of which is expected to result in an outflow of assets from the entity.
Local Government Act 1989
An Act of the state of Victoria that establishes the:
- purpose of local authorities
- powers that will enable local authorities to meet the needs of their communities
- accountable system of local government
- reform of law relating to local government.
Management letter
A letter the auditor writes to the governing body, the audit committee and management of an entity outlining issues identified during the financial audit.
Material error or adjustment
An error that may result in the omission or misstatement of information, which could influence the economic decision of users taken on the basis of the financial statements.
Net result
The value that an entity has earned or lost over the stated period (usually a financial year), calculated by subtracting an entity's total expenses from the total revenue for that period.
Performance report
A statement detailing an entity's predetermined performance indicators and targets for the financial year, and the actual results achieved, along with explanations for any significant variances between the actual result and the target.
Revaluation
The restatement of a value of non-current assets at a particular time.
Revenue
Inflows of funds or other assets or savings in outflows of service potential, or future economic benefits in the form of increases in assets or reductions in liabilities of an entity, other than those relating to contributions by owners, that result in an increase in equity during the reporting period.
Risk
The chance of a negative or positive impact on the objectives, outputs or outcomes of an entity.
