Results of 2018 Audits: Universities
Overview
In Victoria, there are eight public universities, which control a further 47 entities that we are required to audit.
Each year, we conduct the financial audits of these 55 entities. This report outlines the results of these financial audits and our observations for the year ended 31 December 2018.
We also comment on the financial performance and sustainability of the sector and discuss the significant upcoming changes in accounting standards that will impact the universities’ financial reporting.
Data dashboard
We have developed a data dashboard, an interactive visualisation tool summarising the financial statement data for all Victorian universities.
Transmittal letter
Ordered to be published
VICTORIAN GOVERNMENT PRINTER May 2019
PP No 31, Session 2018–19
President
Legislative Council
Parliament House
Melbourne
Speaker
Legislative Assembly
Parliament House
Melbourne
Dear Presiding Officers
Under the provisions of section 16AB of the Audit Act 1994, I transmit my report Results of 2018 Audits: Universities.
Yours faithfully

Andrew Greaves
Auditor-General
30 May 2019
Acronyms
| AASB | Australian Accounting Standards Board |
| DET | Department of Education and Training |
| EFTSL | effective full-time student load |
| FMA | Financial Management Act 1994 |
| FTE | full-time equivalent |
| Go8 | Group of 8 |
| HESA | Act Higher Education Support Act 2003 |
| TEQSA | Act Tertiary Education Quality and Standards Agency Act 2011 |
| VAGO | Victorian Auditor-General's Office |
| VE | vocational education |
At a glance
1 Audit context
Eight universities and their 47 controlled entities make up the Victorian public university sector. Their principal activities are providing higher education and conducting research. Figure 1A illustrates all main income sources, activities and key stakeholders for the sector.
Figure 1A
University sector 2018 income sources, activities and key stakeholders
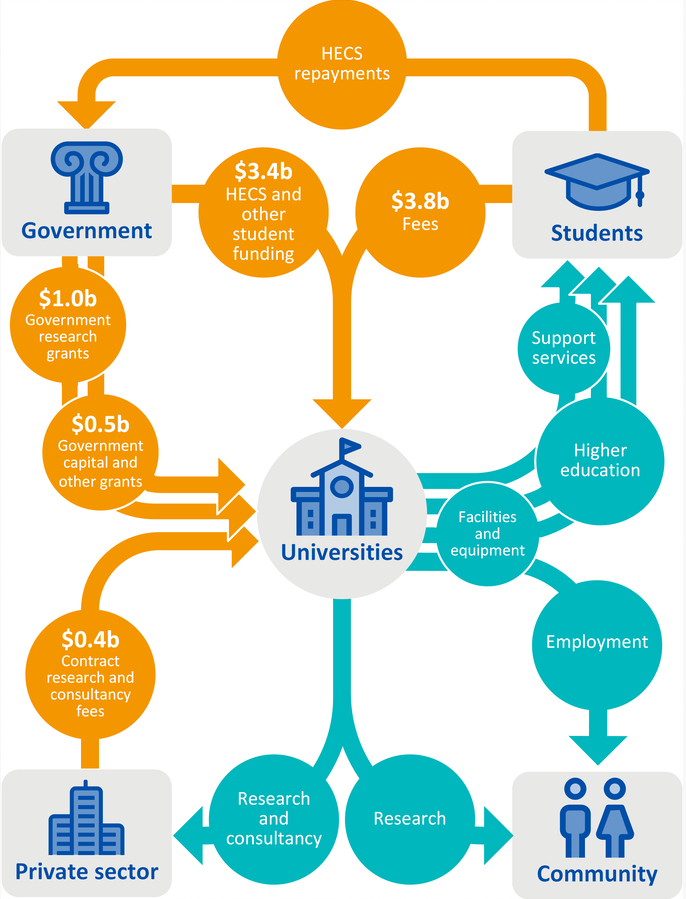
Note: HECS = Higher Education Contribution Scheme.
Source: VAGO.
As seen in Figure 1B, most of the sector's income comes from student fees and Commonwealth Government student funding, both of which are driven by student numbers. Publicly and privately funded research is the sector's next largest revenue source. The majority of the sector's assets consist of the property, plant and equipment that it needs to deliver its services. The sector also holds a significant amount of cash and investments.
Figure 1B
University sector financial snapshot for the year ended 31 December 2018
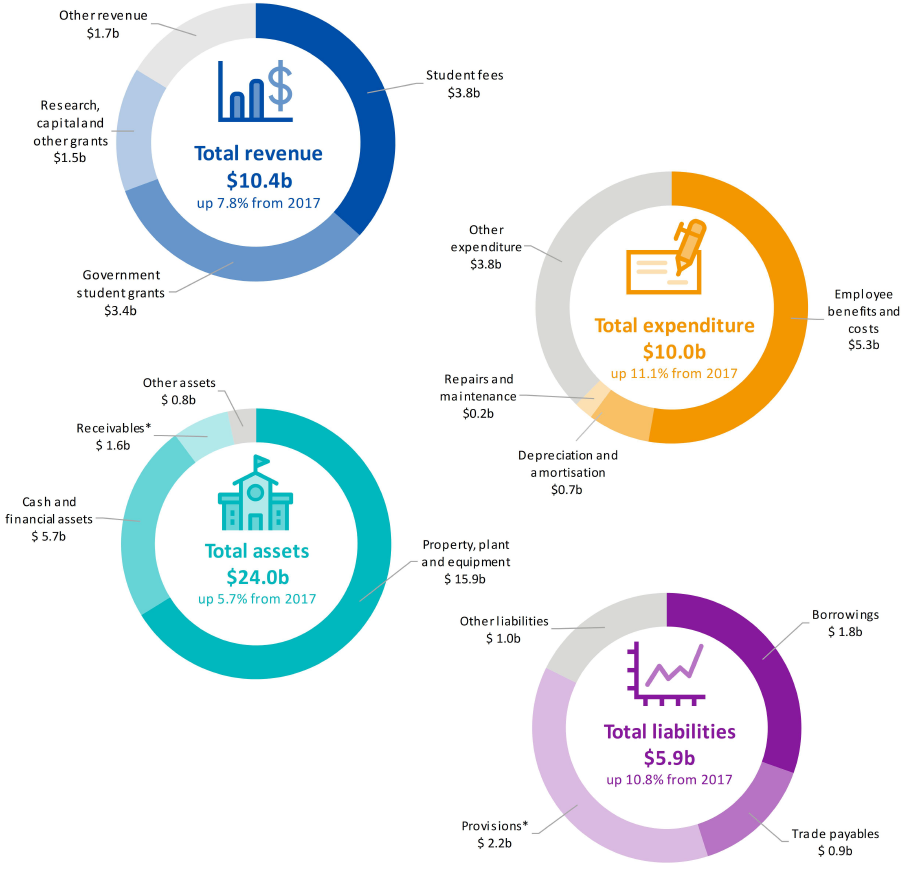
Note: *Provisions include the sector's estimated deferred superannuation contributions of $1.2 billion ($1.1 billion in 2017). An identical amount is included in receivables as the Commonwealth and state governments have agreed to meet this liability.
Note: Figures have been adjusted for the two universities with qualified audit opinions.
Source: VAGO.
Figure 1C shows each university's relative size, based on the number of effective full-time students enrolled, and the number of staff employed. The two largest universities, the University of Melbourne and Monash University, are also members of the Group of 8 (Go8), a company whose members comprise Australia's leading research-focused universities.
Figure 1C
Student and full-time equivalent staff numbers by university for the year ended 31 December 2018
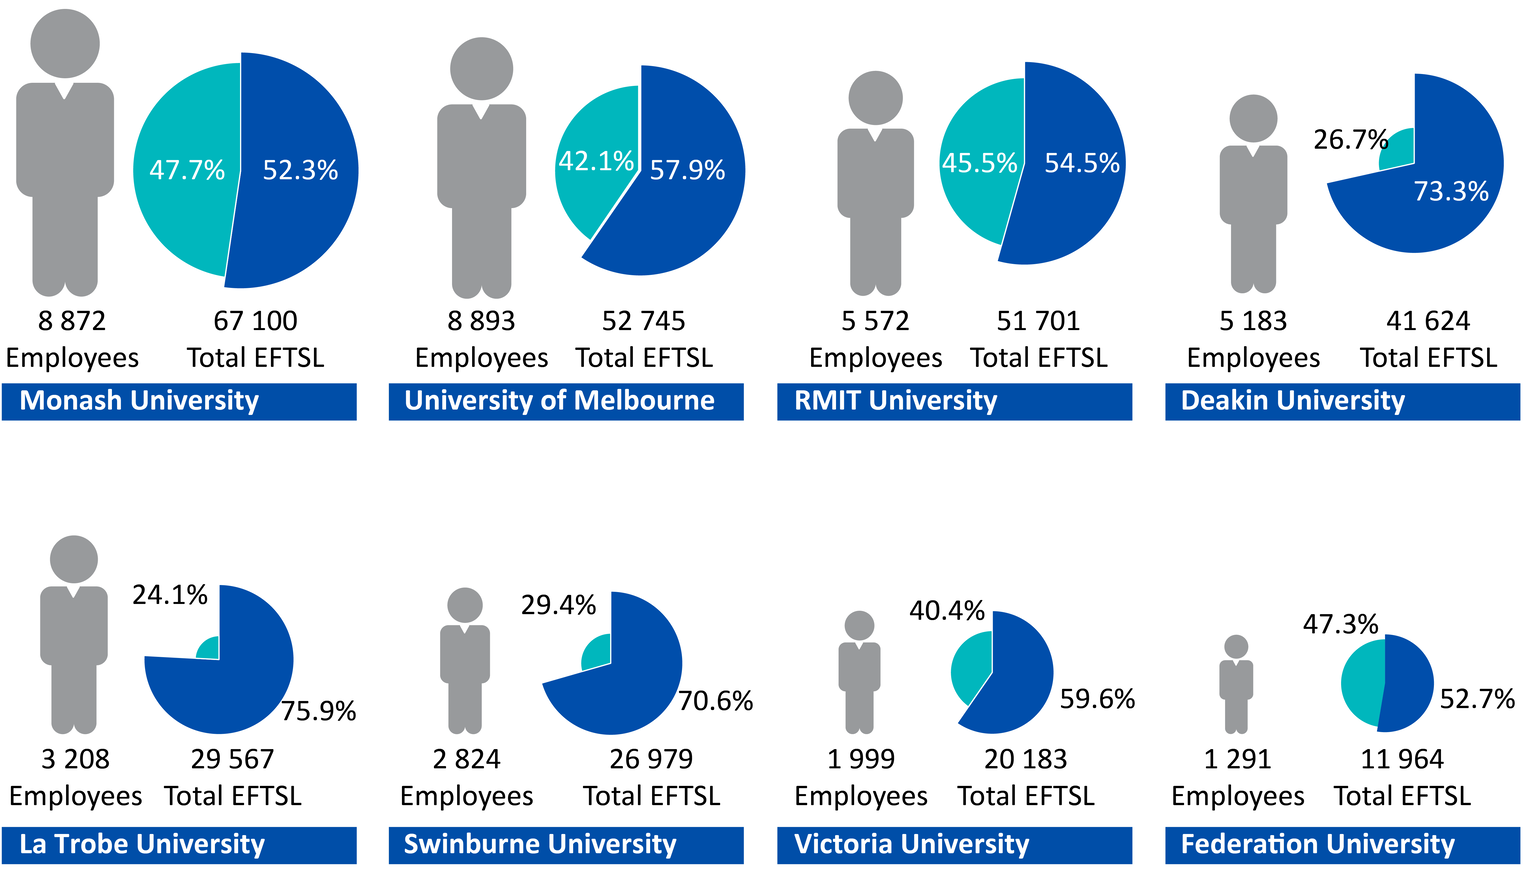
Key: ![]() = overseas students
= overseas students ![]() = domestic students.
= domestic students.
Note: One equivalent full-time student load (EFTSL) represents the equivalent of a student who is studying on a full-time basis for a year. Overseas EFTSL includes both onshore and offshore student loads.
Source: VAGO.
1.1 Legislative and reporting framework
The universities and their controlled entities are subject to a range of complex accountability and financial reporting frameworks, with many reporting requirements.
In Victoria, public universities are established by their own respective enabling legislations. As a result, they fall within the definition of a public body under the Financial Management Act 1994 (FMA) and must comply with its requirements for the preparation of financial reports. However, since the universities are not controlled by the State of Victoria, their financial results are not consolidated into the state's annual financial report.
From the perspective of the Commonwealth, universities:
- are registered with the Tertiary Education Quality and Standards Agency and are, therefore, subject to the regulation of the Tertiary Education Quality and Standards Agency Act 2011(TEQSA Act)
- receive most of their grant funding from the Commonwealth Government and fall within the scope of any legislation associated with this funding, including the Higher Education Support Act 2003(HESA Act).
The TEQSA and HESA Acts, and many of the funding agreements that underpin the funding universities receive for research and other purposes, also impose other financial reporting requirements on the universities in addition to the requirements of the state-legislated FMA. The Commonwealth requires some of these reporting requirements to be included in universities' financial reports. As a result, universities' financial reports contain disclosures that are not usually found in general purpose financial reports.
Many universities and their controlled entities are registered charities with the Australian Charities and Not-for-profits Commission. This means they have further reporting obligations under the Australian Charities and Not-for-profits Commission Act 2012.
Entities controlled by the universities do not automatically fall within the scope of the FMA, but may be required by the respective enabling legislation of their parent university to produce financial reports in a form approved by the minister administering part 7 of the FMA.
1.2 Report structure
In this report, we provide information on the outcomes of our financial audits of the eight Victorian universities and their 47 controlled entities for the year ended 31 December 2018. The financial results of controlled entities are consolidated into those of their respective parent entities. We restrict our comments on the controlled entities to the extent that they are relevant and significant to the consolidated results of their respective groups.
We identify and report on the key matters arising from our audits and analyse the information included in the universities' financial reports. Figure 1D outlines the structure of this report.
Figure 1D
Report structure
|
Part |
Description |
|
|---|---|---|
|
2 |
Results of audits |
Evaluates the audit opinion results from our financial audits of universities, and the timeliness, accuracy and quality of their reporting. Assesses the strength of the internal controls designed, implemented and maintained by the universities. |
|
3 |
Financial performance and sustainability |
Reports on the sector's financial results and evaluates its propensity for long-term financial sustainability and growth. |
|
4 |
Looking forward |
Discusses the significant upcoming changes in accounting standards that will impact the university sector's financial reporting. It includes our assessment of the preparedness of the universities in implementing the new accounting standards. |
Source: VAGO.
Appendix B provides a list of all 55 entities included in this report and details the financial audit opinions issued for the year ended 31 December 2018.
We carried out the financial audits of these entities under section 8 of the Audit Act 1994 and Australian Auditing Standards. Each entity pays the cost of its audit.
The cost of preparing this report was $165 000, which is funded by Parliament.
1.3 Submissions and comments
We have consulted with the Department of Education and Training (DET) and the eight public universities in Victoria, and we considered their views when reaching our conclusions. As required by section 16(3) of the Audit Act 1994, we gave a draft copy of this report to those agencies and asked for their submissions or comments. We also provided a copy of the report to the Department of Premier and Cabinet.
The following is a summary of those responses. The full responses are included in Appendix A.
We received four submissions from the sector and a response from DET.
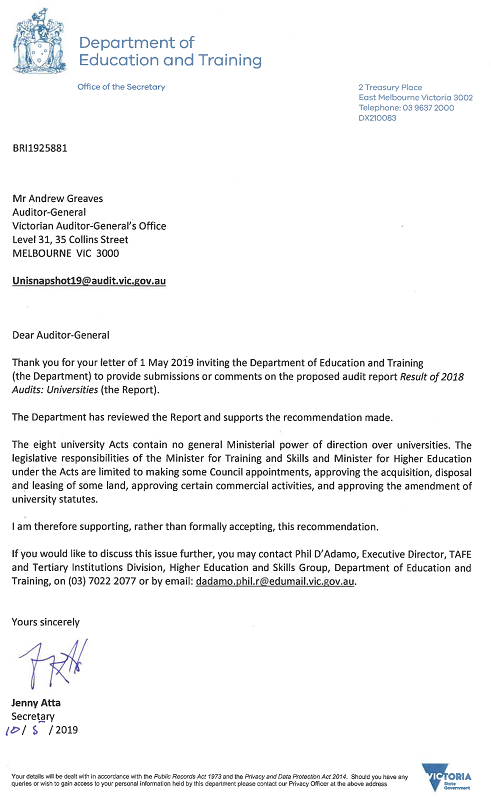
DET supports our recommendation.
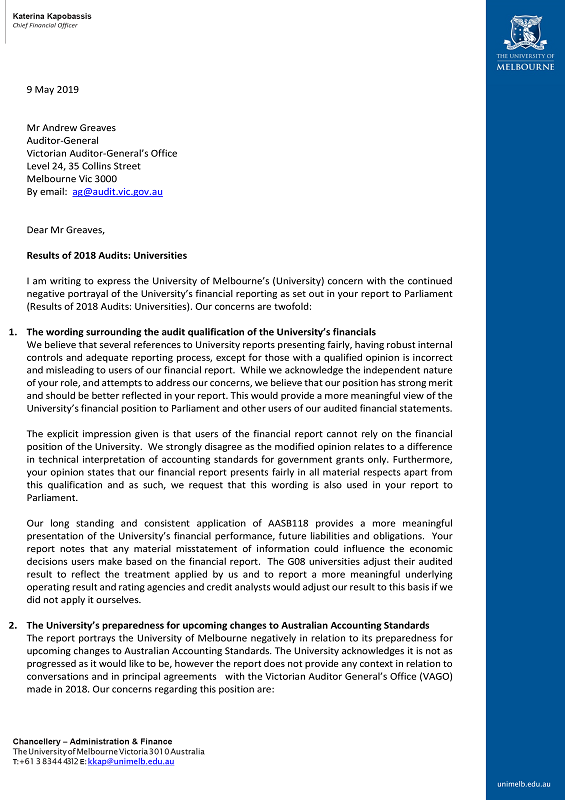
The University of Melbourne and Deakin University do not agree with our interpretation of the nature of their revenue that resulted in our issue of qualified audit opinions on their financial reports, which is discussed further in Part 2. These two universities have also provided their perspectives on their readiness for the implementation of the new revenue accounting standards, which is discussed further in Part 4.
Victoria University has provided details on the corrected financial statement error discussed in Part 2.
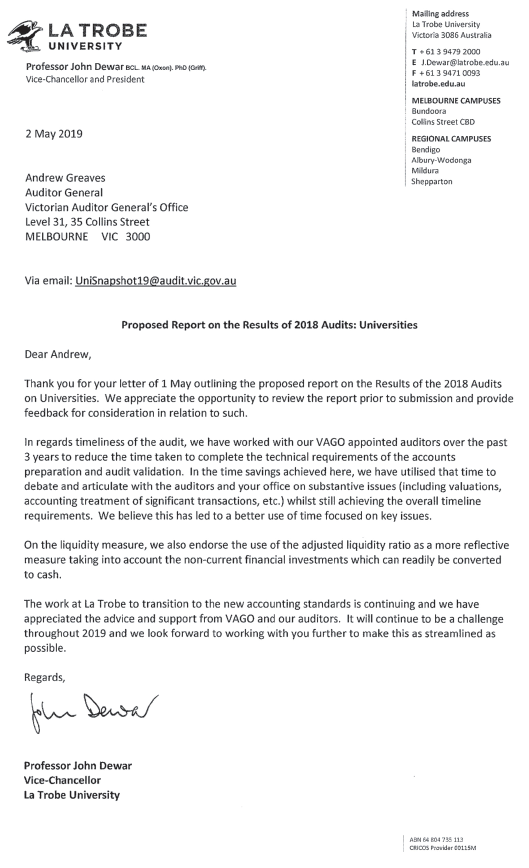
La Trobe University has provided details on the timeliness of their audit, endorsed the use of the adjusted liquidity ratio and commented on their transition to the new accounting standards.
2 Results of audits
In this part of the report, we summarise the results of our financial audits and observations for the university sector for the year ended 31 December 2018.
2.1 Conclusion
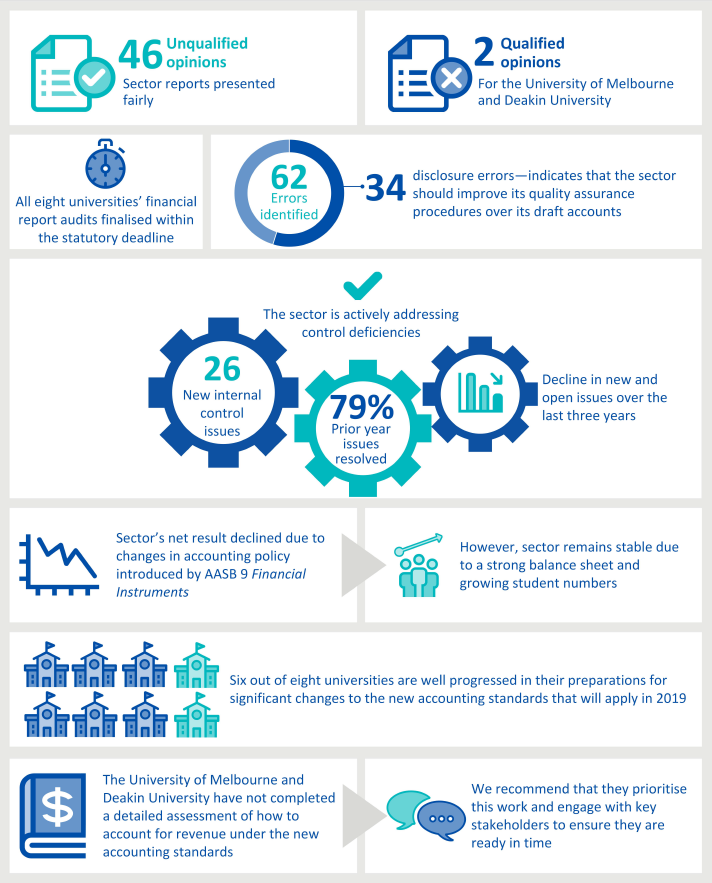
The financial reports of the universities and their controlled entities present fairly, except for those of the University of Melbourne and Deakin University with respect to their recognition of research grant revenue, which does not accord with current accounting standards.
2.2 Financial report audit opinions
We carried out our financial audits of the university sector entities in accordance with Australian Auditing Standards. Figure 2A details the opinions we issued at the conclusion of our audits.
Figure 2A
University sector financial report audit opinions issued for 2018
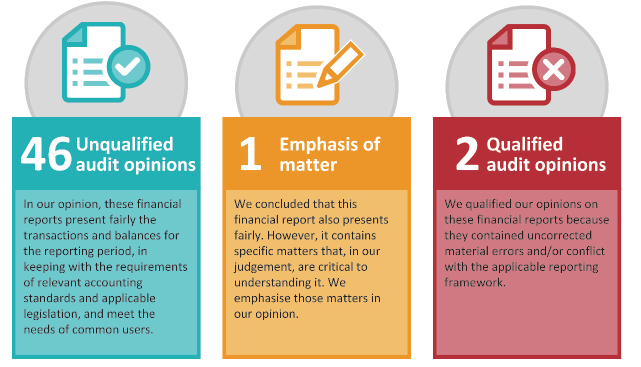
Source: VAGO.
Overall, the sector's financial reports are reliable. In 96 per cent of audit opinions we have issued to date, we concluded that the underlying financial reports do not contain uncorrected material errors. See Appendix B for details on the date and nature of audit opinions issued.
The University of Melbourne and Deakin University received qualified opinions because of the way they recognise certain types of research grant revenue in their financial reports.
Consistent with prior years, this method does not conform to Australian Accounting Standards Board's (AASB) 1004 Contributions, which requires non-reciprocal revenue to be recognised on receipt of funding. The resulting uncorrected error is material to financial statement users. We discuss this in further detail in 'Financial reporting quality' and in Part 4 of this report.
One controlled entity received an emphasis of matter paragraph because it prepared special purpose financial statements to meet the minimum reporting requirements of the Australian Charities and Not-for-profits Commission. While we opine that its financial statements do not contain material errors, we are required to report under auditing standards that those financial statements may not meet the information needs of general users.
Financial reporting quality
Two important and interrelated quality attributes of financial reporting are the timeliness of the published financial reports and the accuracy of draft reports presented for audit.
Timeliness
Timely financial reports enable users to make better informed and prompt decisions. The later financial reports are produced after year end, the less useful they become. We measure timeliness by the time taken post-year end for each university to finalise their financial statements.
The FMA requires universities to finalise their financial reports and have them audited within 12 weeks of the end of the 31 December calendar year.
As shown in Figure 2B, all eight (in 2017, seven of eight) universities met the statutory deadline for finalising their financial reports.
Figure 2B
University financial reporting timeliness for the years ended 31 December 2017 and 2018
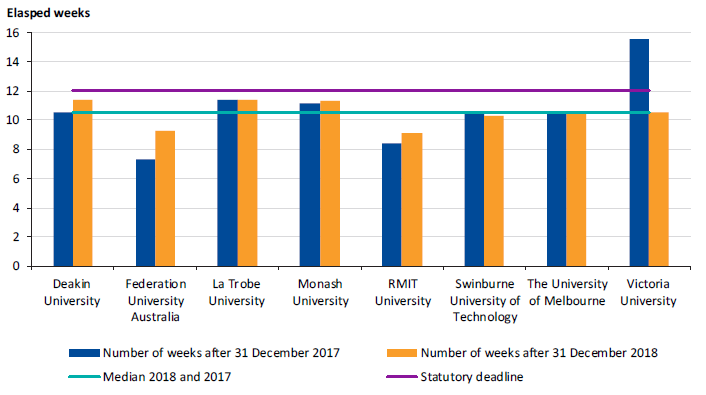
Source: VAGO.
Accuracy
Accurate financial reports do not contain material errors, and reliably represent an entity's financial performance and position.
Material errors found during the audit must be corrected by management before we can issue a clear opinion. Errors that are not corrected by management reduce the accuracy and clarity of the final financial report.
Figure 2C shows separately the net value of the adjusted and unadjusted financial statement errors we identified, as a percentage of each university's respective materiality threshold. The unadjusted errors in the financial reports of the University of Melbourne and Deakin University were material. We qualified our opinions on their financial statements.
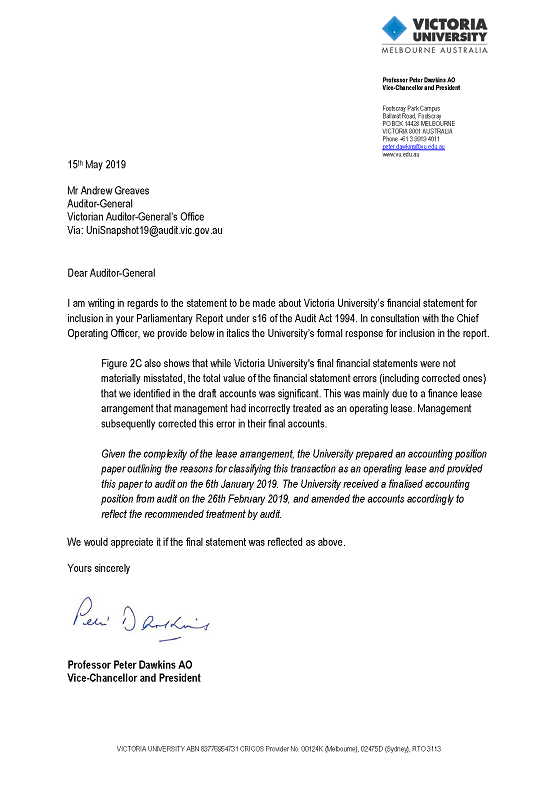
Figure 2C also shows that while Victoria University's final financial statements were not materially misstated, the total value of the financial statement errors (including corrected ones) that we identified in the draft accounts was significant. This was mainly due to a finance lease arrangement that management had incorrectly treated as an operating lease. Management subsequently corrected this error in their final accounts.
The net impact of errors we identified in the remaining five universities was well below their respective materiality thresholds. This indicates that the internal controls over financial transactions and reporting processes at those universities are robust and able to prevent and detect significant financial statement errors.
Figure 2C
University sector 2018 net adjusted and unadjusted financial statement errors as a percentage of audit materiality
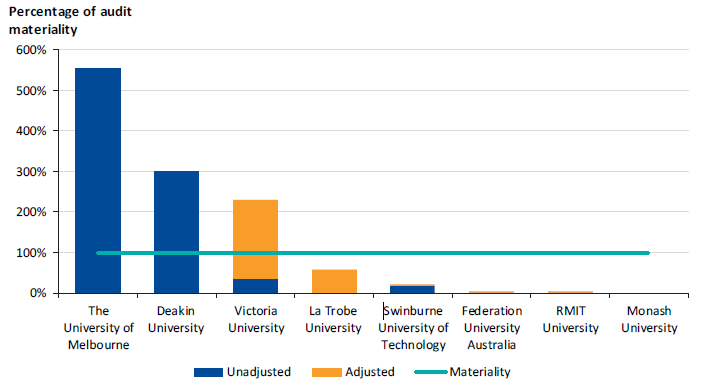
Source: VAGO.
Figure 2D summarises the number of disclosure errors we identified. There were 34 financial statement disclosure errors across the sector. Universities adjusted all but six disclosure errors, and the six unadjusted disclosure errors were not material. The high number of disclosure errors identified highlights the importance of a detailed quality review process in relation to the draft accounts.
Figure 2D
University sector 2018 adjusted and unadjusted disclosure errors
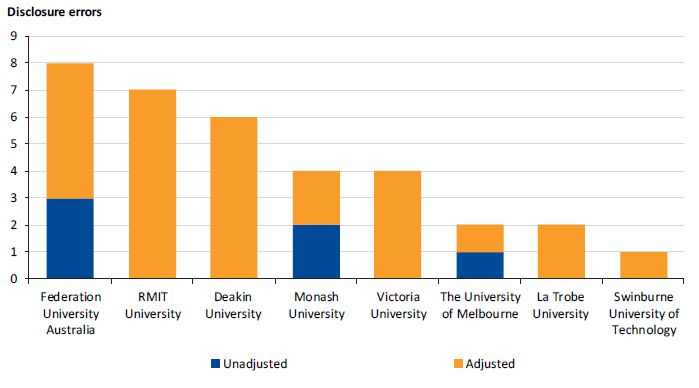
Source: VAGO.
Figure 2E summarises the common types of errors we identified during the audits.
Figure 2E
Significant dollar and disclosure errors identified across the 2018 university audits
|
Dollar errors |
We identified 28 financial statement errors across the eight universities and their controlled entities totalling $394 million. Common themes include:
|
|
Disclosure errors |
Common financial statement disclosure errors we identified related to:
|


Source: VAGO.
Introduction of AASB 9 Financial Instruments
A common theme influencing our audits of the universities' financial reports for the year ended 31 December 2018 was the required implementation of Australian Accounting Standard AASB 9 Financial Instruments, which replaces AASB 139 Financial Instruments: Recognition and Measurement.
AASB 9 introduced new classification and measurement rules for financial instruments, resulting in universities having to recognise most of their financial investments at fair value through profit and loss. Many of these investments were previously classified as 'available for sale' under AASB 139, and investment losses were recorded in balance sheet reserves. Under AASB 9, investment losses were recognised as expenditure in 2018, which directly affected the net result.
There were also several additional disclosures required because of the transition from AASB 139 to AASB 9. One of the more complex issues was that recognising unlisted equities at cost was no longer an option under AASB 9. This meant that all universities had to record such investments at fair value in their financial statements.
In many universities, net results were negatively affected by these changes introduced by AASB 9. We discuss these impacts in more detail in Section 3.2.
Internal control observations
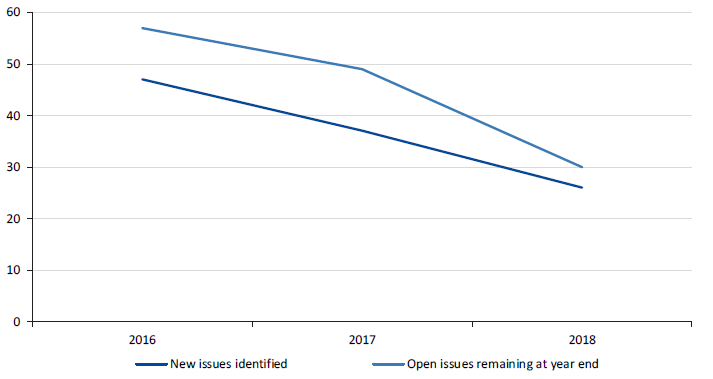
To the extent that we needed to test them, universities' internal controls for financial reporting were adequate for ensuring reliable financial reporting. We identified 26 new internal control issues during our 2018 audits. Of these new issues, six were resolved by year end. As shown in Figure 2F, the number of new issues we identify each year, as well as the number of open issues remaining at the end of each year has declined over the last three years. This indicates that the universities are actively addressing their control deficiencies.
Figure 2F
Number of new and open management letter issues in the university sector for the years ended 31 December 2016 to 2018
Source: VAGO.
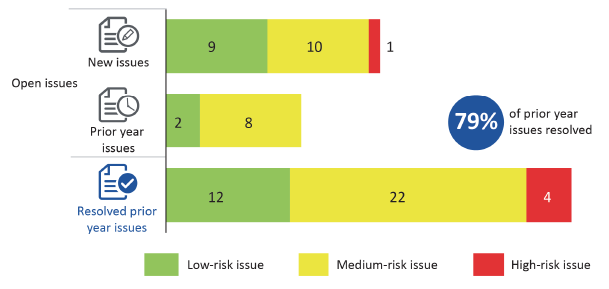
Figure 2G summarises the internal control issues we identified over 2018.
Figure 2G
Summary of university sector's new, prior year, and resolved internal control issues as at 31 December 2018, by risk ratings
Source: VAGO.
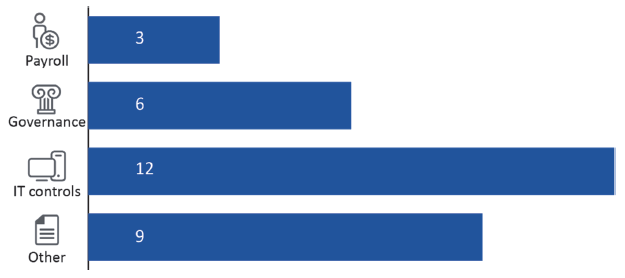
Figure 2H outlines the themes of the 30 open issues at the end of our 31 December 2018 university audits.
Figure 2H
Themes of open internal control issues at 31 December 2018
Source: VAGO.
IT control issues largely relate to weak password and user authentication settings, and a lack of monitoring and updating of user access lists. This indicates the sector needs to improve its controls around logical user access to their systems. Allowing unauthorised users to access key systems increases the sector's exposure to significant risks, including:
- fraudulent financial reporting
- misappropriation of assets
- theft or loss of confidential and/or personal information.
None of the open IT issues this year were rated high. However, IT-related control issues have been one of the larger groups of control issues we have identified in our audits over the last few years. This indicates a continuing risk for the sector.
The only high-risk issue identified during 2018 related to payroll. We found control weaknesses around the processing of casual employees and the timeliness of termination payments at Victoria University.
Governance issues covered a variety of topics, but a common theme was improvements needed to internal policies, particularly in the areas of fraud monitoring and asset maintenance. None of the governance-related issues were rated high.
3 Financial performance and sustainability
In this part of the report, we summarise the financial outcomes of the university sector for the year ended 31 December 2018 and comment on the sustainability of the sector in the context of information we obtained and observed during our audits.
3.1 Conclusion
The sector continues to be financially sound.
3.2 Financial performance highlights
Figure 3A shows that the sector's revenues and expenses continue to increase. Revenue growth is consistent with increasing student numbers, reflecting strong demand for university-level higher education, with expenditure also increasing proportionately to service this demand. However, part of the 2018 expense increase relates to accounting changes introduced by AASB 9. These changes resulted in:
- investment losses accumulated in prior years being recognised as expenditure
- unlisted equities being recognised at fair value (previously at cost), which in many cases resulted in their carrying values being written down to nil with the devaluation being recognised as an expense and reducing the net result.
Figure 3A shows that the sector's net result, adjusted for this one-off circumstance, has improved slightly over the 2018 period.
Figure 3A
Financial performance of the university sector for the years ended 31 December 2014 to 2018
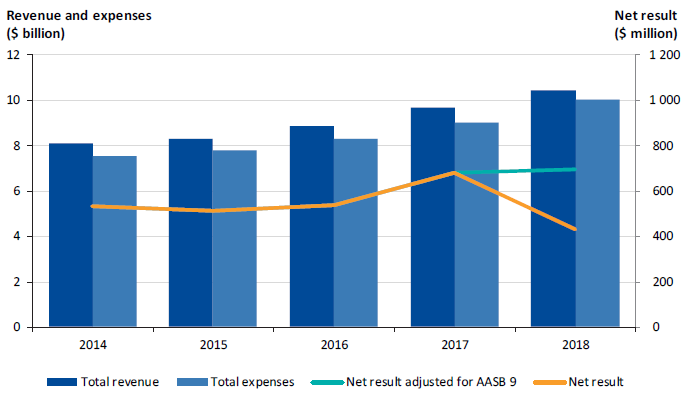
Note: Figures have been adjusted for the two universities with qualified audit opinions.
Source: VAGO.
In 2017, we observed indications of unsustainable operations at Federation University Australia and Victoria University. Since then, both universities have taken steps to streamline their operations by reducing unnecessary expenditure and increasing the efficiency of their employee base.
Federation University Australia also increased its student numbers through the provision of additional course offerings, and the acquisition of Monash University's Berwick operations.
Victoria University trialled a new model of course delivery for its first-year students called 'Flexible Block Study'. It delivers course modules to the students one at a time, over shorter and more intensive periods. In contrast, the traditional model requires students to complete several modules concurrently over a full semester. This new course delivery model has resulted in some operational efficiencies and boosted student numbers due to the popularity of the format.
Because of their efforts, both universities have reversed their medium-term negative trends and posted positive net results in 2018, as shown in Figure 3B.
Figure 3B
Net results for Federation University Australia and Victoria University as at 31 December 2014 to 2018
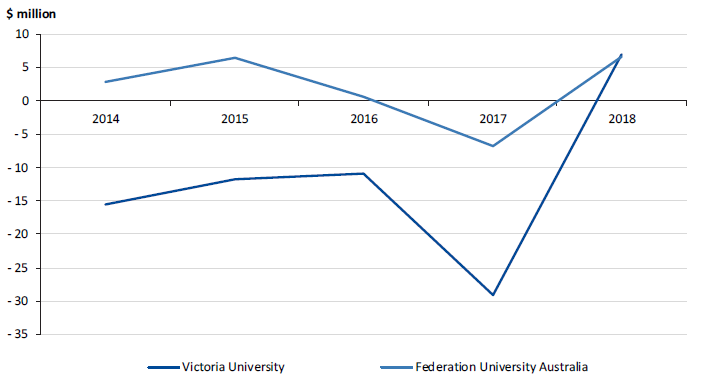
Source: VAGO.
3.3 Financial position highlights
Figure 3C shows the sector's financial position over the last five years.
Figure 3C
Total assets, total liabilities and net assets of the university sector as at 31 December 2014 to 2018
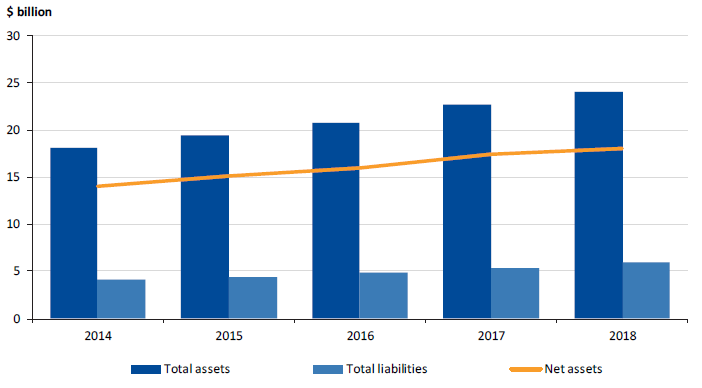
Note: Figures have been adjusted for the two universities with qualified audit opinions.
Source: VAGO.
|
The adjusted liquidity ratio includes non-current financial investments as most of them can be converted to cash or cash equivalents at short notice and are available to the universities to meet any liabilities if required. |
The value of net assets held by the sector increased during 2018, consistent with its positive net result, and the five-year trend. As seen in Figure 3C, the sector has a very strong net asset position. This reflects its large portfolio of land, infrastructure assets and equipment, which the universities use to deliver their services. However, these assets are not easily liquidated, and cannot be relied upon if a university requires cash to meet its debts.
The adjusted liquidity ratio is a better indication of whether the universities are likely to be able to service their debt obligations in the immediate future. Figure 3D shows that, other than RMIT University, all the universities have enough liquid assets to meet their short-term liabilities.
Figure 3D
Adjusted liquidity ratio for universities at 31 December 2017 and 2018
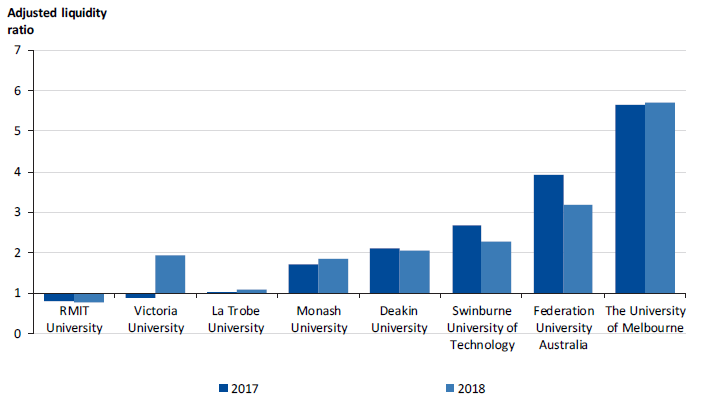
Source: VAGO.
RMIT University proactively monitors its cash position and ensures there is enough cash on hand to meet its obligations as they fall due. This is supported by its historical performance. In both 2017 and 2018, RMIT University had a strong net result and a net cash inflow that was significantly greater than its net current liability. This reduces the risk of it being unable to meet its short-term obligations.
Victoria University has improved its liquidity position significantly from 2017. Part of this improvement was due to the receipt of a large amount of cash from the sale of one of its central business district campuses.
3.4 Student volumes
Student enrolment trends are one of the strongest indicators of the sustainability of the sector. These figures drive the sector's operational activity levels, including the two largest sources of income—student fees and Commonwealth student assistance grants. Figure 3E shows the five-year trend in the total effective full-time student load (EFTSL), as well as the proportion of domestic and overseas students.
Figure 3E
University sector number and proportion of domestic and overseas EFTSL for the years ended 31 December 2014 to 2018
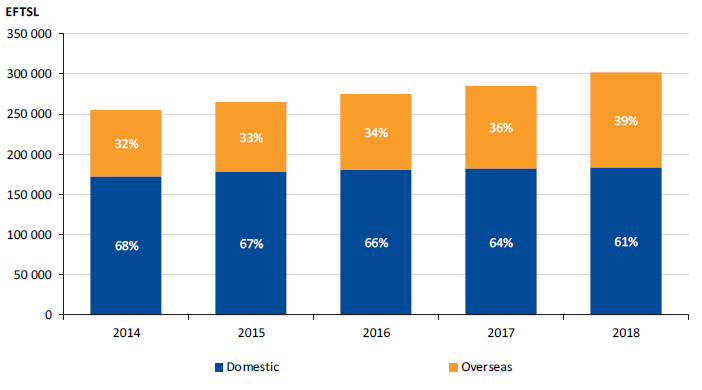
Source: VAGO.
As seen above, the total EFTSL has steadily increased over the last five years. Domestic EFTSL continues to increase at a gradual but steady rate. However, the majority of the sector's growth is driven by overseas students, who now make up almost 40 per cent of the sector's higher education student load.
The greater inflow of overseas students reduces the sector's reliance on domestic fee income and government funding. However, international students are a less reliable customer base than domestic students, as numbers of the former are subject to change due to external factors in other nations.
As the sector's dependence on fee revenue from overseas students increases, it will need to monitor circumstances abroad, and actively manage its recruitment programs to increase the diversity of the source countries that make up the overseas student base.
4 Looking forward
In this part of the report, we discuss the significant upcoming changes in accounting standards that will impact the university sector's financial reporting.
4.1 Conclusion
Six of the eight universities are well progressed in their preparations for the significant changes to the accounting standards that will apply in 2019.
4.2 Upcoming changes to Australian Accounting Standards
In our prior year report Results of Audits 2017: Universities, we highlighted that major changes to Australian Accounting Standards would apply to the university sector for the first time, for the reporting period ending 31 December 2019. These included several new standards:
- AASB 15 Revenue from Contracts with Customers
- AASB 1058 Income for Not-for-profit Entities
- AASB 16 Leases.
Revenue standards AASB 15 and AASB 1058
As described in our 2017 report, the new revenue standards AASB 15 and AASB 1058 introduce significant changes in the way universities will recognise revenue. Under AASB 15, contractual revenue will be recognised by the universities when their customers benefit from the goods and/or services they are paying for under the contract. Currently, under AASB 118 Revenue, service revenue is recognised with reference to the stage of completion of the associated service.
Another significant change is that transactions no longer have to be reciprocal before the recognition of revenue can be deferred. This is because AASB 15 also applies to transactions where goods or service benefits are transferred to a third party on behalf of the customer. Such transactions are considered non-reciprocal and any income would be recognised as upfront contributions under AASB 1004 Contributions.
This change is significant to the sector, especially in accounting for research grants. These grants have been considered 'non-reciprocal' revenue, since the relevant funding bodies, such as the Commonwealth Government, do not benefit directly from the research performed. This means that under current accounting standards, the grant income should be recognised up-front, once funds are received or receivable. This creates a mismatch in the timing of when grant income is recognised and when the relevant research is conducted, which may be over the course of several years.
This timing mismatch has been a contentious issue in the university sector for a number of years, with both the University of Melbourne and Deakin University receiving qualifications on their financial statements for deferring the recognition of their revenue.
With the introduction of AASB 15, the sector will need to review its current accounting practices for research grants to determine whether the standard's new requirements will help to resolve the timing mismatch. Our experience is that applying AASB 15 will require significant effort and judgement from the sector. Contractual arrangements and their terms must meet specific criteria for AASB 15 to apply for grant funding deferral. To apply their desired accounting outcome, the universities will need to demonstrate that the research grant agreements meet these criteria.
If it is determined that any research grant agreements fall outside the scope of AASB 15, it is likely that AASB 1058 will apply. This standard effectively replaces AASB 1004 and requires income for universities to be recognised up front in most cases where other accounting standards do not apply.
These revenue standards changes do not affect the recognition timing of the sector's most significant revenue streams that are paid in advance—student fees and student assistance grants. This is because students benefit from higher education as the service is delivered, which aligns to the stage of completion of the education service provided. Therefore, matching the revenue to the expense period is allowed.
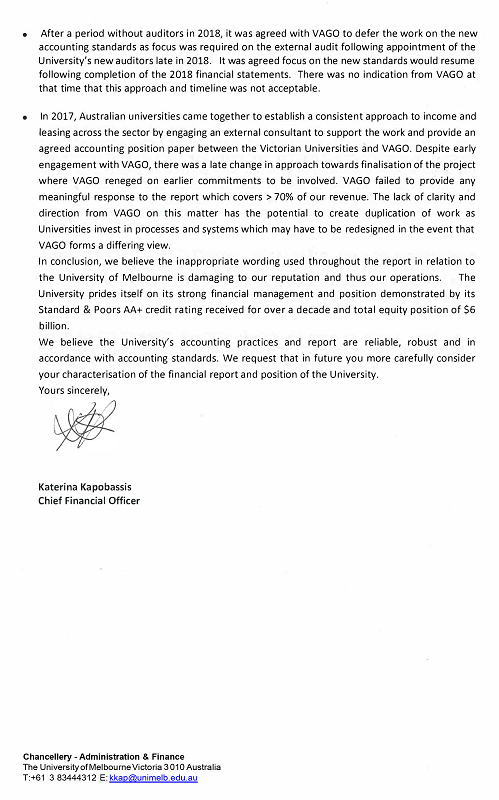
In 2017, the university sector in Australia (including all Victorian universities) engaged an external specialist to perform an analysis of Commonwealth funding, including its student assistance and research assistance grants.
A draft of this paper was provided to the national and state audit offices in early 2018. While we agreed with the high-level principles described in the paper, our feedback to the external specialist and the Victorian university sector was that the universities still needed to undertake their own detailed work. They needed to review the underlying terms within their agreements in more detail before concluding on the correct accounting treatments, especially the research grants from the Australian Research Council and the National Health and Medical Research Council.
The Victorian universities that have completed their accounting treatment assessment of research grants to this point have concluded that it will be appropriate to apply AASB 15 to most of their publicly funded research grants. However, this issue is also under active consideration more broadly by the AASB, with significant input being provided by key accounting and audit firms around Australia.
Based on our observations during the 2018 audit cycle, we assessed how prepared the universities are for implementing the new revenue standards in 2019. We looked at four areas of transition, which are:
- whether a detailed and documented plan had been developed prior to 31 December 2018 to ensure readiness for timely compliance with the standards
- whether the selected approach outlined in the plan was appropriate and sufficiently detailed to ensure compliance with the new standards
- the level of universities' engagement with VAGO around their proposed treatment of revenue, either directly or through our contracted audit service providers
- how far the universities had implemented their plans as at March 2019, and whether they were able to quantify the estimated impacts of the new standards and disclose them in their 2018 financial statements.
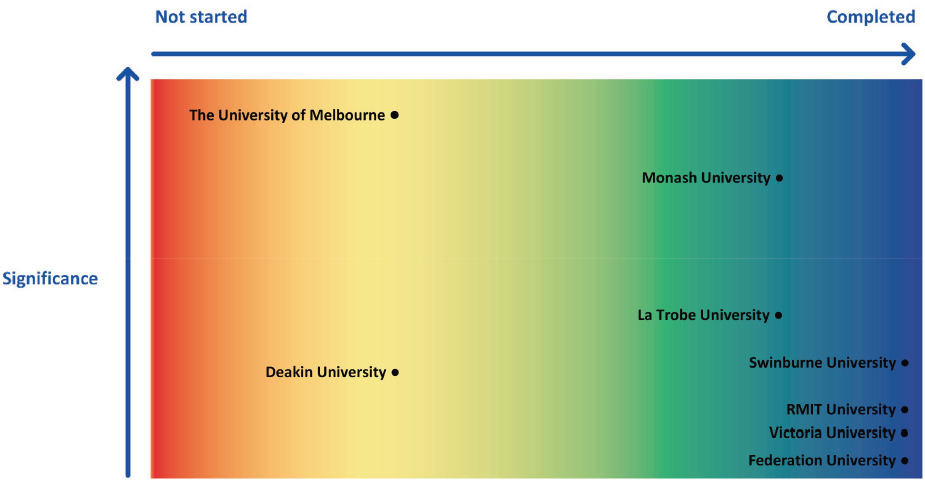
Figure 4A details the progress of each university in their assessment and implementation of the new revenue standards, and the significance of their research grants in their financial statements.
Figure 4A
Status of universities' transition to the new revenue standards as at March 2019
Source: VAGO.
Encouragingly, most Victorian universities had made reasonable progress towards concluding these detailed assessments:
- Six of the eight universities actively engaged with us over the course of 2018 on the appropriate future accounting treatment of their grants, including providing us with sample agreements to support their current assessments and positions in line with the new standards.
- Six universities completed a detailed and rigorous review of most of their research grants.
- Five universities disclosed in their 2018 financial reports a quantification of the expected impact of the changes.
- Although Monash University was able to quantify the estimated impact on its financial statements, it did not disclose this estimate as management believed it was not sufficiently reliable. Management was still assessing the treatment of its commercial research agreements, which had highly variable and unique contractual terms. This was appropriate in the circumstances.
- Five universities had either significantly progressed or completed the system and process changes needed for ongoing compliance with the new revenue standards.
Appendix C further details our observations on each university's progress in implementing these new revenue standards.
As Go8 universities, the University of Melbourne and Monash University accounted for 80.2 per cent of the sector's research grant revenue. Of the two, Monash University was the more advanced in its implementation of systems and processes to support the recognition of revenue under the new accounting standards, including accounting for research grants. As at March 2019, it had implemented a system solution to enable it to track the completion of performance obligations to a high level of precision and to automate revenue recognition across a range of complex research grant agreements.
Monash University applied the new system after undertaking a rigorous implementation process, which included:
- a detailed analysis of its key revenue contracts against the specifications of AASB 15, including an in-depth review of a significant, representative portion of its research contracts
- consultation with external specialists
- consultation with research faculties and other key stakeholders
- engagement with auditors from early 2018, including providing us with their proposed treatments and supporting evidence.
While considerable resources were spent on this project, it was necessary due to the volume, variety and complexity of research funding agreements Monash University has as a Go8 member.
Conversely, the University of Melbourne, which is also a Go8 member and has the highest amount of research grant revenue among the Victorian universities:
- had not yet performed a sufficiently detailed analysis of its own underlying research grant agreements—a material component of their revenue—as at 1 April 2019
- has not yet shared with us any detailed evidence to support its position and disclosures regarding the impact of the upcoming changes to its financial statements.
We also noted that Deakin University was in a similar position to the University of Melbourne, and in addition, had not yet developed a detailed transition and compliance plan as at 31 December 2018.
We understand that both these universities still hold the view that their research grants should be recognised under AASB 15, as suggested by the high-level advice from the sector's external specialist. As a result, both these universities disclosed that they did not expect a material impact from the changes in the accounting standards.
However, delaying the detailed analysis of their research grant agreements puts these universities at risk of being unprepared for the transition to the new revenue standards during the 2019 financial year, as significant work may be required to comply with the new requirements and to be prepared for audit.
AASB 16 Leases
The changes introduced by AASB 16, while significant and requiring judgement, are generally less complex for the university sector than those introduced by AASB 15 and AASB 1058.
The main change is that universities that lease assets from other parties under operating leases will now have to recognise their right to use those leased assets on their balance sheet, with a corresponding liability for the remaining lease payments. This will eventually include peppercorn leases for which the universities will have to determine the fair value of the leased asset—the AASB has temporarily deferred this treatment until further notice. Under the current standard AASB 117 Leases, operating lease payments are mainly recognised as expenses on the income statement.
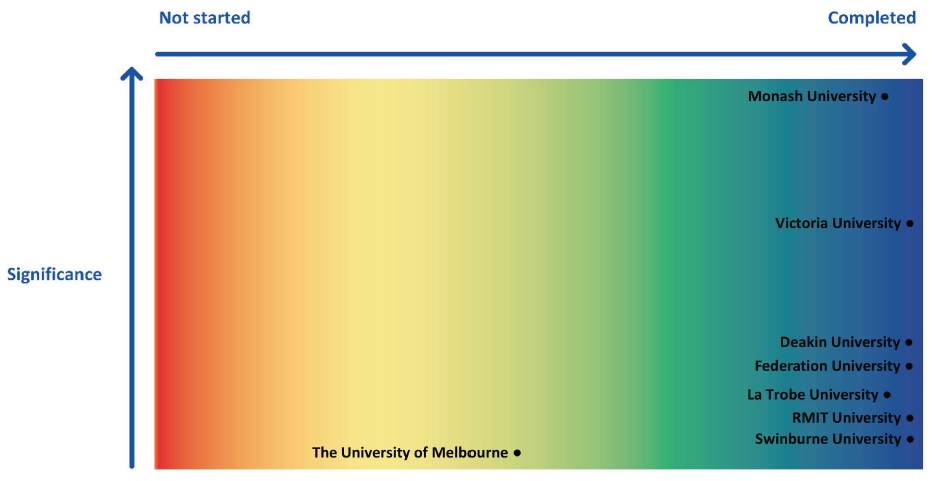
Figure 4B shows that the sector is generally more progressed with its transition to AASB 16 than it is with AASB 15 and AASB 1058. This is due in part to the lower complexity and the nature of the disclosures involved. We will be conducting further reviews of the sector's implementation of this standard during 2019.
Appendix C summarises the progress of each of the universities in transitioning to AASB 16.
Figure 4B
Status of universities' transition to AASB 16
Source: VAGO.
4.3 Recommendation
We recommend that the University of Melbourne and Deakin University ensure they are ready for transition to the new revenue standards by:
- prioritising their assessment of the accounting treatment for their research grants
- actively engaging with us, the AASB, and the rest of the sector around their assessment and implementation.
Appendix A. Audit Act 1994 section 16—submissions and comments
We have consulted with DET and the eight public universities in Victoria, and we considered their views when reaching our conclusions. As required by section 16(3) of the Audit Act 1994, we gave a draft copy of this report, or relevant extracts, to those agencies and asked for their submissions and comments. We also provided a copy of the report to the Department of Premier and Cabinet.
Responsibility for the accuracy, fairness and balance of those comments rests solely with the agency head.
Responses were received as follows:
- DET
- The University of Melbourne
- Deakin University
- Victoria University
- La Trobe University
RESPONSE provided by the Secretary, DET
RESPONSE provided by the CFO, the University of Melbourne
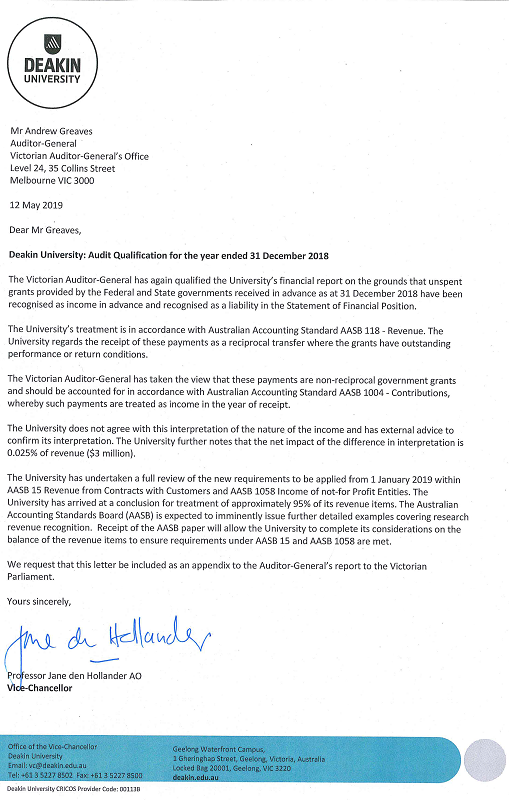
RESPONSE provided by the Vice-Chancellor, Deakin University
RESPONSE provided by the Vice-Chancellor and President, Victoria University
RESPONSE provided by the Vice-Chancellor, La Trobe University
Appendix B. Audit opinions
Figure B1 lists the entities included in this report. It details the nature of the audit opinion for their 2018 financial reports, and the date it was issued to each entity.
Figure B1
Audit opinions issued for universities and their controlled entities for the year ended 31 December 2018
|
Entity |
Clear audit opinion issued |
Auditor-General's report signed date |
|---|---|---|
|
Deakin University |
Qualified(a) |
26 March 2019 |
|
Deakin Cyber Security Accelerator Pty Ltd |
✔ |
9 May 2019 |
|
Deakin Residential Services Pty Ltd |
✔ |
8 May 2019 |
|
FLAIM Systems Pty Ltd |
✔ |
29 April 2019 |
|
Unilink Limited |
✔ |
8 May 2019 |
|
Universal Motion Simulator Pty Ltd |
✔ |
29 April 2019 |
|
Federation University Australia |
✔ |
11 March 2019 |
|
Brisbane Education Services Pty Ltd |
✔ |
20 March 2019 |
|
Datascreen Pty Ltd |
✔ |
11 March 2019 |
|
Inskill Pty Ltd |
✔ |
11 March 2019 |
|
The School of Mines and Industries Ballarat Limited |
✔ |
11 March 2019 |
|
La Trobe University |
✔ |
25 March 2019 |
|
Unitemps La Trobe Ltd |
✔ |
6 May 2019 |
|
Monash University |
✔ |
25 March 2019 |
|
Monash Accommodation Services Pty Ltd |
✔ |
22 March 2019 |
|
Monash College Pty Ltd |
✔ |
4 March 2019 |
|
Monash Commercial Pty Ltd |
✔ |
28 February 2019 |
|
Monash Custodians Pty Ltd |
n/a |
n/a |
|
Monash Investment Holdings Pty Ltd |
✔ |
21 March 2019 |
|
Monash Investment Trust |
✔ |
21 March 2019 |
|
Monash Property South Africa Pty Ltd |
n/a |
n/a |
|
Monash University Foundation Pty Ltd |
✔ |
7 March 2019 |
|
Monash University Foundation Trust |
✔ |
7 March 2019 |
|
Monash University Indonesia Limited |
n/a |
n/a |
|
RMIT University |
✔ |
12 March 2019 |
|
RMIT Holdings Pty Ltd |
✔ |
15 February 2019 |
|
RMIT Indonesia Pty Ltd |
✔ |
12 February 2019 |
|
RMIT Online Pty Ltd |
✔ |
12 February 2019 |
|
RMIT Spain SL |
✔ |
15 February 2019 |
|
RMIT Training Pty Ltd |
✔ |
6 February 2019 |
|
RMIT University Vietnam LLC |
✔ |
15 February 2019 |
|
Swinburne University of Technology |
✔ |
15 March 2019 |
|
Capsular Technologies Pty Ltd |
✔ |
25 March 2019 |
|
National Institute of Circus Arts Limited |
✔ |
29 March 2019 |
|
Swinburne Intellectual Property Trust |
✔ |
2 April 2019 |
|
Swinburne International (Holdings) Pty Ltd |
✔ |
8 April 2019 |
|
Swinburne Student Amenities Association Ltd |
✔ |
2 April 2019 |
|
Swinburne Ventures Ltd |
✔ |
1 April 2019 |
|
The University of Melbourne |
Qualified(a) |
22 March 2019 |
|
Australian Music Examinations Board (Victoria) Ltd |
✔ |
17 April 2019 |
|
Goulburn Valley Equine Hospital Pty Ltd |
n/a |
n/a |
|
Melbourne University Publishing Ltd |
n/a |
n/a |
|
Melbourne Business School Foundation Ltd |
EOM(a) |
9 May 2019 |
|
Melbourne Business School Ltd |
✔ |
9 May 2019 |
|
Melbourne Teaching Health Clinics Ltd |
n/a |
n/a |
|
Mt Eliza Graduate School of Business and Government Ltd |
✔ |
9 May 2019 |
|
Nossal Institute Ltd |
✔ |
6 May 2019 |
|
UOM Commercialisation Pty Ltd |
✔ |
17 April 2019 |
|
UM Commercialisation Trust |
✔ |
29 April 2019 |
|
UOM Commercial Ltd |
✔ |
17 April 2019 |
|
Victoria University |
✔ |
22 March 2019 |
|
Victoria University Enterprises Pty Ltd |
✔ |
22 March 2019 |
|
Victoria University Foundation |
✔ |
25 March 2019 |
|
Victoria University Foundation Ltd |
✔ |
25 March 2019 |
|
Victoria University International Pty Ltd |
✔ |
5 April 2019 |
(a) Refer to our discussion in Section 2.2 for further information on the audit opinions issued.
Note: n/a = not applicable. Financial reports were not yet signed, so we have not been able to issue an audit opinion for this entity at the date of this report.
Source: VAGO.
Appendix C. Preparedness for new accounting standards
Our assessment of the readiness of individual universities for the new accounting standards is detailed in Figures C1 and C2.
Figure C1
Readiness of universities for accounting standards AASB 15 and 1058 as at March 2019
|
Part of Group of Eight |
||||||||
|---|---|---|---|---|---|---|---|---|
|
Criteria – AASB 15 and AASB 1058 |
The University of Melbourne |
Monash University |
Deakin University |
Federation University Australia |
La Trobe University |
RMIT University |
Swinburne University of Technology |
Victoria University |
|
Planning |
||||||||
|
Developed a detailed plan for complying with the new standards |
✔ |
✔ |
✘* |
✔ |
✔ |
✔ |
✔ |
✔ |
|
Plan shared with and approved by the audit committee |
✔ |
✔ |
✔ |
✔ |
✘ |
✔ |
✔ |
✔ |
|
Assessment approach and outcomes |
||||||||
|
Assessed all relevant financial statement line items affected, including a: |
✔ |
✔ |
✔ |
✔ |
✔ |
✔ |
✔ |
✔ |
|
✘ |
✔ |
✔ |
✔ |
✔ |
✔ |
✔ |
✔ |
|
✘ |
✔ |
✘ |
✔ |
✔ |
✔ |
✔ |
✔ |
|
The assessment of contractual terms was sufficiently detailed to arrive at a reasonable conclusion with regards to treatment in accordance with the standards |
✘ |
✔ |
✘ |
✔ |
✔ |
✔ |
✔ |
✔ |
|
Arrived at a conclusion as to the treatment of relevant financial statement line items |
✔ |
✔ |
✘ |
✔ |
✔ |
✔ |
✔ |
✔ |
|
Engagement with audit |
||||||||
|
Engaged timely (prior to 31 December 2018) discussion with the auditors regarding the transition and implementation of the new standard, including providing the auditors with: |
||||||||
|
✘ |
✔ |
✔ |
✔ |
✔ |
✔ |
✔ |
✔ |
|
✘ |
✔ |
✘ |
✔ |
✔ |
✔ |
✔ |
✔ |
|
Implementation |
||||||||
|
Designed processes and systems to enable compliance with its proposed treatment |
✘ |
✔ |
✘ |
✔ |
✔ |
✔ |
✔ |
✔ |
|
Able to quantify an estimate of the impact to their financial statements from the changes to accounting policy arising out of the new standards |
✘ |
✔ |
✘*** |
✔ |
✔ |
✔ |
✔ |
✔ |
|
Disclosed these estimates in their 31 December 2018 financial statements |
✔*** |
✘** |
✔*** |
✔ |
✔ |
✔ |
✔ |
✔ |
|
Significance |
||||||||
|
Commonwealth research grants for the year ended 31 December 2018 ($ million) |
472.9 |
365.7 |
53.6 |
4.7 |
52.1 |
50.5 |
33.4 |
12.8 |
|
Total revenue for the year ended 31 December 2018 ($ million) |
2 731.0 |
2 715.6 |
1 235.2 |
330.9 |
802.9 |
1 439.6 |
734.0 |
453.9 |
|
Significance of Commonwealth research grants as a percentage of total revenue |
17.3% |
13.5% |
4.3% |
1.4% |
6.5% |
3.5% |
4.6% |
2.8% |
Note: Figures have been adjusted for the two universities with qualified audit opinions.
Note: * Deakin University had developed a high-level plan which did not include assignment of key responsibilities or a timeline for implementation.
Note: ** Monash University was able to quantify an estimate but was not sufficiently confident in the estimate due to the variability in private research contracts.
Note: *** These universities disclosed that the impact to their financial statements will not be material based on the conclusion that the accounting treatment will not change significantly. We have not been provided with sufficient evidence to support this conclusion.
Source: VAGO.
Figure C2
Readiness of universities for accounting standard AASB 16 as at March 2019
|
Part of Group of Eight |
||||||||
|---|---|---|---|---|---|---|---|---|
|
Criteria – AASB 16 |
The University of Melbourne |
Monash University |
Deakin University |
Federation University Australia |
La Trobe University |
RMIT University |
Swinburne University of Technology |
Victoria University |
|
Planning |
||||||||
|
Developed a detailed plan for complying with the new standards |
✔ |
✔ |
✔ |
✔ |
✔ |
✔ |
✔ |
✔ |
|
Plan shared with and approved by the audit committee |
✔ |
✔ |
✔ |
✔ |
# |
✔ |
✔ |
✔ |
|
Assessment approach and outcomes |
||||||||
|
Performed assessment of all relevant financial statement line items affected including a: |
✔ |
✔ |
✔ |
✔ |
✔ |
✔ |
✔ |
✔ |
|
✔ |
✔ |
✔ |
✔ |
✔ |
✔ |
✔ |
✔ |
|
The assessment was sufficiently detailed to arrive at a reasonable conclusion with regards to treatment in accordance with the standards. |
✘ |
✔ |
✔ |
# |
✔ |
✔ |
✔ |
✔ |
|
Arrived at a conclusion as to the treatment of relevant financial statement line items |
✔ |
✔ |
✔ |
✔ |
✔ |
✔ |
✔ |
✔ |
|
Engagement with audit |
||||||||
|
Well-engaged in timely (prior to 31 December 2018) discussion with the auditors regarding the transition and implementation of the new standard, including providing the auditors with: |
||||||||
|
✘ |
✔* |
✔ |
✔* |
✔ |
✔ |
✔ |
✔ |
|
✘ |
✔* |
✔ |
✔* |
✔ |
✔ |
✔ |
✔ |
|
Implementation |
||||||||
|
Designed processes and systems to enable compliance with its proposed treatment |
✘ |
✔ |
✔ |
✔ |
✔ |
✔ |
✔ |
✔ |
|
Able to quantify an estimate of the impact to their financial statements from the changes to accounting policy arising out of the new standards |
✘ |
✔ |
✔ |
✔ |
✔ |
✔ |
✔ |
✔ |
|
Disclosed these estimates in their 31 December 2018 financial statements |
✘ |
✘** |
✔ |
✔*** |
✔ |
✔ |
✔ |
✔ |
|
Significance |
||||||||
|
Total operating lease commitments as at 31 December 2018 ($ million) |
52.7 |
712.8 |
63.7 |
12.8 |
35.4 |
68.2 |
14.9 |
85.2 |
|
Total property, plant and equipment (PPE) as at 31 December 2018 ($ million) |
4 581.9 |
3 256.9 |
1 699.9 |
408.3 |
1 377.6 |
2 790.0 |
901.2 |
853.1 |
|
Significance of operating lease commitments as a percentage of total PPE |
1.2% |
21.9% |
3.7% |
3.1% |
2.6% |
2.4% |
1.7% |
10.0% |
Note: # We have not completed our review of the assessments performed by Federation University Australia and have not concluded as to whether they have gone into sufficient detail.
Note: * These universities were ready to discuss and provide the required information, however we have not engaged with them due to other priorities at the time.
Note: ** Monash University was able to quantify an estimate, but elected not to disclose it as the need to use assumptions around future interest rates in the underlying calculations made the estimate insufficiently reliable in their view.
Note: *** Federation University Australia disclosed that the impact to their financial statements will not be material.
Source: VAGO.
Appendix D. Control issues risk ratings
Figure D1 shows the risk ratings applied to issues raised in management letters. It also details what they represent and the expected timeline for the issue to be resolved.
Figure D1
Risk definitions applied to issues reported in audit management letters
|
Rating |
Definition |
Management action required |
|---|---|---|
|
High |
The issue represents:
|
Requires executive management to correct the misstatement in the financial report, or address the issue, as a matter of urgency to avoid a modified audit opinion. Requires immediate management intervention with a detailed action plan to be implemented within one month. |
|
Medium |
The issue represents:
|
Requires management intervention with a detailed action plan implemented within three to six months. |
|
Low |
The issue represents:
|
Requires management intervention with a detailed action plan implemented within six to 12 months. |
Source: VAGO.
Appendix E. Financial and non-financial sustainability indicators
Figure E1 shows financial and non-financial sustainability indicators used to assess the financial sustainability risks of universities. These indicators should be considered collectively and are more useful when assessed over time as part of a trend analysis.
Our analysis of financial sustainability risk in this report reflects on the position of each university.
Figure E1
Financial and non-financial sustainability indicators, formulas and descriptions
|
Indicator |
Formula |
Description |
|---|---|---|
|
Net result margin (%) |
Net result/Total revenue |
A positive result indicates a surplus, and the larger the percentage, the stronger the result. A negative result indicates a deficit. Operating deficits cannot be sustained in the long term. The net result and total revenue are obtained from the comprehensive operating statement. The adjusted net result margin is the net result margin adjusted for the one-off accounting changes introduced by AASB 9 in 2018. |
|
Liquidity (ratio) |
Current assets/ Current liabilities |
This measures the ability to pay existing liabilities in the next 12 months. A ratio of one or more means that there are more cash and liquid assets than short-term liabilities |
|
Adjusted liquidity (ratio) |
(Current assets + Non-current financial investments)/ Current liabilities |
Liquidity ratio adjusted to include non-current financial investments, since most of these can be converted to cash or cash equivalents at short notice and are available to the universities to meet any liabilities if required. The ratio should ideally be above 1, indicating that there are sufficient liquid assets to meet short-term liabilities. |
|
Capital replacement (ratio) |
Cash outflows for property, plant and equipment/ Depreciation |
Comparison of the rate of spending on infrastructure with its depreciation. Ratios higher than 1:1 indicate that spending is faster than the depreciating rate. This is a long-term indicator, as capital expenditure can be deferred in the short term if there are insufficient funds available from operations and borrowing is not an option. Cash outflows for infrastructure are taken from the cashflow statement. Depreciation is taken from the comprehensive operating statement. |
|
Internal financing (%) |
Net operating cashflow/Net capital expenditure |
This measures the ability of an entity to finance capital works from generated cashflow. The higher the percentage, the greater the ability for the entity to finance capital works from their own funds. Net operating cashflows and net capital expenditure are obtained from the cashflow statement. Note: The internal financing ratio cannot be less than zero. Where a calculation has produced a negative result, this has been rounded up to 0 per cent. |
|
Debt to equity (%) |
Total borrowings/ Equity |
This measures the reliance on debt as a source of funding. A higher ratio indicates greater reliance on debt and an increased risk of insolvency. |
|
Cost of debt (%) |
Finance costs/Total borrowings |
This measures the effective rate of interest and other costs paid on borrowings. |
|
Employee benefits ratio (%) |
Employee expenses/ Total revenue |
This measures how efficiently each university uses its staff to deliver revenue-generating services. Generally, a smaller ratio indicates a more efficient and sustainable workforce. |
|
Repairs and maintenance to depreciation (%) |
Repairs and maintenance expenses /Depreciation |
This measures the rate of assets being replaced or renewed. Generally, a ratio above 100 per cent indicates long-term assets are being adequately renewed. |
|
Effective full-time student load (EFTSL) to employee full-time equivalent (FTE) (ratio) |
Total EFTSL/Total FTE employees |
This measures the adequacy of available resources per student load. |
|
Employee expenses per EFTSL (ratio) |
Employee expenses/ Total EFTSL |
This measures the cost of employees per student. Generally, a smaller ratio indicates greater cost efficiency. |
|
Operating expenses per EFTSL (ratio) |
Operating expenses/ Total EFTSL |
This measures the operational cost per student. Generally, a smaller ratio indicates greater cost efficiency. |
Source: VAGO.
Financial and non-financial sustainability analysis results
Figures E2 to E9 show the financial and non-financial sustainability indicators for each university and its controlled entities (each consolidated university), for the financial years ended 31 December 2014 to 31 December 2018.
Figure E2
Deakin University
|
2014 |
2015 |
2016 |
2017 |
2018 |
|
|---|---|---|---|---|---|
|
Net result margin |
7.04% |
7.16% |
5.10% |
9.72% |
4.40% |
|
Adjusted net result margin |
N/A |
N/A |
N/A |
N/A |
7.42% |
|
Liquidity |
1.26 |
1.28 |
0.93 |
0.96 |
0.77 |
|
Adjusted liquidity |
2.05 |
2.14 |
2.02 |
2.10 |
2.05 |
|
Capital replacement |
1.05 |
1.42 |
2.01 |
1.61 |
1.84 |
|
Internal financing |
215% |
165% |
110% |
145% |
126% |
|
Debt to equity |
0.00% |
N/A |
N/A |
N/A |
#N/A |
|
Cost of debt |
N/A |
N/A |
N/A |
N/A |
N/A |
|
Employee benefits ratio |
56.06% |
54.19% |
56.50% |
54.07% |
55.24% |
|
Repairs and maintenance to depreciation |
69.14% |
61.54% |
63.81% |
54.27% |
54.98% |
|
EFTSL to Employee FTE |
8.75 |
8.79 |
8.39 |
8.45 |
8.03 |
|
EFTSL ($'000) |
14.20 |
13.86 |
15.10 |
15.38 |
16.39 |
|
Operating expenses per EFTSL ($'000) |
21.53 |
21.44 |
23.22 |
23.36 |
25.37 |
Source: VAGO.
Figure E3
Federation University Australia
|
2014 |
2015 |
2016 |
2017 |
2018 |
|
|---|---|---|---|---|---|
|
Net result margin |
1.02% |
2.33% |
0.20% |
-2.54% |
2.00% |
|
Adjusted net result margin |
N/A |
N/A |
N/A |
N/A |
2.00% |
|
Liquidity |
2.64 |
3.18 |
2.78 |
2.36 |
1.76 |
|
Adjusted liquidity |
2.65 |
3.31 |
4.05 |
3.91 |
3.18 |
|
Capital replacement |
0.46 |
0.50 |
0.48 |
1.26 |
1.52 |
|
Internal financing |
369% |
206% |
12% |
25% |
166% |
|
Debt to equity |
0.16% |
0.03% |
N/A |
N/A |
#N/A |
|
Cost of debt |
9.17% |
18.90% |
N/A |
N/A |
N/A |
|
Employee benefits ratio |
49.22% |
47.33% |
57.05% |
59.99% |
48.03% |
|
Repairs and maintenance to depreciation |
82.25% |
62.49% |
35.62% |
50.11% |
44.13% |
|
EFTSL to Employee FTE |
9.57 |
10.06 |
8.56 |
8.52 |
10.65 |
|
expenses per EFTSL ($'000) |
10.71 |
10.17 |
12.98 |
14.46 |
11.57 |
|
Operating expenses per EFTSL ($'000) |
19.54 |
19.60 |
21.28 |
23.20 |
22.28 |
Note: EFTSL for the calculation of the above ratios where relevant, includes vocational education (VE) student loads.
Source: VAGO.
Figure E4
La Trobe University
|
2014 |
2015 |
2016 |
2017 |
2018 |
|
|---|---|---|---|---|---|
|
Net result margin |
2.70% |
8.85% |
5.10% |
3.77% |
3.76% |
|
Adjusted net result margin |
N/A |
N/A |
N/A |
N/A |
3.62% |
|
Liquidity |
1.02 |
0.99 |
0.78 |
0.62 |
0.66 |
|
Adjusted liquidity |
1.28 |
1.39 |
1.15 |
1.01 |
1.09 |
|
Capital replacement |
1.52 |
1.63 |
2.30 |
2.11 |
1.72 |
|
Internal financing |
159% |
111% |
87% |
101% |
103% |
|
Debt to equity |
9.78% |
4.84% |
4.64% |
4.06% |
#N/A |
|
Cost of debt |
7.72% |
14.63% |
6.09% |
5.29% |
4.28% |
|
Employee benefits ratio |
58.40% |
49.21% |
52.19% |
54.44% |
52.89% |
|
Repairs and maintenance to depreciation |
23.92% |
26.50% |
23.00% |
22.83% |
23.73% |
|
EFTSL to Employee FTE |
8.53 |
9.06 |
9.35 |
9.08 |
9.22 |
|
expenses per EFTSL ($'000) |
14.32 |
12.59 |
13.31 |
14.18 |
14.36 |
|
Operating expenses per EFTSL ($'000) |
21.55 |
20.80 |
21.67 |
22.64 |
23.61 |
Source: VAGO.
Figure E5
Monash University
|
2014 |
2015 |
2016 |
2017 |
2018 |
|
|---|---|---|---|---|---|
|
Net result margin |
10.73% |
7.98% |
7.80% |
5.97% |
6.06% |
|
Adjusted net result margin |
N/A |
N/A |
N/A |
N/A |
8.95% |
|
Liquidity |
0.42 |
0.47 |
0.35 |
0.40 |
0.56 |
|
Adjusted liquidity |
1.69 |
1.75 |
1.48 |
1.70 |
1.86 |
|
Capital replacement |
2.23 |
3.13 |
3.16 |
3.47 |
2.42 |
|
Internal financing |
110% |
82% |
86% |
59% |
87% |
|
Debt to equity |
11.45% |
15.93% |
17.46% |
23.78% |
#N/A |
|
Cost of debt |
7.59% |
5.87% |
5.44% |
5.03% |
4.94% |
|
Employee benefits ratio |
47.00% |
48.35% |
48.02% |
48.81% |
46.73% |
|
Repairs and maintenance to depreciation |
46.43% |
35.32% |
37.73% |
38.31% |
33.21% |
|
EFTSL to Employee FTE |
7.29 |
7.49 |
7.41 |
7.31 |
7.64 |
|
expenses per EFTSL ($'000) |
16.20 |
15.94 |
16.38 |
17.08 |
17.36 |
|
Operating expenses per EFTSL ($'000) |
28.51 |
28.10 |
29.04 |
30.51 |
31.39 |
Note: EFTSL for the calculation of the above ratios where relevant, includes student loads for significant operations within the Monash University Group.
Source: VAGO.
Figure E6
RMIT University
|
2014 |
2015 |
2016 |
2017 |
2018 |
|
|---|---|---|---|---|---|
|
Net result margin |
6.78% |
5.81% |
7.62% |
5.43% |
6.21% |
|
Adjusted net result margin |
N/A |
N/A |
N/A |
N/A |
6.65% |
|
Liquidity |
0.59 |
0.59 |
0.53 |
0.53 |
0.48 |
|
Adjusted liquidity |
0.75 |
0.83 |
0.77 |
0.80 |
0.77 |
|
Capital replacement |
2.35 |
3.35 |
2.84 |
2.60 |
1.67 |
|
Internal financing |
99% |
69% |
93% |
69% |
121% |
|
Debt to equity |
6.86% |
11.78% |
11.94% |
13.42% |
#N/A |
|
Cost of debt |
5.33% |
3.18% |
2.97% |
2.59% |
3.95% |
|
Employee benefits ratio |
56.38% |
56.96% |
55.23% |
56.14% |
55.45% |
|
Repairs and maintenance to depreciation |
32.80% |
34.17% |
51.03% |
22.85% |
19.62% |
|
EFTSL to Employee FTE |
11.25 |
11.06 |
11.12 |
11.03 |
10.80 |
|
expenses per EFTSL ($'000) |
11.32 |
12.11 |
12.13 |
12.60 |
13.26 |
|
Operating expenses per EFTSL ($'000) |
17.40 |
18.42 |
18.67 |
19.35 |
20.17 |
Note: EFTSL for the calculation of the above ratios, where relevant, includes student loads from VE and other significant operations within the RMIT University Group.
Source: VAGO.
Figure E7
Swinburne University of Technology
|
2014 |
2015 |
2016 |
2017 |
2018 |
|
|---|---|---|---|---|---|
|
Net result margin |
2.38% |
2.71% |
3.25% |
15.60% |
-1.13% |
|
Adjusted net result margin |
N/A |
N/A |
N/A |
N/A |
0.97% |
|
Liquidity |
1.27 |
1.28 |
0.90 |
0.90 |
0.87 |
|
Adjusted liquidity |
2.07 |
2.20 |
2.40 |
2.67 |
2.27 |
|
Capital replacement |
1.22 |
0.48 |
0.44 |
1.83 |
1.56 |
|
Internal financing |
172% |
393% |
545% |
118% |
21% |
|
Debt to equity |
N/A |
N/A |
N/A |
N/A |
#N/A |
|
Cost of debt |
N/A |
N/A |
N/A |
N/A |
N/A |
|
Employee benefits ratio |
52.83% |
49.11% |
48.34% |
45.06% |
53.79% |
|
Repairs and maintenance to depreciation |
41.77% |
45.59% |
40.77% |
43.17% |
35.88% |
|
EFTSL to Employee FTE |
12.34 |
12.67 |
13.36 |
13.25 |
12.16 |
|
Employee expenses per EFTSL ($'000) |
9.50 |
9.24 |
9.50 |
10.31 |
11.50 |
|
Operating expenses per EFTSL ($'000) |
16.41 |
16.90 |
17.74 |
18.34 |
20.07 |
Note: EFTSL for the calculation of the above ratios, where relevant, includes student loads from VE.
Source: VAGO.
Figure E8
The University of Melbourne
|
2014 |
2015 |
2016 |
2017 |
2018 |
|
|---|---|---|---|---|---|
|
Net result margin |
7.59% |
6.58% |
7.39% |
9.33% |
3.26% |
|
Adjusted net result margin |
N/A |
N/A |
N/A |
N/A |
7.77% |
|
Liquidity |
0.81 |
1.10 |
1.38 |
1.61 |
1.87 |
|
Adjusted liquidity |
4.14 |
4.78 |
4.92 |
5.65 |
5.72 |
|
Capital replacement |
1.46 |
1.41 |
1.15 |
1.58 |
2.88 |
|
Internal financing |
95% |
170% |
256% |
320% |
209% |
|
Debt to equity |
6.16% |
6.46% |
11.02% |
10.49% |
#N/A |
|
Cost of debt |
12.82% |
4.31% |
4.52% |
4.49% |
4.95% |
|
Employee benefits ratio |
49.79% |
49.79% |
48.88% |
47.39% |
48.99% |
|
Repairs and maintenance to depreciation |
35.83% |
48.91% |
65.86% |
51.69% |
55.98% |
|
EFTSL to Employee FTE |
5.40 |
5.77 |
5.87 |
5.88 |
5.87 |
|
Employee expenses per EFTSL ($'000) |
25.75 |
23.90 |
23.91 |
24.57 |
25.36 |
|
Operating expenses per EFTSL ($'000) |
42.95 |
41.37 |
41.74 |
43.32 |
44.45 |
Source: VAGO.
Figure E9
Victoria University
|
2014 |
2015 |
2016 |
2017 |
2018 |
|
|---|---|---|---|---|---|
|
Net result margin |
-3.64% |
-2.81% |
-2.52% |
-6.57% |
1.53% |
|
Adjusted net result margin |
N/A |
N/A |
N/A |
N/A |
1.72% |
|
Liquidity |
1.27 |
1.26 |
0.68 |
0.71 |
1.05 |
|
Adjusted liquidity |
1.29 |
1.28 |
1.26 |
0.89 |
1.95 |
|
Capital replacement |
1.47 |
0.74 |
0.82 |
1.30 |
1.67 |
|
Internal financing |
279% |
151% |
109% |
51% |
57% |
|
Debt to equity |
N/A |
N/A |
0.07% |
0.04% |
#N/A |
|
Cost of debt |
N/A |
N/A |
77.93% |
173.16% |
4.04% |
|
Employee benefits ratio |
68.42% |
67.52% |
64.77% |
68.05% |
58.67% |
|
Repairs and maintenance to depreciation |
65.73% |
59.22% |
54.98% |
76.99% |
57.27% |
|
EFTSL to Employee FTE |
13.09 |
13.12 |
12.75 |
13.42 |
13.53 |
|
Employee expenses per EFTSL ($'000) |
9.89 |
10.20 |
10.31 |
11.18 |
9.85 |
|
Operating expenses per EFTSL ($'000) |
13.97 |
14.45 |
15.02 |
16.18 |
14.80 |
Note: EFTSL for the calculation of the above ratios, where relevant, includes student loads from VE.
Source: VAGO.
Appendix F. Glossary
Accountability
Responsibility of public sector entities to achieve their objectives in the reliability of financial reporting; effectiveness and efficiency of operations; compliance with applicable laws; and reporting to interested parties.
Adverse opinion
An audit opinion expressed if the auditor has sufficient appropriate audit evidence and concludes that misstatements, individually and in aggregate, are both material and pervasive in the financial report.
Amortisation
The systematic allocation of the depreciable amount of an intangible asset over its expected useful life.
Asset
An item or resource controlled by an entity that will be used to generate future economic benefits.
Asset valuation
The fair value of a non-current asset on a specified date.
Audit Act 1994
Victorian legislation establishing the Auditor-General's operating powers and responsibilities and detailing the nature and scope of audits that the Auditor-General may carry out.
Audit committee
Helps a governing board to fulfil its governance and oversight responsibilities and strengthen the accountability of senior management.
Audit opinion
A written expression, within a specified framework, indicating the auditor's overall conclusion about a financial (or performance) report based on audit evidence.
Calendar year
The period of a year beginning with 1 January and ending with 31 December.
Capital expenditure
Money an entity spends on:
- new physical assets, including buildings, infrastructure, plant and equipment
- renewing existing physical assets to extend their service potential or life.
Capital-grant/capital-purpose income
Government funding for an agency to acquire or build capital assets such as buildings, land or equipment.
Carrying value
The original cost of an asset, less the accumulated amount of any depreciation or amortisation, less the accumulated amount of any asset impairment.
Clear audit opinion
A positive written expression provided when the financial report has been prepared, which fairly presents the transactions and balances for the reporting period in keeping with the requirements of the relevant legislation and Australian Accounting Standards. Also referred to as an unqualified audit opinion.
Control environment
Processes within an entity's governance and management structure that provide reasonable assurance about the achievement of an entity's objectives in the reliability of its financial reporting, the effectiveness and efficiency of its operations, and compliance with applicable laws and regulations.
Controlled entities
Those that universities receive benefits from and are able to influence the extent of those benefits through any rights they have to direct the activities of those entities.
Corporations Act 2001
Commonwealth legislation governing corporations, including their financial reporting framework.
Current asset
An asset that will be sold or realised within 12 months of the end of the financial year being reported on, such as term deposits maturing in three months or stock items available for sale.
Current liability
A liability that will be settled within 12 months of the end of the financial year being reported on, such as payment of a creditor for services provided to the entity.
Debt
Money owed by one party to another party.
Deficit
When total expenditure is more than total revenue.
Depreciated replacement cost
Current replacement cost less accumulated depreciation to reflect the economic benefits of the assets that have been consumed.
Depreciation
Systematic allocation of the value of an asset over its expected useful life, recorded as an expense.
Disclaimer of opinion
Statement expressed if the auditor is unable to obtain sufficient appropriate audit evidence on which to base an audit opinion, and the auditor concludes that the possible effects on the financial (or performance) report of undetected misstatements, if any, could be both material and pervasive.
Disclosure error
Error in the financial statements that affect the understanding of the accounts but does not directly impact the income statement and/or balance sheet.
Eliminations
Removing the effect of transactions between entities when preparing consolidated financial statements.
Emphasis of matter
A paragraph included in an audit opinion that refers to a matter appropriately presented or disclosed in the financial report that, in the auditor's judgement, is of such importance that it is fundamental to the users' understanding of that report.
Entity
A corporate or unincorporated body that has a public function to exercise on behalf of the state or that is wholly owned by the state, including departments, statutory authorities, statutory corporations and government business enterprises.
Equity or net assets
Residual interest in the assets of an entity after deducting its liabilities.
Expense
The outflow of assets or the depletion of assets an entity controls during the financial year, including expenditure and the depreciation of physical assets. An expense can also be the incurrence of liabilities during the financial year, such as increases to a provision.
Fair value
The price that would be received if an asset was sold or the price paid to transfer a liability in an orderly transaction between market participants at the measurement date.
Financial Management Act 1994
Victorian legislation governing public sector entities, as determined by the Assistant Treasurer, including their financial reporting framework.
Financial report
A document reporting the financial outcome and position of an entity for a financial year. It contains an entity's financial statements, including a comprehensive income statement, a balance sheet, a cashflow statement, a comprehensive statement of equity, and notes.
Financial Reporting Directions
Issued by the Assistant Treasurer for entities reporting under the Financial Management Act 1994, with the aim of:
- achieving consistency and improved disclosure in financial reporting for Victorian public entities by eliminating or reducing divergence in accounting practices
- prescribing the accounting treatment and disclosure of financial transactions in circumstances where there are choices in accounting treatment, or where existing accounting procurements have no guidance or requirements.
Financial statement error
- Accounting error that directly affect the values in an entity's income statement and/or balance sheet.
Financial sustainability
An entity's ability to manage financial resources so it can meet its current and future spending commitments, while maintaining assets in the condition required to provide services.
Financial year
A period of 12 months for which a financial report is prepared, which may be a different period to the calendar year.
Going concern
An entity that is expected to be able to pay its debts when they fall due, and continue in operation without any intention or necessity to liquidate or otherwise wind up its operations.
Governance
The control arrangements used to administer and monitor an entity's activities to achieve its strategic and operational goals.
Impairment (loss)
The amount by which the value of an entity's asset exceeds its recoverable value.
Income
The inflow of assets or decrease of liabilities during the financial year, including receipt of cash and the reduction of a provision.
Income approach
A valuation technique that converts future amounts, such as cashflows or income and expense, to a single current (discounted) amount. The fair value of those future amounts is measured as the value indicated by current market expectations.
Intangible asset
An identifiable non-financial asset, controlled by an entity, which cannot be physically seen, such as software licences or a patent.
Internal audit
A function of an entity's governance framework that examines and reports to management on the effectiveness of the entity's risk management, internal controls and governance processes.
Internal control
A method of directing, monitoring and measuring an entity's resources and processes to prevent and detect error and fraud.
Investment
The expenditure of funds intended to result in medium- to long-term service and/or financial benefits arising from the development and/or use of infrastructure assets by either the public or private sectors.
Issues
Weaknesses or other concerns in the governance structure of an entity identified during a financial audit, which are reported to the entity in a management letter.
Liability
A present obligation of the entity arising from past events, the settlement of which is expected to result in an outflow of assets from the entity.
Liquidity ratio
A ratio that compares cash and other assets that are expected to convert to cash within 12 months, to liabilities that are payable within 12 months. A value of 1.0 or greater generally indicates that an entity is likely to be able to meet its short-term obligations.
Management letter
A letter the auditor writes to the governing body, the audit committee and the management of an entity outlining issues identified during the financial audit.
Material error or adjustment
An error that may result in the omission or misstatement of information, which could influence the economic decision of users taken on the basis of the financial statements.
Materiality
Information is material if its omission, misstatement or non-disclosure has the potential to affect the economic decisions of users of the financial report, or the discharge of accountability by management or those charged with governance. The size, value and nature of the information and the circumstances of its omission or misstatement help in deciding how material it is.
Modified opinion
The auditor's expressed qualified opinion, adverse opinion or disclaimer of opinion.
Net result
The value that an entity has earned or lost over the stated period—usually a financial year—calculated by subtracting an entity's total expenses from the total revenue for that period.
Non-current asset
An asset that will be sold or realised later than 12 months after the end of the financial year being reported on, such as investments with a maturity date of two years or physical assets the entity holds for long-term use.
Non-current liability
A liability that will be settled later than 12 months after the end of the financial year being reported on, such as repayments on a five-year loan that are not due in the next 12 months.
Non-reciprocal transaction
A transaction where one party provides a benefit to another party, either in cash, kind or services, and does not directly receive any substantial benefits in return.
Other comprehensive income
Revenues, expenses, gains and losses under Australian Accounting Standards that are excluded from net income on the income statement and are instead listed after net income.
Peppercorn lease
The right to use an asset, usually land or building, which is given for a small token amount.
Physical asset
A non-financial asset that is a tangible item an entity controls, and that will be used by the entity for more than 12 months to generate profit or provide services, such as building, equipment or land.
Present value
A current estimate of the present discounted value of the future net cashflows in the normal course of business.
Qualified audit opinion
An opinion issued when the auditor concludes that an unqualified opinion cannot be expressed because of:
- disagreement with those charged with governance, or
- conflict between applicable financial reporting frameworks, or limitation of scope.
A qualified opinion is considered to be unqualified except for the effects of the matter that relates to the qualification.
Relevant measures and indicators
Measures and indicators an entity uses if they have a logical and consistent relationship to its objectives and are linked to the outcomes to be achieved.
Revaluation
The restatement of a value of non-current assets at a particular point in time.
Revenue
Inflows of funds or other assets or savings in outflows of service potential, or future economic benefits in the form of increases in assets or reductions in liabilities of an entity, other than those relating to contributions by owners, that result in an increase in equity during the reporting period.
Risk
The chance of a negative or positive impact on the objectives, outputs or outcomes of an entity.
Special purpose financial report
A financial report prepared under a specific framework that is intended for presentation to a limited group of users and which may not meet general information needs.
Unmodified opinion
The audit opinion that the auditor expresses when concluding that the financial (or performance) report is prepared, in all material respects, in keeping with the applicable reporting framework.
Dashboard for the Results of 2018 Audits: Universities
Our dashboard is interactive visualisation tool summarising the financial statement data for all Victorian universities.
Do you need help using the dashboard? Read our dashboard instructions.
Dashboard instructions
|
General instructions for all pages |
|
|
To navigate between pages in the dashboard, use the page navigation buttons on the left side of each page. |
|
| The dashboard is easiest to navigate in the full screen view. Click the button at the bottom right of the window. | |
| To access a detailed view of each chart, hover over the chart and click the ‘Focus Mode’ button at the top right of the window. |
|
| To return to the dashboard from ‘Focus Mode’, click ‘Back to Report’ at the top left of the window. |
|
| To share the link to the dashboard via email, LinkedIn, Facebook or Twitter, click the ‘Share’ button at the bottom right of the window. |
|
|
Specific selection instructions |
|
|
Home page |
|
|
When opening the dashboard for first time, you will reach the home page.
|
|
|
Period (financial year) selection |
|
|
The dashboard contains data from the past five financial years.
Note: the years selected in a page will be applied across all pages of the dashboard. |
|
|
University selection |
|
|
You can explore the data by selecting universities in the dashboards.
Note: the universities selected in a page will be applied across all pages of the dashboard, except for the ‘University comparison analysis’ page. |
|
|
Sector summary |
|
|
There are two selection types for the sector summary page which will show different charts. The dark grey colour shows the selected option.
|
|
|
University financial composition |
|
|
Click the downward button to expand and make your selection. |
|
|
University comparison analysis |
|
|
This page allows you to visualise up to two charts. Select a data type that you want to show (financial statements results, non-financial data or indicators). The dark grey colour shows the selected option.
Repeat the above process for the second chart. Note:
|
|