Water Entities: Results of the 2012–13 Audits
Overview
This report covers the results of our financial audits of 20 entities, comprising 19 water entities and one controlled entity. The report informs Parliament about significant issues arising from the audits of financial and performance reports and augments the assurance provided through audit opinions included in the respective entities’ annual reports.
Parliament can have confidence in the financial and performance reports of the water industry for the year-ended 30 June as clear audit opinions were issued on the 20 financial reports and 16 performance reports.
For the year-ended 30 June 2013 the 19 water entities generated combined net profits before income tax of $110 million in 2012–13, $497 million or 82 per cent lower than the prior year, predominantly due to Melbourne Water reporting a loss of $45.1 million compared to a profit of $372.8 million in 2011–12. The loss was due to the water price freeze, and a $300 million or 120 per cent increase in its finance costs following the Wonthaggi desalination plant’s completion.
The report highlights the increase in borrowings resulting from investment in infrastructure assets and payment of dividends to government, and its effect on the financial results and long-term financial sustainability of the water industry. Servicing the growing debt and repaying the debt in the future are key challenges for the water industry.
Water Entities: Results of the 2012–13 Audits: Message
Ordered to be printed
VICTORIAN GOVERNMENT PRINTER November 2012
PP No 290, Session 2010–13
President
Legislative Council
Parliament House
Melbourne
Speaker
Legislative Assembly
Parliament House
Melbourne
Dear Presiding Officers
Under the provisions of section 16AB of the Audit Act 1994, I transmit my report on Water Entities: Results of the 2012–13 Audits.
This report summarises the results of the financial audits of the 19 water entities and one controlled entity for the year-ended 30 June 2013.
It informs Parliament about significant issues identified during our audits and complements the assurance provided through individual audit opinions included in the entities' annual reports.
The report highlights the increase in borrowings resulting from investment in infrastructure assets and payment of dividends to government, and its effect on the financial results and long-term financial sustainability of the water industry. Servicing the growing debt and repaying the debt in the future are key challenges for the industry.
Yours faithfully

John Doyle
Auditor-General
12 December 2013
Audit summary
The Victorian water industry consists of 20 entities, comprising 19 water entities and one controlled entity. The 19 water entities provide water, sewage and trade waste services to the Victorian community.
This report presents the results of our financial audits of these 20 entities. It provides a detailed analysis of their financial and performance reporting, financial results and financial sustainability. It also comments on the effectiveness of internal controls, in particular, information technology security, change management, procurement and treasury management.
Conclusions
Parliament can have confidence in the financial and performance reports of the water industry for the year-ended 30 June 2013.
Unqualified audit opinions were issued on the 20 financial reports which means the audited financial information presents fairly the entities' transactions and cash flows for the 2012–13 financial year, and their assets and liabilities as at 30 June 2013.
Unqualified audit opinions were also issued on all 16 performance reports as the audited information presents fairly the results against performance indicators for the 2012–13 financial year.
Findings
Financial and performance reporting
While unqualified audit opinions were issued on the financial and performance reports there are opportunities for the 19 water entities to reduce their operating costs and further improve the timeliness of their reporting.
Consistent with the prior year, the three metropolitan retailers did not prepare and submit performance reports for audit. While they included the required financial and non-financial indicators as a separate report within their annual reports, the information was unaudited. To provide Parliament with reasonable assurance that the performance information is reliable and accurate, the entities should submit their performance reports for audit.
The usefulness of the performance reports of the 16 entities currently required to submit their reports for audit is limited because of the disconnect between a water entity's corporate planning processes and the performance reporting requirements for 2012–13, whereby targets were not set for a number of indicators reported against.
The Audit Act 1994 empowers the Auditor-General to audit any performance indicators in the report of operations of an audited entity to determine whether they:
- are relevant to the stated objectives of the entity
- are appropriate for the assessment of the entity's actual performance
- fairly represent the entity's actual performance.
At the time of preparing this report we have limited our opinions on performance reports of water entities to fair presentation and compliance with the legislative requirements.
During 2012–13 a water industry performance reporting working group evaluated the relevance and appropriateness of a suite of proposed key performance indicators.
The water entities were then required to reflect the agreed set of key performance indicators in their 2013–14 corporate plans, with targets to be set for all indicators.
From 2013–14 onwards audit opinions relating to the performance reports will also conclude on the relevance and appropriateness of the performance indicators and whether they fairly present performance.
Financial results
In 2011–12 Melbourne Water, City West Water, South East Water, Yarra Valley Water and Western Water collected payments from customers to cover the costs of purchasing water from the Wonthaggi desalination plant. However, due to delays in commissioning the plant, the plant was not operational and the amounts paid by customers were not needed.
From 1 July 2012 water entities began returning the payments to customers via a 12 month price freeze. At 30 June 2013, the Essential Services Commission estimated that the water entities had returned $265 million to customers. A total of $167 million was returned via the price freeze. In addition, the three metropolitan retailers and Western Water provided rebates of $98 million to eligible customers by 30 June 2013.
In 2012–13, the 19 water entities generated a combined net profit, before income tax, of $110 million, a decrease of $497 million or 82 per cent from the prior year. The overall decrease was predominantly due to Melbourne Water reporting a loss of $45.1 million compared to a profit of $372.8 million in 2011–12. Their decrease was due to the price freeze and a $300 million or 120 per cent increase in its finance costs, following the desalination plant achieving practical completion on 17 December 2012. The water industry also experienced a 16 per cent increase in operating costs while revenue grew by 2 per cent only.
Interest bearing liabilities increased by $5.4 billion, or 59 per cent, in 2012–13, due predominantly to the recognition of the desalination plant as a finance lease by Melbourne Water. The industry accessed new borrowings of approximately $1 billion to finance the construction of infrastructure assets and to facilitate the payment of dividends.
Financial sustainability
Over the past five years, interest bearing liabilities have increased by $10.3 billion, or 248 per cent, with finance costs now accounting for 21 per cent of the water industry's total operating costs each year. Accordingly, it is critical that water entities effectively manage interest rate risk.
Servicing the growing debt and repaying that debt in the future are key challenges for the water entities. The ability of one metropolitan water entity to repay its debt is currently rated as low and another may encounter difficulties in repaying debt in the future.
Four entities were rated as having a high financial sustainability risk at 30 June 2013 due to the magnitude of their operating losses. This is an outcome of the pricing model that regulates the prices entities can charge their customers for water and services provided. This issue is one of a number of matters being considered by a Water Industry Financial Sustainability (WIFS) working group established during 2011–12.
Information technology
There is significant reliance on information technology (IT) by the water industry. Information held by water entities about employees, customers and suppliers, and the financial and operational aspects of the business can be highly sensitive and needs to be protected from unauthorised access, theft or manipulation.
The IT controls over financial reporting are tested annually during our financial report attest audits. In 2012–13 we found that the controls tested were adequate for producing reliable, materially accurate and timely financial reports. Nevertheless, a number of areas for improvement were identified as IT control weaknesses were identified at 11 of the 19 entities during 2012–13.
Twenty-two IT control issues raised in previous years financial audits remained unresolved at 30 June 2013. The failure to address them reflects poorly on both the entities' governing bodies and their management.
The water entities can strengthen their controls to protect information from unauthorised access, theft or manipulation, to ensure the continuity of service provision and to guard against the emergence of external threats and new security risks.
Procurement
The water industry spent around $1.2 billion on goods and services and $1.5 billion on capital in 2012–13. Procurement frameworks were assessed as generally adequate. However, the high incidence of noncompliance with procurement policies, procedures and control activities identified by internal audits indicate there are opportunities for the governing bodies and management to improve practices.
Our audit revealed that conflict of interests declarations are not always completed by members of tender evaluation panels. This means that water entities could not demonstrate they had mitigated the risk of bias in the evaluation process, and that integrity had been maintained in the tender process.
Treasury management
The importance of an effective treasury function has increased over the past five years as the significant investment in new infrastructure across the water industry has been largely funded by new borrowings. An effective treasury function should monitor and manage cash flows to minimise borrowing costs while providing liquidity to meet obligations when they fall due.
Controls over treasury management at most water entities were established, however, the level of compliance with the approved policies and procedures varied. Improvements can be made with respect to compliance with the Department of Treasury and Finance Treasury management guidelines at some entities.
Four water entities also breached their own treasury management policies by not adhering to maturity profiles. Others did not align their borrowings with specific capital projects.
One entity delayed final payment to a contractor as insufficient funds were available when payment was due. It consequently incurred a penalty interest charge of 18 per cent on the outstanding amount, wasting approximately $90 000.
There is a need for the Department of Treasury and Finance to more actively oversight treasury management by the water entities.
Recommendations
That water entities:
- review their processes for capturing and calculating commitments and the training and/or briefing sessions provided to staff to improve the quality, completeness and accuracy of the information included in the financial report
- further refine their financial reporting processes by preparing shell statements, performing materiality assessments and rigorous analytical reviews, and having adequate security to protect and safeguard sensitive information.
That the Department of Environment and Primary Industries:
- revisit the model performance report to assist the water entities in achieving a greater degree of compliance with the performance reporting requirements—including the explanation of variances between targets and actual performance, and between years.
That water entities:
- further refine their performance report preparation processes to reduce costs and achieve efficiencies in the future
- address information technology control weaknesses in a timely manner in order to ensure sound internal controls are in place and are operating effectively to protect information from unauthorised access, theft or manipulation, to ensure continuity of service provision and to guard against the emergence of external threats and new security risks
- develop and implement comprehensive information technology security and change management policies and procedures
- establish an information technology steering committee to oversight all information technology-related matters including risk management, security and change management
- improve reporting to the information technology steering committee on matters such as risk management, information technology security, change management and network breaches and intrusions
- implement a periodic review of user access to confirm that access rights are commensurate with staff member's roles and responsibilities, and regularly monitor the use of generic and privileged user accounts
- require each member of a tender evaluation panel to complete a conflict of interest declaration at the start of the evaluation process
- address recommendations arising from internal audits in a timely manner and report progress to the audit committee or the board
- improve the monitoring of their debt maturity profiles in order to ensure compliance with approved policies, and to confirm the availability of funds to meet their contractual obligations as and when they fall due.
That the Department of Environment and Primary Industries:
- take a more active role in overseeing the treasury management activities of entities, including their compliance with the requirements of the Department of Treasury and Finance's Treasury management guidelines.
Submissions and comments received
In addition to progressive engagement during the course of the audit, in accordance with section 16(3) of the Audit Act 1994 a copy of this report, or relevant extracts from the report, was provided to the Department of Environment and Primary Industries, the Department of Treasury and Finance, the Treasury Corporation of Victoria, the Essential Services Commission and the 20 entities with a request for submissions or comments.
Agency views have been considered in reaching our audit conclusions and are represented to the extent relevant and warranted in preparing this report. Their full section 16(3) submissions and comments are included in Appendix F.
1 Background
1.1 Introduction
The Victorian water industry consists of 20 entities, comprising 19 water entities and one controlled entity. All entities are wholly owned by the state. The entities are stand‑alone businesses responsible for their own management and performance. The 19 water entities are expected to adopt sustainable management practices which give due regard to environmental impacts and which allow water resources to be conserved, properly managed, and sustained.
This report provides the results of the financial audits of the 20 entities, and is one of a suite of Parliamentary reports on the results of the 2012–13 financial audits conducted by VAGO. The full list of reports can be found in Appendix A of this report.
Figure 1A lists the legal and trading names of the 20 entities that comprise the Victorian water industry.
Figure
1A
Water entities and controlled entity
Legal name |
Trading name |
|---|---|
Metropolitan sector |
|
Wholesaler |
|
|
Melbourne Water Corporation |
Melbourne Water |
Retailers |
|
|
City West Water Corporation South East Water Corporation Yarra Valley Water Corporation |
City West Water South East Water Yarra Valley Water |
Regional urban sector |
|
Barwon Region Water Corporation |
Barwon Water |
Central Gippsland Region Water Corporation |
Gippsland Water |
Central Highlands Region Water Corporation |
Central Highlands Water |
Coliban Region Water Corporation |
Coliban Water |
East Gippsland Region Water Corporation |
East Gippsland Water |
Goulburn Valley Region Water Corporation |
Goulburn Valley Water |
Grampians Wimmera Mallee Water Corporation |
GWMWater |
Lower Murray Urban and Rural Water Corporation |
Lower Murray Water |
North East Region Water Corporation |
North East Water |
South Gippsland Region Water Corporation |
South Gippsland Water |
Wannon Region Water Corporation |
Wannon Water |
Western Region Water Corporation |
Western Water |
Westernport Region Water Corporation |
Westernport Water |
Rural sector |
|
Gippsland and Southern Rural Water Corporation |
Southern Rural Water |
Goulburn-Murray Rural Water Corporation |
Goulburn-Murray Water |
Controlled entity |
|
Watermove Pty Ltd |
Watermove |
Note:
Watermove is a controlled entity of Goulburn-Murray Water.
Source: Victorian Auditor-General’s Office.
1.1.1 Recent changes to the metropolitan retail water entities
The three metropolitan water retailers, namely City West Water Limited, South East Water Limited and Yarra Valley Water Limited were established as public companies under the State Owned Enterprises Act 1992 and were subject to the Corporations Act 2001. However, in 2012 the Water Amendment (Governance and Other Reforms) Act 2012 established three statutory authorities, City West Water Corporation, South East Water Corporation and Yarra Valley Water Corporation, as their successors in law.
While their legal form changed, effective 1 July 2012, there was no change to the boundaries, operations, functions and services of the entities and the pre‑existing property, rights and liabilities were also transferred to the statutory authorities.
City West Water, South East Water and Yarra Valley Water now operate under the provisions of the Water Act 1989. From a financial reporting perspective they must comply with the Financial Management Act 1994 and the Financial Reporting Directions of the Minister for Finance.
The three public companies were deregistered by the Australian Securities and Investments Commission on 20 March 2013.
1.1.2 Watermove
Watermove is a controlled entity of Goulburn-Murray Water (G-MW). At a board meeting on 10 August 2012 the directors of Watermove resolved to discontinue the operations of the company. The company ceased trading on 13 August 2012.
G-MW investigated the sale of the business and its assets during 2012–13, however, no agreement was reached with potential buyers. As a result, Watermove remains a controlled entity of G-MW and a financial report was prepared and audited for the financial year-ended 30 June 2013.
1.2 Structure of this report
Figure 1B outlines the structure of this report.
Figure 1B
Report structure
Part |
Description |
|---|---|
Part 2: Financial reporting |
Outlines the financial reporting framework and comments on the timeliness and accuracy of financial reporting by the 19 water entities and one controlled entity. It compares practices in 2012–13 against better practice, legislated time lines and past performance. |
Part 3: Performance reporting |
Outlines the performance reporting framework, comments on the timeliness and accuracy of performance reporting and compares practices in 2012–13 against better practice and past performance. Details work undertaken by the industry to improve the usefulness of performance reports and reiterates our intention to further develop our audit of the performance reports in future periods. |
Part 4: Financial results |
Illustrates the financial results of the 19 water entities, including financial performance for 2012–13, and financial position at 30 June 2013. |
Part 5: Financial sustainability |
Provides insight into the financial sustainability of the 19 water entities obtained from analysing the trends of seven financial sustainability indicators over a five-year period. |
Part 6: Information technology |
Summarises common information technology general control weaknesses and comments on the information technology security and change management controls at the 19 water entities. |
Part 7: Procurement |
Assesses the procurement controls at the 19 water entities. |
Part 8: Treasury management |
Assesses the treasury management controls at the 19 water entities. |
Source: Victorian Auditor-General's Office.
1.3 Audit of financial reports
A financial report is a structured representation of financial information, which usually includes accompanying notes, derived from accounting records. It indicates whether an entity generated a profit or loss and details an entity's assets and obligations at a point in time or the changes therein for a specified reporting period in accordance with a financial reporting framework.
An annual financial audit has two aims:
- to give an opinion consistent with section 9 of the Audit Act 1994, on whether financial reports are fairly stated
- to consider whether there has been wastage of public resources or a lack of probity or financial prudence in the management or application of public resources, consistent with section 3A(2) of the Audit Act 1994.
The framework applied in conducting our financial audits is set out in Figure 1C.
Figure 1C
Financial audit framework
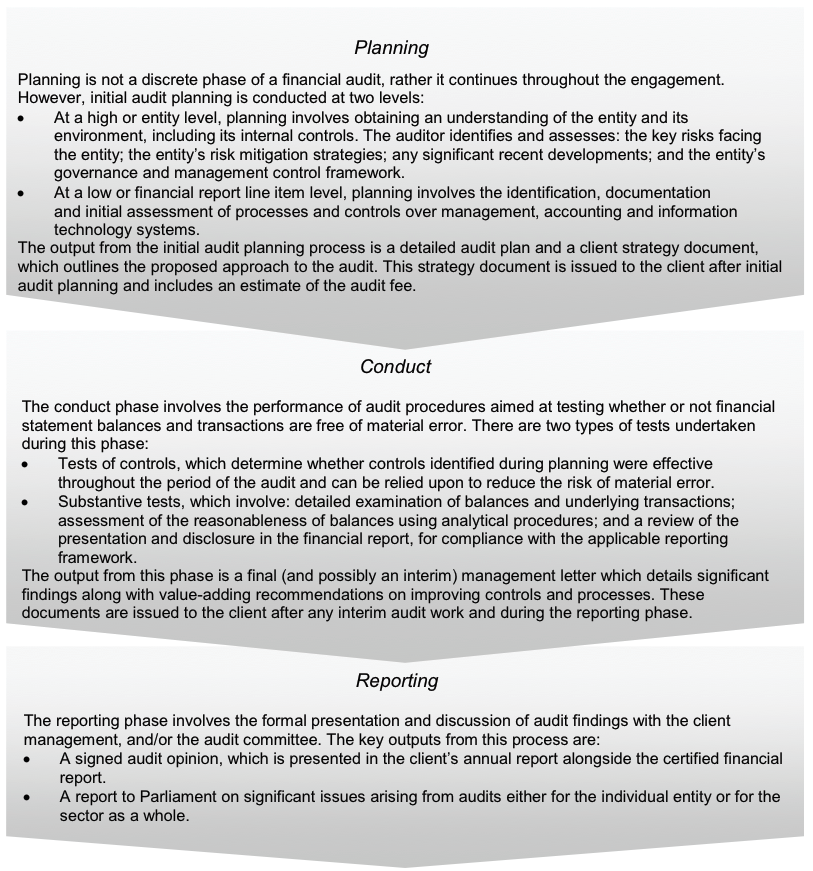
Source: Victorian Auditor-General’s Office.
1.3.1 Audit of internal controls relevant to the preparation of the financial report
Integral to the annual financial audit is an assessment of the adequacy of the internal control framework, and the governance processes, related to an entity's financial reporting. In making this assessment, consideration is given to the internal controls relevant to the entity's preparation and fair presentation of the financial report, but this assessment is not used for the purpose of expressing an opinion on the effectiveness of the entity's internal control.
Internal controls are systems, policies and procedures that help an entity reliably and cost effectively meet its objectives. Sound internal controls enable the delivery of reliable, accurate and timely internal and external reporting.
An explanation of the internal control framework, and its main components, are set out in Appendix B. An entity's governing body is responsible for developing and maintaining its internal control framework.
Internal control weaknesses we identify during an audit do not usually result in a 'qualified' audit opinion because often an entity will have compensating controls in place that mitigate the risk of a material error in the financial report. A qualification is warranted only if weaknesses cause significant uncertainty about the accuracy, completeness and reliability of the financial information being reported.
Weaknesses in internal controls found during the audit of an entity are reported to its chairman, the managing director and audit committee in a management letter.
Our reports to Parliament raise systemic or common weaknesses identified during our assessments of internal controls over financial reporting, across the water industry.
1.4 Audit of performance reports
A performance report is a statement containing predetermined performance indicators, financial and/or non-financial, the targets and the actual results achieved against the indicators for that financial year, with an explanation for any significant variance between the results and targets.
The Audit Act 1994 empowers the Auditor-General to audit any performance indicators in the report of operations of an audited entity to determine whether they:
- are relevant to the stated objectives of the entity
- are appropriate for the assessment of the entity's actual performance
- fairly represent the entity's actual performance.
The Auditor-General uses this authority to audit the performance reports prepared by the water industry under Financial Reporting Direction 27B Presentation and Reporting of Performance Information.
1.5 Conduct of water entity financial audits
The audits of the 19 water entities and one controlled entity were undertaken in accordance with Australian Auditing Standards.
Pursuant to section 20(3) of the Audit Act 1994, unless otherwise indicated, any persons named in this report are not the subject of adverse comment or opinion.
The total cost of preparing and printing this report was $192 500.
1.6 Subsequent events
1.6.1 Third regulatory period – Water Plan 3
Since 1 January 2004 the Essential Services Commission (ESC) has been responsible for regulating and approving the price each water entity may charge its customers for supplying water and providing sewage services.
In October 2012, the 19 water entities submitted final water plans to the ESC for assessment, with 18 of the plans for the period from 1 July 2013 to 30 June 2018. G-MW submitted a final water plan for the period from 1 July 2013 to 30 June 2016. Each entity was required to set out in its plan:
- the expected costs of delivering water and sewerage services
- the planned capital works programs
- the forecast volumes of water to be delivered
- the level of service promised to customers
- the proposed prices that would raise sufficient revenue to recover expected costs.
The ESC's final price determinations for Water Plan 3 were released in June 2013. For all entities except G-MW and Melbourne Water, the determinations apply from 1 July 2013 to 30 June 2018 or until when the ESC makes a new determination.
The determinations for G-MW and Melbourne Water cover the three-year period to 30 June 2016.
G-MW's determination could only relate to a three-year period to comply with the Water Charge (Infrastructure) Rules and pricing principles developed by the Australian Competition and Consumer Commission. The next price determination can cover a four-year period.
In relation to Melbourne Water the ESC confirmed the need to capitalise a portion of the desalination costs, and accepted the assessment by Melbourne Water that the capacity to do so lies in the later years of the five-year regulatory period. However, due to significant changes to the modelling assumptions that were adopted by Melbourne Water following the draft determination and given insufficient information at the time of the final determination, the ESC decided to shorten the regulatory period to enable further examination of the capitalisation of desalination costs on future prices.
1.6.2 Desalination plant refinancing
In October 2013 the Minister for Water announced that the government expects significant future savings on the Wonthaggi desalination project following an agreement to refinance the project earlier than initially planned. At the time of preparing this report the refinancing process was not complete, and the value of any savings was not known.
As the financial obligations for the desalination plant are met by Melbourne Water, the refinancing outcome will affect the financial performance and position of Melbourne Water from 2013–14 onwards.
Should the refinancing result in lower bulk water costs for Melbourne Water, the three metropolitan retail water entities expect the reduction to flow to their customers in the form of lower prices.
2 Financial reporting
At a glance
Background
This Part covers the results of the 2012–13 audits of the 19 water entities and one controlled entity. It also compares financial reporting practices in 2012–13 against better practice, legislated time lines and 2011–12 performance.
Conclusion
Parliament can have confidence in the 20 financial reports as all were given unqualified audit opinions for 2012–13. Financial reporting preparation processes were adequate for preparing accurate and timely financial reports, although opportunity for improvement exists.
Findings
- The 19 water entities met the legislated 12-week financial reporting time frame.
- Watermove finalised its financial report within 17.3 weeks of year end.
- Water entities can improve their financial reporting preparation processes by preparing shell statements, performing materiality assessments and rigorous analytical reviews and having adequate security to protect and safeguard sensitive information. These enable the early identification and resolution of financial reporting issues, thereby reducing the risk of delays and any associated additional costs.
Recommendations
That water entities:
- review their processes for capturing and calculating commitments and the training and/or briefing sessions provided to staff to improve the quality, completeness and accuracy of the information included in the financial report
- further refine their financial reporting processes by preparing shell statements, performing materiality assessments and rigorous analytical reviews, and having adequate security to protect and safeguard sensitive information.
2.1 Introduction
This Part covers the results of the audits of the 2012–13 financial reports of the 19 water entities and one controlled entity.
The quality of an entity's financial reporting can be measured in part by the timeliness and accuracy of the preparation and finalisation of its financial report, as well as against better practice criteria.
2.2 Audit opinions issued
Independent audit opinions add credibility to financial reports by providing reasonable assurance that the information reported is reliable and accurate. An unqualified or clear audit opinion confirms that the financial report presents fairly the transactions and balances for the reporting period, in accordance with the requirements of relevant accounting standards and legislation.
A qualified audit opinion means that the financial report is materially different to the requirements of the relevant reporting framework or accounting standards, and is less reliable and useful as an accountability document.
Unqualified audit opinions were issued on the financial reports of the 20 entities for the financial year-ended 30 June 2013.
2.3 The quality of financial reporting
The timeliness and accuracy of the preparation of an entity's financial report is integral to the quality of reporting. Entities need to have well-planned and managed preparation processes to achieve cost-effective and efficient financial reporting.
Overall the financial report preparation processes of the water entities produced accurate, complete and reliable information.
2.3.1 Accuracy
The frequency and size of errors in financial reports are direct measures of the accuracy of the draft financial reports submitted to audit. Ideally, there should be no errors or adjustments required as a result of an audit.
Our expectation is that all entities will adjust any errors identified during an audit, other than those errors that are clearly trivial or clearly inconsequential to the financial report, as defined under the auditing standards.
The public is entitled to expect that any financial reports that bear the Auditor‑General's opinion are accurate and of the highest possible quality. Therefore all errors identified during an audit should be adjusted, other than those that are clearly trivial.
Material adjustments
When our staff detect errors in the draft financial reports they are raised with management. Material errors need to be corrected before an unqualified audit opinion can be issued.
The entity itself may also change its draft financial reports after submitting them to audit if their quality assurance procedures identify that the draft information is incorrect or incomplete.
In relation to the 2012–13 audits, 30 material financial balance adjustments were made compared to 41 in the prior year. The adjustments related mainly to fixed assets, expenses/payables, revenue/receivables and income tax. The adjustments resulted in changes to the net result and/or the net asset position of entities.
In addition to the financial balance adjustments, there were 64 disclosure errors that required adjustment in 2012–13 (23 in 2011–12).
In particular, there were 17 material disclosure adjustments relating to commitments (20 in 2011–12). This indicates that improvements can be made to the processes adopted by water entities to capture and calculate their commitments. Management at water entities should also consider providing training and/or briefing sessions to staff involved in the preparation of the commitment schedules to improve the quality, completeness and accuracy of the information included in the financial report.
Other disclosure adjustments in 2012–13 related to the completeness of accounting policies, related parties and executive officer remuneration disclosures.
All material errors were adjusted prior to the completion of the financial reports.
2.3.2 Timeliness
Timely financial reporting is key to providing accountability to stakeholders and enables informed decision-making. The later reports are produced and published after year end, the less useful they are.
The Financial Management Act 1994 requires an entity to submit its audited annual report to its minister within 12 weeks of the end of financial year. Its annual report should be tabled in Parliament within four months of the end of financial year.
The 19 water entities met the legislated time frame in 2012–13, as was the case in 2011–12. The average time taken by the 19 water entities to finalise their 2012–13 financial reports was 8.4 weeks which was the same as the prior year.
Watermove, a controlled entity of Goulburn-Murray Water (G-MW), took 39.9 weeks to finalise its 2011–12 financial report following a decision on 10 August 2012 by its directors to discontinue the company's operations. Its 2012–13 financial report was finalised within 17.3 weeks of year end. The delays did not impact the finalisation of the G-MW financial report as the transactions of Watermove during 2012–13 and its assets and liabilities were not material to the results of G-MW, and accordingly a consolidation financial report was not required.
Appendix C sets out the dates the 2012–13 financial reports were finalised.
2.3.3 Better practice
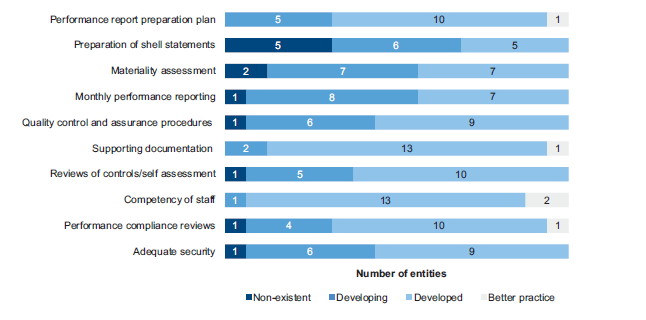
An assessment of the quality of financial reporting processes was conducted against better practice criteria, detailed in Appendix B, using the following scale:
- non-existent—process not conducted by the entity
- developing—partially encompassed in the entity's financial reporting preparation processes
- developed—entity has implemented the process, however, it is not fully effective
- better practice—entity has implemented effective and efficient processes.
The results are summarised in Figure 2A.
Figure 2A
Results of assessment of financial report preparation processes against better practice elements
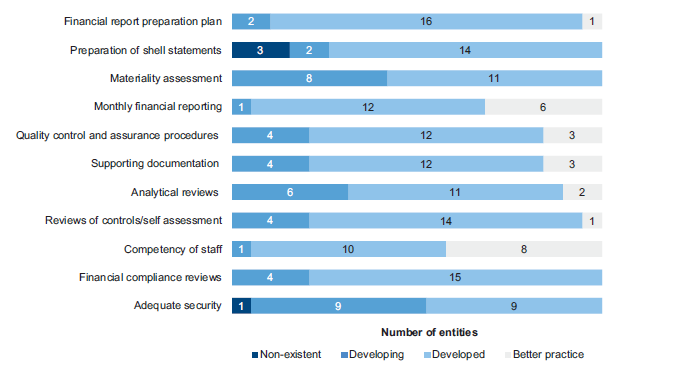
Source: Victorian Auditor-General's Office.
While most elements were developing or developed with some entities having achieved better practice, the most significant elements to be addressed by the industry are the preparation of shell statements, materiality assessment, rigorous analytical reviews and adequate security.
Adopting the better practice elements can mitigate significant delays and additional costs in the finalisation of the audit. Unaddressed these elements can jeopardise an entity's ability to meet legislated time lines and cause unnecessary cost increases due to the need for rework.
Recommendations
That water entities:
- review their processes for capturing and calculating commitments and the training and/or briefing sessions provided to staff to improve the quality, completeness and accuracy of the information included in the financial report
- further refine their financial reporting processes by preparing shell statements, performing materiality assessments and rigorous analytical reviews, and having adequate security to protect and safeguard sensitive information.
3 Performance reporting
At a glance
Background
Sixteen of the 19 water entities are required to include an audited statement of performance in their annual report. This Part covers the results of the 2012–13 audits of water entity performance reports. It also details the progress made by an industry working group to influence the indicators to be included in performance reports for 2013–14.
Conclusion
Parliament can have confidence in the fair presentation of all 16 performance reports as all received unqualified audit opinions for 2012–13. However, the usefulness of the reports is limited as nine of the 16 entities did not set targets for some of their indicators. This is, in part, an outcome of the disconnect between the corporate planning processes of the related water entities and the industry's performance reporting requirements with respect to the 2012–13 financial year.
An improvement in the usefulness of the reports is expected as an agreed set of key performance indicators included in water entity corporate plans for 2013–14 align with the performance reporting framework developed for 2013–14.
Findings
- Nine of 16 (10 of 16 in 2011–12) performance reports had indicators without targets.
- Commentary was not always provided for significant variations in performance.
Recommendations
- That the Department of Environment and Primary Industries revisit the model performance report to assist the water entities in achieving a greater degree of compliance with the performance reporting requirements—including the explanation of variances between targets and actual performance, and between years.
- That water entities further refine their performance report preparation processes to reduce costs and achieve efficiencies in the future.
3.1 Introduction
This Part covers the results of the audits of the 2012–13 performance reports of 16 water entities and provides an update on work undertaken by an industry working group to influence the indicators to be included in performance reports from 2013–14.
3.2 Conclusion
Parliament can have confidence in the fair presentation of all 16 performance reports as they received unqualified audit opinions for 2012–13. However, the usefulness of the reports is limited as nine of the 16 entities did not set targets for some of their indicators. This is, in part, an outcome of the disconnect between the corporate planning processes of the related water entities and the industry's performance reporting requirements with respect to the 2012–13 financial year.
An improvement in the usefulness of the reports is expected as an agreed set of key performance indicators included in water entity corporate plans for 2013–14 align with the performance reporting framework developed for 2013–14.
3.3 Performance reporting framework
Financial Reporting Direction 27B Presentation and Reporting of Performance Information requires 16 of the 19 water entities to include an audited statement of performance in their annual report.
Directives issued pursuant to section 51 of the Financial Management Act 1994 specify the format, content, and indicators to be included in the performance report. The requirements vary across the three water sectors.
The three metropolitan retailers, City West Water, South East Water and Yarra Valley Water, are encouraged, but not required to comply with the direction. Consistent with the prior year, the three entities chose not to prepare and submit a performance report for audit for 2012–13. While they included the required financial and non-financial indicators as a separate report within their annual reports, the information was unaudited. To provide Parliament with reasonable assurance that the performance information is reliable and accurate, the entities should submit their performance reports for audit.
3.4 Audit opinions issued
Unqualified audit opinions were issued on all 16 performance reports audited for 2012–13.
Our annual attest audit on the performance report of 16 water entities is currently limited to an opinion on whether the actual results reported are presented fairly and in compliance with the legislative requirements.
3.5 The quality of performance reporting
Overall the water entities produced accurate, complete and reliable information with respect to the performance report.
3.5.1 Timeliness of reporting
Performance reports are generally prepared and finalised in conjunction with financial reports and the common time line is provided in Section 2.3.2 of this report.
Appendix C sets outs when the performance report for each entity was finalised.
3.5.2 Accuracy
In 2012–13:
- nine of 16 performance reports included indicators without targets (10 of 16 in 2011–12)
- nine of 16 water entities did not calculate significant variations correctly (five of 16 in 2011–12)
- commentary for some significant variations in performance focused on the value of the change rather than the contributing factors
- commentary was not always provided to explain significant variations between targets and actual performance or between the prior year and current year actual performance.
A particular concern was that 30 of the 166 non-financial indicators reported by the 16 entities did not have targets (31 in 2011–12). The absence of targets reduces the usefulness of performance reports because a comparison of actual performance against targets cannot be made. This is reflective of the disconnect between the corporate planning processes of the related water entities and the industry's performance reporting requirements with respect to the 2012–13 financial year.
A number of water entities stated that their lack of commentary for variances between current year and prior year performance was due to the layout of the model performance report. Our review of the model performance report indicates that it does not adequately provide for the presentation of variations between actual performance relative to the target and the prior year. Accordingly, there is an opportunity for the model performance report to be improved.
3.5.3 Better practice
In assessing the quality of the performance reports an assessment was made against better practice criteria. The framework applied in assessing the quality of the performance reports is detailed in Appendix B. The rating scale used in our assessment is consistent with that outlined in Section 2.3.3 of this report.
The results of our assessment are summarised in Figure 3A.
Figure 3A
Results of assessment of performance report preparation processes against better practice elements
Source: Victorian Auditor-General's Office.
It shows that further improvement is needed in:
- the preparation of shell statements
- materiality assessment
- monthly reporting
- quality control and assurance procedures
- adequate security.
While there was some improvement in assessment results compared to the prior year, performance reporting processes adopted by the water entities are not as mature or developed as those applied to financial reporting. Accordingly, there are greater opportunities for entities to reduce costs and achieve efficiencies in the future by addressing their performance reporting processes and practices.
3.6 Performance reporting developments and future audit approach
In our Water Entities: Results of the 2010–11 Audits report we indicated our intention to progress to expressing opinions on the relevance and appropriateness of the performance indicators, consistent with the Auditor-General's mandate. In that report we provided an update on progress made by the then Department of Sustainability and Environment, now known as the Department of Environment and Primary Industries (DEPI), and a water industry working group in developing a contemporary framework to facilitate the inclusion of relevant and appropriate financial and non-financial indicators in the sector's future performance reports.
3.6.1 Progress in 2012–13
The intention of the water industry working group was that a contemporary performance reporting framework would apply to the first year of Water Plan 3, that being the 2013–14 financial year.
During 2012–13 the working group evaluated the relevance and appropriateness of a suite of proposed key performance indicators.
DEPI then liaised with the water industry on the proposed indicators, considered feedback on a discussion paper and finalised the indicators to be reported against from 2013–14.
The water entities were subsequently required to reflect the agreed set of key performance indicators in their 2013–14 corporate plan submissions to DEPI with an expectation that targets would be set for all indicators.
This integration and alignment of the corporate planning process with the requirements of the performance report should address one of the deficiencies noted in recent years with respect to the performance reports prepared and submitted for audit.
It is intended that audit opinions relating to the performance report will conclude on the relevance and appropriateness of the performance indicators and whether they fairly present performance, from 2013–14 onwards.
Recommendations
- That the Department of Environment and Primary Industries revisit the model performance report to assist the water entities in achieving a greater degree of compliance with the performance reporting requirements—including the explanation of variances between targets and actual performance and between years.
- That water entities further refine their performance report preparation processes to reduce costs and achieve efficiencies in the future.
4 Financial results
At a glance
Background
This Part covers the financial results of the 19 water entities for the year-ended 30 June 2013.
Conclusion
The 19 water entities generated a net profit before income tax of $110 million for the year-ended 30 June 2013, a decrease of $497 million, or 82 per cent, from the prior year.
The industry also continued to access new borrowings to finance the construction of infrastructure assets and facilitate the payment of dividends.
The profitability of the 19 water entities will continue to be impacted by higher finance costs in the future, as a result of their increased borrowings to 30 June 2013.
Findings
- Finance costs increased by $329 million, or 57 per cent, compared to the prior year.
- Dividends paid or payable to the state decreased by $31 million, or 12 per cent, in 2012–13 due to the reduction in net profit.
- At 30 June 2013 the 19 water entities controlled $41.4 billion in total assets ($36.3 billion at 30 June 2012) and had total liabilities of $20.1 billion ($14.8 billion at 30 June 2012).
- Interest bearing liabilities increased by $5.4 billion, or 59 per cent, in 2012–13, due predominantly to the recognition of the desalination plant as a finance lease by Melbourne Water on 17 December 2012.
4.1 Introduction
Accrual-based financial reports enable an assessment of whether entities generate sufficient surpluses from their operations to maintain services, fund asset maintenance and repay debt. Their ability to generate surpluses is subject to the regulatory environment in which they operate, and their ability to minimise costs and maximise revenue.
An entity's financial performance is measured by its net operating result—the difference between its revenues and expenses. An entity's financial position is generally measured by reference to its net assets—the difference between its total assets and total liabilities.
4.2 Financial results
4.2.1 Financial performance
The 19 water entities are subject to the National Tax Equivalent Regime (NTER) administered by the Australian Taxation Office. The NTER is an administrative arrangement that results in government-owned enterprises paying tax to the state government rather than the Commonwealth Government.
Accordingly, we present their net results before and after income tax in this section.
Net result before income tax
The 19 water entities generated a combined net profit before income tax of $110 million for the year-ended 30 June 2013, a decrease of $497 million, or 82 per cent, from the prior year.
The overall decrease was predominantly due to Melbourne Water reporting a loss of $45.1 million compared to a profit of $372.8 million in the prior year. Its revenue was impacted by the price freeze effective from 1 July 2012, while its finance costs increased by $300 million, or 120 per cent, in 2012–13 due to the desalination plant achieving practical completion on 17 December 2012.
The water industry also experienced a 16 per cent increase in operating costs while revenue grew by 2 per cent only.
Sector performance
All four metropolitan water entities reported a lower net profit in 2012–13 than 2011–12. In addition to implementing a water price freeze from 1 July 2012, the three retailers also provided their customers with rebates totalling $98 million during the year.
The regional urban water entities, as a cohort, improved their performance, with only four of the 13 entities generating losses in 2012–13 (eight in 2011–12).
Barwon Water reported a lower net profit due predominantly to a reduction in customer capital contributions. In the prior year the private sector provided a significant contribution to the construction of the Northern Water Plant.
GWMWater's net loss was greater than the prior year due to lower revenue and higher operating costs. In 2011–12 it generated revenue due to the sale of rural water rights. During 2012–13 an agreement was reached to decommission the Wimmera Irrigation System resulting in a number of assets being fully depreciated, increasing the depreciation expense for the year. Decommissioning costs were also recognised.
The two rural water entities continued to report losses, however, the size of the losses reduced in 2012–13.
Figure 4A shows the net profit or loss before income tax for each entity for the past two years.
Figure 4A
Net profit/(loss) before income tax, by water entity
Entity |
2012–13 ($mil) |
2011–12 ($mil) |
|---|---|---|
Metropolitan sector |
||
Wholesaler |
||
Melbourne Water |
(45.1) |
372.8 |
Retailer |
||
City West Water |
48.7 |
71.7 |
South East Water |
78.3 |
129.3 |
Yarra Valley Water |
68.2 |
87.1 |
Regional urban sector |
||
Barwon Water |
28.3 |
50.6 |
Central Highlands Water |
5.5 |
(6.1) |
Coliban Water |
(19.5) |
(18.9) |
East Gippsland Water |
4.0 |
3.7 |
Gippsland Water |
4.4 |
(3.7) |
Goulburn Valley Water |
2.6 |
(6.8) |
GWMWater |
(34.8) |
(8.3) |
Lower Murray Water |
(4.4) |
(12.7) |
North East Water |
7.9 |
(2.4) |
South Gippsland Water |
(0.3) |
(1.1) |
Wannon Water |
8.6 |
4.9 |
Western Water |
4.1 |
5.2 |
Westernport Water |
1.2 |
3.0 |
Rural sector |
||
Goulburn-Murray Water |
(44.0) |
(52.2) |
Southern Rural Water |
(3.5) |
(9.0) |
Total |
110.2 |
607.1 |
Source: Victorian Auditor-General's Office.
Seven entities delivered a loss before income tax in 2012–13 (10 in 2011–12).
Return of funds due to delays with the desalination plant
In 2011–12 Melbourne Water, City West Water, South East Water, Yarra Valley Water and Western Water collected payments from customers to cover the costs of purchasing water from the Wonthaggi desalination plant. However, due to delays in commissioning the plant, the plant was not operational and the amounts paid by customers were not needed.
From 1 July 2012 water entities began returning the payments to customers via a 12 month price freeze. At 30 June 2013, the Essential Services Commission estimated that the water entities had returned $265 million to customers. A total of $167 million was returned via the price freeze. In addition, the three metropolitan retailers and Western Water provided rebates of $98 million to eligible customers by 30 June 2013.
The Essential Services Commission commissioned an audit during the first quarter of 2013–14 to determine whether all unrequired customer payments had been returned. The audit found that as at 9 September 2013, $295.1 million had been returned to customers. A further $7.3 million is to be returned during 2013–14.
Net result after income tax
The industry reported a combined net profit after income tax of $76.9 million in 2012–13, a decrease of $360.6 million, or 83 per cent, from the prior year.
Seven entities delivered a loss after income tax in 2012–13 (10 in 2011–12).
Revenue
In 2012–13, the 19 entities generated revenue of $4.5 billion, an increase of $94 million, or 2 per cent, on the prior year. The increase was driven by a growth in customers and higher water consumption following the easing of water restrictions and a dry summer.
If revenue from transactions between Melbourne Water and the three metropolitan retailers is excluded, service and usage charges accounted for 64 per cent of the revenue generated in 2012–13.
Expenses
In 2012–13, the 19 entities incurred $4.4 billion in operating expenses, an increase of $591 million, or 16 per cent, on the prior year, predominantly because:
- finance costs increased by $329 million or 57 per cent
- depreciation and amortisation increased by $98 million or 12 per cent.
The largest expense items for the water entities in 2012–13 were finance costs, depreciation and amortisation, and employee benefits.
Melbourne Water's finance costs increased by $300 million, or 120 per cent, in 2012–13 due to the desalination plant achieving practical completion on 17 December 2012.
Dividends
The 19 entities are obliged to pay a dividend to the state if the Treasurer, after consultation with the governing board and responsible minister, makes a formal determination that they do so.
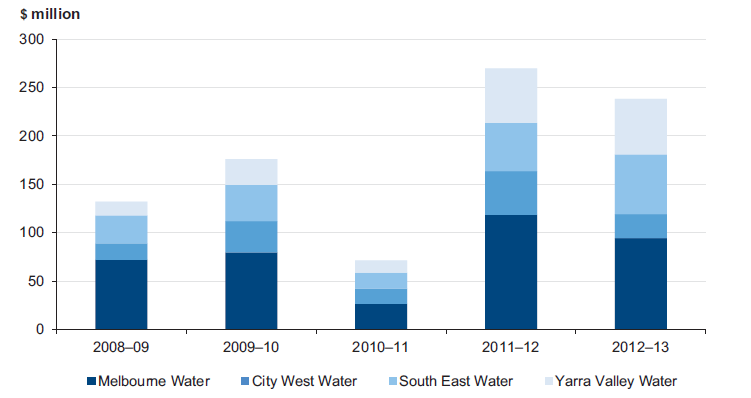
In 2012–13, dividends paid or payable by the four metropolitan water entities totalled $238 million, a decrease of $31 million, or 12 per cent, from 2011–12.
Melbourne Water's final dividend of $94.5 million for 2011–12 was recorded as a liability at 30 June 2013 as it was payable on 31 July 2013. Melbourne Water was not required to make an interim dividend payment based on its 2012–13 half-yearly result. Had dividend payments been required during 2012–13 the entity would have borrowed the funds from the Treasury Corporation of Victoria.
The three metropolitan retailers were all required to make final dividend payments for 2011–12 and interim dividend payments based on their 2012–13 half-yearly results. In light of their cash flow requirements at the time of making the payments, the three metropolitan water entities borrowed from the Treasury Corporation of Victoria.
Figure 4B shows the dividends paid or payable by the four metropolitan water entities each financial year for the past five years.
Figure 4B
Dividends paid or payable by metropolitan water entities,
2008–09 to 2012–13
Source: Victorian Auditor-General's Office.
4.3 Financial position
The ability of entities to maintain their infrastructure assets depends on the adequacy of their asset and debt management policies or the level of their surpluses. Their effectiveness is reflected in the composition and rate of change of the value of their assets and liabilities over time.
4.3.1 Assets
At 30 June 2013, the 19 water entities had assets of $41.4 billion, an increase of $5.1 billion, or 14 per cent, on the prior year. Property, plant, equipment and infrastructure assets represented 95 per cent of their total assets.
A $4.7 billion increase in the value of property, plant, equipment and infrastructure assets at 30 June 2013 was predominantly driven by the recognition of the desalination plant as a leased asset by Melbourne Water upon the plant reaching practical completion.
Receivables increased by $81 million, or 14 per cent, due to greater water consumption and an increase in delays in customer payments.
4.3.2 Liabilities
At 30 June 2013, the water industry had combined liabilities of $20.1 billion, an increase of $5.3 billion, or 36 per cent, on the prior year.
Deferred tax liabilities decreased by $160 million, or 3.4 per cent, in 2012–13. In addition, interest bearing liabilities increased by $5.4 billion, or 59 per cent, during the year, due predominantly to:
- the recognition of the desalination plant as a finance lease by Melbourne Water
- new borrowings by the industry to finance the construction of infrastructure assets and to pay dividends.
A number of water entities accessed borrowings up to the limit of their Treasurer‑approved limit to take advantage of a lower financial accommodation levy (FAL).
Since 1995–96 the FAL has been applied to government business enterprises to remove the market advantage government entities may experience in borrowing, as a result of their sovereign status. It is aimed at ensuring that borrowings are valued appropriately in financing decisions for capital projects.
Until 1 July 2013, the FAL charged to water entities and paid to the Department of Treasury and Finance was capped. On 1 July 2013, the capped rate was removed and in future water entities will be charged a commercial rate for new borrowings based on their underlying credit rating.
The Department of Treasury and Finance determines the credit rating for an entity based on a desktop review and the entity can choose to have its credit rating assessed by an independent rating agency such as Moody's. The entity must pay for this themselves and make sure that the rating is based on a stand-alone basis, without the benefit of either an actual or implied government guarantee.
A number of water entities have indicated that they expect to incur a higher FAL on new borrowings going forward.
The profitability of the 19 water entities will continue to be impacted by higher finance costs in the future, as a result of their increased borrowings to 30 June 2013.
5 Financial sustainability
At a glance
Background
To be financially sustainable, entities need to be able to meet current and future expenditure as it falls due and to absorb foreseeable changes and risks without significantly changing their revenue and expenditure policies. This Part provides insight into the financial sustainability of the 19 water entities.
Conclusion
Analysis of the trends of financial sustainability indicators shows no significant financial improvement for the industry over the five years to 2012–13. Four entities were rated as having a high financial sustainability risk at 30 June 2013 due to the magnitude of their operating losses, which are partly due to the regulated pricing model. Servicing the growing debt and repaying the debt in the future are key challenges for the water entities.
Findings
- The timing and magnitude of price increases has a direct impact on the financial performance and position of an entity over time.
- The debt service cover ratio indicates that the ability of one metropolitan water entity to repay debt is low while another one may also encounter difficulties in repaying debt. As a result the entities will need to refinance their maturing debt.
5.1 Introduction
To be financially sustainable, entities need the capacity to meet their current and future expenditure as it falls due. They also need to absorb any foreseeable changes and financial risks that materialise, without significantly changing their revenue and expenditure policies.
Financial sustainability should be viewed from both a short-term and long-term perspective. Short-term indicators relate to the ability of an entity to maintain positive operating cash flows, or the ability to generate an operating surplus in the next financial year. Long-term indicators focus on strategic issues such as the ability to fund significant asset replacement or reduce long-term debt.
In this Part, insight is provided into the financial sustainability of water entities using the trends of seven financial sustainability indicators over a five-year period.
Appendix D describes the sustainability indicators, the risk assessment criteria used and their significance.
The financial sustainability indicators and assessments flag departures from the norm that warrant attention. However, to form a definitive view of any entity's financial sustainability requires a holistic analysis that moves beyond financial considerations to include the entity's operations and environment, and the regulatory environment in which the entity operates. These additional considerations are not examined in this report.
5.2 Financial sustainability risk assessment
5.2.1 Overall assessment
The water industry has increased its level of interest bearing liabilities, which comprises borrowings and finance lease liabilities, by $10.3 billion, or 248 per cent, over the past five years. Servicing the growing debt and repaying the debt in the future are key challenges for the water entities. The debt service cover ratio indicates that the ability of one metropolitan water entity to repay debt is low and another metropolitan water entity may encounter difficulties in repaying debt.
The profitability of the 19 water entities will continue to be impacted by higher finance costs in the future, as a result of increased borrowings. Part of the increase in borrowings during 2012–13 was due to the removal of the financial accommodation levy cap on new borrowings after 30 June 2013.
Four entities had a high financial sustainability risk rating at 30 June 2013 due to the magnitude of their operating losses, which is partly due to the regulated pricing model.
Figure 5A provides a summary of our financial sustainability risk assessment results by sector for the past two years.
Figure 5A
Financial sustainability risk assessment, by sector
|
2011–12 |
2012–13 |
|||||
|---|---|---|---|---|---|---|
|
Sector |
High |
Medium |
Low |
High |
Medium |
Low |
|
Metropolitan |
– |
2 |
2 |
– |
2 |
2 |
|
Regional urban |
4 |
2 |
7 |
2 |
6 |
5 |
|
Rural |
2 |
– |
– |
2 |
– |
– |
|
Total |
6 |
4 |
9 |
4 |
8 |
7 |
Source: Victorian Auditor-General’s Office.
It shows that from 2011–12 to 2012–13 the greatest change in risk results occurred in the regional urban sector with a greater concentration in the medium risk category.
The financial sustainability results for 2008–09 to 2012–13 for each entity are provided in Appendix D.
5.2.2 Summary of trends in risk assessment over the five‑year period
When the risk assessments for each indicator are analysed they show the following trends over the five years to 2012–13:
- Underlying result—the number of entities in the high- and medium-risk categories has reduced.
- Liquidity—the number of entities in the high- and medium-risk categories has decreased indicating an improved working capital position. However, the position at 30 June 2013 was impacted by the decision of a number of entities to borrow additional funds to take advantage of lower borrowings costs.
- Interest cover—the number of entities in the medium-risk category has increased with a decrease of entities in the low-risk category.
- Debt service cover—the number of entities in the high-risk category has decreased over the five-year period with a greater number of entities in the low‑risk category.
- Debt-to-assets—the risk profile has remained steady over the five years with most entities in the low-risk category.
- Self-financing—the number of entities in the low- and high-risk categories has increased over the period.
- Capital replacement—there has been a significant shift over the five years from low risk to the medium- and high-risk categories.
In summary, the trends show no significant financial improvement for the industry over the five years to 2012–13.
Further information about the risk assessments for each indicator is presented later in this Part.
5.2.3 Analysis of trends in sustainability indicators over the five-year period
To further understand the results we analysed the five-year data for the seven indicators for the metropolitan, regional urban and rural water entities as discrete sectors. The relevant data for each sector are reproduced in Appendix D.
With respect to the metropolitan sector, four of the seven indicators experienced a declining trend over the period, but the large customer base means that entities continue to generate positive cash flows from operations and can sustain their operations.
The regional urban water entities are relatively well placed. In 2012–13 the majority of the indicators for this sector improved. For most indicators, this sector most closely matched the average result for the water industry as a whole, as discussed in Sections 5.3.1 to 5.3.7. However, the magnitude of operating losses resulted in two entities being rated as high risk.
While the rural sector entities continue to generate significant operating losses, a number of indicators are showing signs of improvement. The magnitude of the operating loss for both entities resulted in both being rated as high risk.
Impact of the water pricing model on the sustainability of regional urban and rural entities
Since 1 January 2004, the Essential Services Commission has been responsible for regulating and approving the price each water entity may charge its customers for the supply of water and the provision of sewerage services. The Essential Services Commission first approved prices for metropolitan and regional urban businesses from 1 July 2005 and for rural businesses from 1 July 2006.
Under the regulatory regime, the regulated asset value (RAV) rather than the statutory asset value is used for determining the total revenue required by an entity based on efficient costs. The RAV is reflected in the price that a water entity can charge its customers.
The opening RAV was set by the former Minister for Water as at 1 July 2004 with reference to the operating cash flow generated by the businesses at that time and subject to a range of viability and pricing outcomes based on entity forecasts. The RAV is adjusted each year by the Essential Services Commission to allow for capital investment by the businesses to the extent that the Essential Services Commission is satisfied that it is efficient expenditure.
While the opening RAVs of the metropolitan entities were set higher than their statutory asset value, the regional urban and rural entities had a RAV set lower than their statutory asset value, with the rural entities assigned a RAV of zero. As a result, a large depreciation expense not recovered through prices is carried by regional urban and rural entities.
Over time the revaluation of infrastructure assets has increased the value of assets reported in the financial reports of the 19 entities and increased the difference between RAVs and statutory asset values. This has magnified the shortfall between the water prices levied and the revenue required to meet efficient operating costs.
The difference between the RAVs and the statutory asset values is therefore a key factor in the operating losses of a number of the regional urban and rural water entities.
This issue is one of a number of matters being considered by a Water Industry Financial Sustainability (WIFS) working group established during 2011–12. The purpose of the WIFS working group is to:
- investigate the most appropriate manner of reporting, representing and communicating financial business performance for Victoria's regional water corporations
- produce a report with recommendations for consideration and implementation by the WIFS steering group.
The WIFS working group has met six times since its inception and in October 2013 considered industry responses to an issues paper circulated during May 2013. Key findings were reported to the WIFS steering group on 30 October 2013. The WIFS steering group's subsequent comments on the key findings are to be circulated to the industry.
5.3 Five-year trend analysis
This Section provides analysis and comment on the trends of the seven financial sustainability indicators over a five-year period. The indicators reflect each entity's funding and expenditure policies, and identify whether the policies are sustainable.
Financial sustainability should be viewed from both a short-term and long-term perspective. The shorter-term indicators—the underlying result, liquidity and interest cover—focus on an entity's ability to maintain a positive operating cash flow and adequate cash holdings, and to generate an operating surplus over time.
The longer-term indicators—debt service cover, self-financing, debt-to-assets and capital replacement—indicate whether adequate funding is available to replace assets to maintain the quality of service delivery, and to meet community expectations and the demand for services.
5.3.1 Underlying result
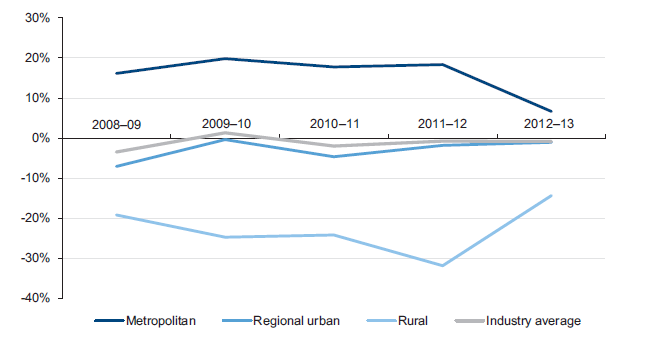
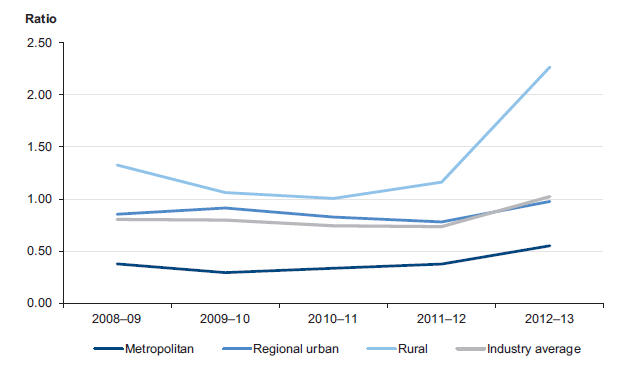
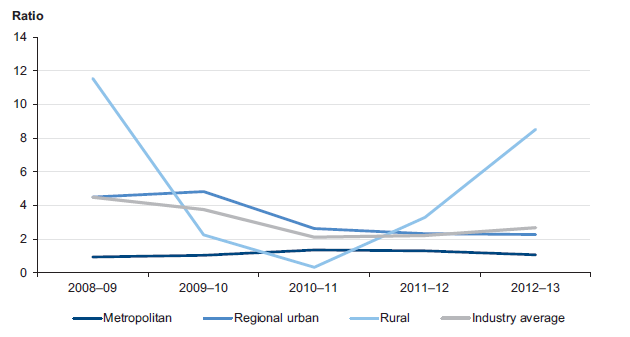
The average underlying result by sector has fluctuated over the five-year period as illustrated by Figure 5B.
Figure 5B
Average underlying result
Source: Victorian Auditor-General’s Office.
For the metropolitan water entities the average underlying result was strong and relatively stable prior to 2012–13. The current year decline is an outcome of the price freeze that applied from 1 July 2012 and the recognition of operating costs associated with the desalination plant upon the plant achieving practical completion on 17 December 2012.
In contrast, the rural entities reversed a downward trend by reporting a significant improvement in 2012–13. While they continued to generate operating losses, they reduced the size of the losses compared to recent years.
The average underlying result for regional urban entities has improved over the past five years, especially in the past two years and largely reflects the industry average.
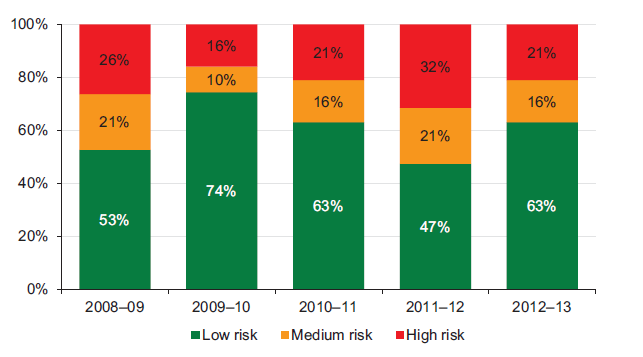
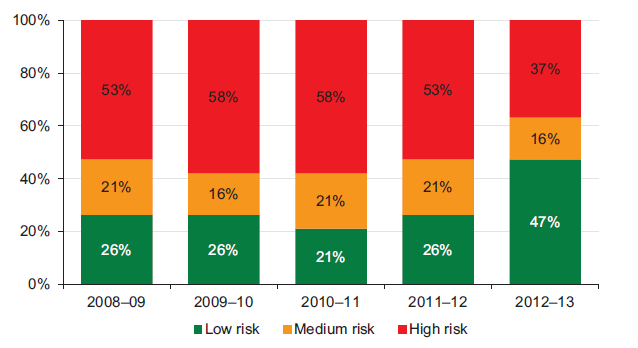
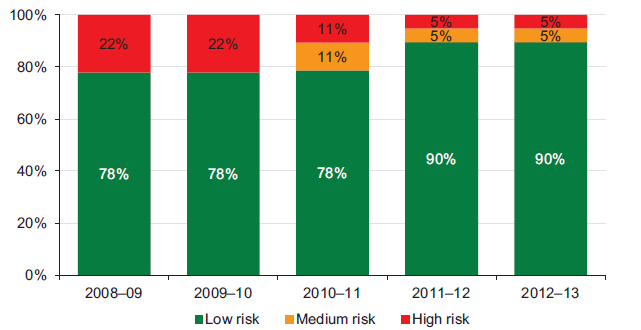
Figure 5C shows that the underlying result risk profile improved in 2012–13 with only 37 per cent of water entities (seven of 19) having an underlying result risk of high or medium, a decrease of 16 per cent from 2011–12.
Figure 5C
Underlying result risk assessment
Source: Victorian Auditor-General’s Office.
The improvement in 2012–13 reflects the impact of:
- revenue growth, due to higher prices for regional urban and rural water entities
- a long, hot and dry summer, resulting in higher water consumption
- easing of water restrictions.
This was offset by:
- higher finance costs
- higher depreciation expenses
- higher employee benefit expenses.
The higher finance costs were driven by substantial increases in borrowings across the sector from 1 July 2008 to finance the construction of infrastructure. The desalination plant also resulted in Melbourne Water reporting a $300 million, or 120 per cent, increase in its finance costs in 2012–13.
5.3.2 Liquidity
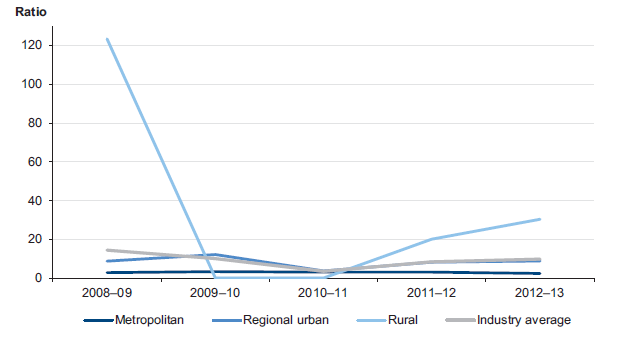
Figure 5D shows that the average liquidity of the water entities has improved over the five years, most significantly in the rural sector.
Figure 5D
Average liquidity ratio
Source: Victorian Auditor-General’s Office.
The substantial increase for rural water entities in 2012–13 is predominantly a consequence of one entity accessing new borrowings at balance date to take advantage of a lower financial accommodation levy. This strategy was also adopted by a number of entities in the other two sectors. The resulting increase in cash reserves was offset by new long-term borrowings classified as non-current liabilities at balance date.
The 19 entities source their borrowings from the Treasury Corporation of Victoria. Entities have approval to refinance their maturing debt and in recent years have done so. While entities have approval to refinance maturing debt, they also need to generate sufficient cash flows from operations to:
- service the increasing interest charges as debt levels increase and the variable interest rates rise
- repay the growing debt in the long term.
For some entities higher water consumption also positively affected the revenue generated and available cash reserves in 2012–13.
The average liquidity ratio for regional urban entities largely reflects the industry average over the five-year period.
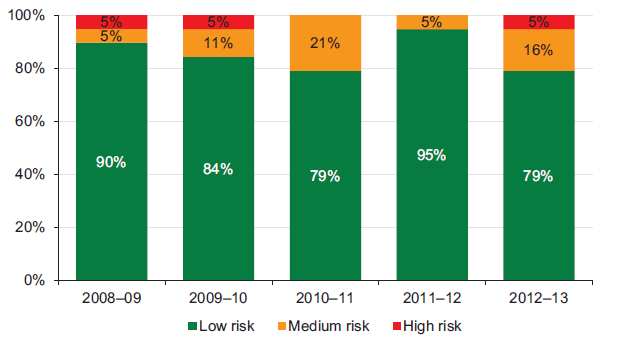
Figure 5E shows that at 30 June 2013, 53 per cent of water entities (10 of 19) had a liquidity risk of high or medium, that is, their current liabilities exceeded current assets.
Figure 5E
Liquidity risk assessment
Source: Victorian Auditor-General’s Office.
The percentage of entities with a high liquidity risk decreased by 16 per cent in 2012–13. However, this was due to entities accessing new borrowings just prior to 30 June 2013, rather than improving their liquidity as a result of improved financial performance.
5.3.3 Interest cover
Figure 5F shows that the average interest cover varied by sector across the five years.
Figure 5F
Average interest cover ratio
Source: Victorian Auditor-General’s Office.
The metropolitan water entities maintained an adequate level of interest cover over the period. While their debt levels and finance costs have increased significantly, they continue to generate positive cash flows from their operations annually. Due to the desalination plant and impact of the price freeze, Melbourne Water's ability to meet its ongoing interest payments and to service debt deteriorated at 30 June 2013.
Six of the 13 regional urban water entities experienced a deteriorating level of interest cover in 2012–13. Finance costs rose because of additional borrowings, however, profits and operating cash inflows remained stable or improved marginally. Despite this, the level of interest cover was still adequate for the majority at 30 June 2013.
The trend for the rural entities shows a level of volatility that reflects the small number of entities in the cohort (two entities). The financial performance and position of the two entities need to be considered individually as the results vary widely. At 30 June 2013, Southern Rural Water had adequate interest cover whereas Goulburn-Murray Water's (G-MW's) interest cover was insufficient to meet its interest payments.
G-MW assumed responsibility for the Connections Project, previously known as the Food Bowl Modernisation Project, on 1 July 2012. While the project is being funded by both the state and Commonwealth, in 2012–13 actual cash payments were greater than the level of project funding received. This contributed to G-MW reporting a negative operating cash flow for the year.
Figure 5G indicates that the interest cover risk was low for 79 per cent of water entities (15 of 19) at 30 June 2013, a decrease of 16 per cent from 2011–12. However, caution is needed as the level of interest cover from year to year can be influenced by the timing of operating cash receipts and payments.
Figure 5G
Interest cover risk assessment
Source: Victorian Auditor-General’s Office.
The number of entities in the high- and medium-risk categories increased between 2011–12 and 2012–13. The deterioration in the past year is reflective of the growth in borrowings and higher finance costs.
5.3.4 Debt service cover
The water entities increased their interest bearing liabilities, comprising borrowings and finance lease liabilities, by $10.3 billion, or 248 per cent, over the past five years.
Figure 5H shows that the ability for regional urban water entities to repay debt from operating profits has decreased over the five years. In contrast, over the past three years, the rural water entities' ability to repay debt from operating profits improved.
Figure 5H
Debt service cover
Source: Victorian Auditor-General’s Office.
The debt service cover for the metropolitan sector has remained consistent over the period, although both City West Water and Melbourne Water had ratios of less than one at 30 June 2013.
The rural sector shows an improvement in the debt service cover from 2010–11 to 2012–13. The more recent increase was an outcome of drier weather conditions which enabled the entities to increase their variable water charges.
Figure 5I shows the number of entities with a low debt service cover risk has improved over the five-year period.
Figure 5I
Debt service cover risk assessment
Source: Victorian Auditor-General’s Office.
5.3.5 Debt-to-assets
Figure 5J presents the average debt-to-assets ratio by sector over the past five years. It shows that an entity's reliance on debt to fund its assets varies significantly depending on its sector.
Figure 5J
Debt-to-assets
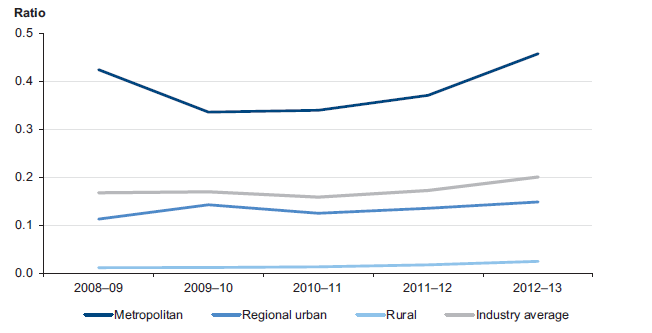
Source: Victorian Auditor-General’s Office.
Over the five years the rural entities maintained a low debt-to-assets ratio indicating limited reliance on debt to fund the assets they manage. Regional urban entities increased their level of debt to fund the acquisition of new assets, but largely mirrored the trend of the industry average. By contrast, the metropolitan entities continued to fund a larger proportion of their assets through debt.
For the metropolitan entities the ratio decreased sharply in 2009–10 as a result of the sector recording its infrastructure assets at fair value for the first time.
The regional urban and rural entities transitioned to fair value in 2010–11, with the revaluation contributing to the slight improvement in the sectors' gearing.
Figure 5K indicates that, with the exception of one entity in 2008–09 and 2012–13, all entities maintained an adequate level of gearing over the period.
Figure 5K
Debt-to-assets risk assessment
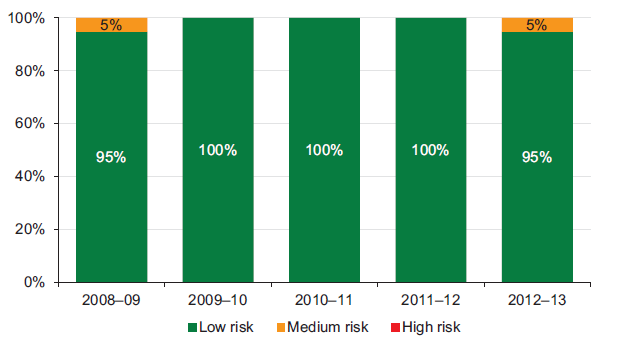
Source: Victorian Auditor-General’s Office.
5.3.6 Self-financing
Figure 5L shows that over the five years, the average self-financing ratio fluctuated. However, the most recent year shows a downward trend, especially for the metropolitan and rural sectors. A downward movement in the self-financing indicator signals that an entity's ability to fund new assets or replace existing assets using cash generated by their operations has declined.
Figure 5L
Average self-financing indicator
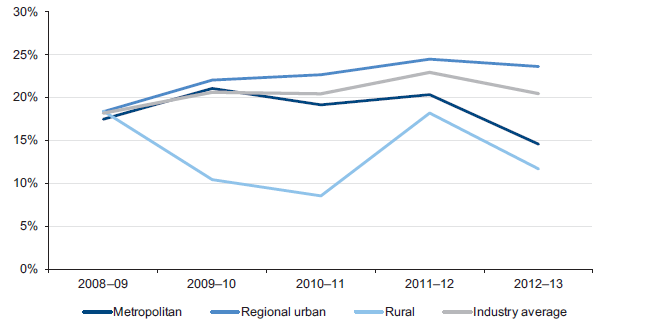
Source: Victorian Auditor-General’s Office.
The timing and magnitude of water price increases has a direct impact on a water entity's revenue and cash flows from operations. In 2012–13, as a result of the over collection of funds relating to the desalination plant, there was a price freeze for metropolitan water entities.
Figure 5M shows that in 2012–13, 21 per cent of entities (four of 19) had a high self‑financing risk compared with 11 per cent (two of 19) in 2011–12.
Figure 5M
Self-financing risk assessment
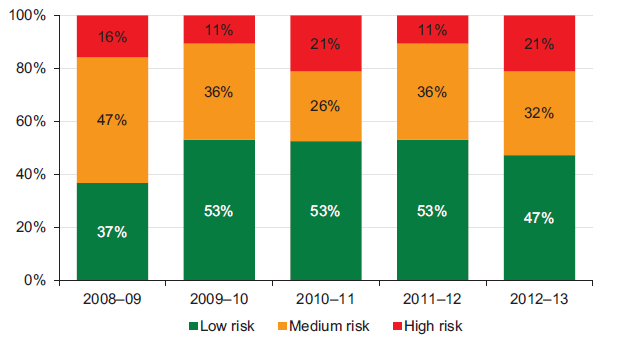
Source: Victorian Auditor-General’s Office.
The number of entities in the low-risk category has been relatively stable over the five‑year period. The number of entities in the high-risk category has fluctuated over the period.
5.3.7 Capital replacement
Figure 5N shows predominantly a downward trend for the average capital replacement indicator over the five years. The downward trend indicates that depreciation expense increased at a rate higher than the level of spending on infrastructure assets. However, caution is required when interpreting these results as annual spending on assets includes new and expanded facilities in addition to existing facilities, but excludes the cost of newly constructed assets that are transferred from another entity.
Figure 5N
Average capital replacement indicator
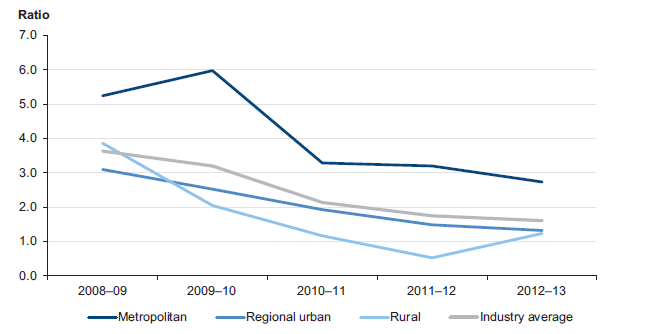
Source: Victorian Auditor-General’s Office.
For the metropolitan water entities the decline in 2010–11 reflected the impact of the revaluation of infrastructure assets in 2009–10. For the regional urban and rural water entities the decline in 2011–12 reflected the impact of the revaluation of their infrastructure assets in 2010–11. Depreciation expense increased in the year following the revaluations as a result of higher asset values.
Figure 5O shows that six water entities, all regional urban, had a capital replacement indicator rated as high risk in 2012–13, which indicates their level of capital spending has not kept pace with the consumption of assets.
Figure 5O
Capital replacement risk assessment
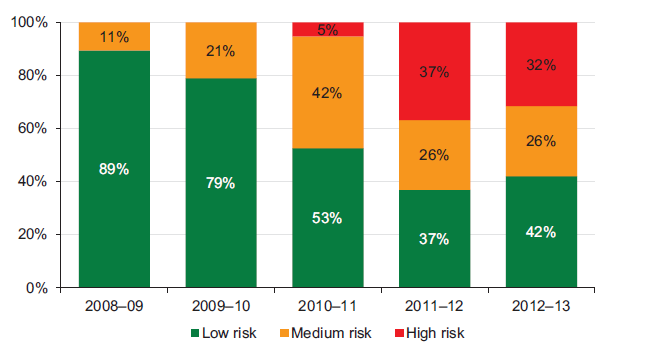
Source: Victorian Auditor-General’s Office.
The shift over the five years from low to medium and high risk is significant and reflects the impact of higher depreciation following the revaluation of assets. It also indicates that spending on capital expenditure is less than depreciation and that water entities are not replacing assets at a pace matching the consumption of assets.
6 Information technology
At a glance
Background
This Part presents the results of our assessment of controls over the general information technology (IT) controls related to preparing financial reports, including the controls over IT security and change management.
Conclusion
IT controls were adequate for producing reliable, materially accurate and timely financial reports. Nevertheless, there are opportunities for the water entities to strengthen their controls to protect information from unauthorised access, theft or manipulation, to ensure the continuity of service provision and to guard against the emergence of external threats and new security risks.
Findings
- Twenty-two general IT control issues raised in prior financial audits remained unresolved at 30 June 2013. The failure to address them reflects poorly on the entities governing bodies and management.
- Thirteen water entities maintained logs of privileged user access, but monitoring processes varied from regular reviews, ad hoc or 'as required' reviews to no review. We identified six instances where privileged user accounts were not managed appropriately.
- Only 12 entities had appropriate processes in place to detect network intrusions and report them when identified. Some water entities engaged external experts to undertake penetration testing to test the robustness of their network security.
- Reporting on security breaches to the board or IT steering committee was by exception rather than as a regular report on the agenda. Six water entities had not established an IT steering committee.
- Given that control weaknesses in relation to IT change management were identified at seven entities as part of the annual financial audit, an opportunity exists for water entities to engage internal auditors or an independent expert to critically review their IT change management policies and procedures, and their compliance with them.
6.1 Introduction
As with most contemporary industries, the water industry relies extensively on information technology (IT), including regular upgrades or the replacement of systems to improve information management and the quality of services provided to the community. Information held by water entities about employees, customers and suppliers, and the financial and operational aspects of the business can be highly sensitive and needs to be protected from unauthorised access, theft or manipulation.
Effective IT controls protect computer applications, infrastructure and information assets from a range of security threats. With the implementation of new systems or the upgrade of existing systems, there is a need to guard against the emergence of external threats and new security risks.
The water entities, as government agencies, are encouraged to implement an IT security framework that includes change management controls consistent with the Whole-of-Victorian-Government (WoVG) Information Security Management Framework (Victorian Government framework).
In this Part we comment on general IT controls, and controls over IT security and change management at the 19 water entities.
6.2 General information technology controls over financial reporting
The IT controls over financial reporting are tested annually during our financial report attest audits. In 2012–13 we found that the controls tested were adequate for producing reliable, materially accurate and timely financial reports. Nevertheless, a number of areas for improvement were identified.
Thirty-three new IT control weaknesses were identified at 11 of the 19 entities during 2012–13 relating to:
- systems access and password management—13 issues
- information systems change management—eight issues
- other security issues—four issues
- information system policies and procedures—four issues
- disaster recovery—two issues
- other IT issues—two issues.
The common observations regarding systems access and password management related to:
- inappropriate levels of user access granted at the application level
- untimely removal of users after terminating their employment
- management of privileged user accounts and monitoring of access
- no periodic review of user access requirements to confirm the access is appropriate given the employee's role and day-to-day responsibilities.
When control weaknesses are identified we assess the risk of error given the nature of the deficiency and consider compensating controls in place that mitigate the risk of a material error in the financial report.
Status of prior year issues
Twenty-two IT issues raised in prior financial audits remained unresolved at six entities at 30 June 2013. One issue was first raised in 2010–11 and is yet to be fully addressed.
Internal control weaknesses reported to an entity's governing body, audit committee and management should be actioned and resolved in a timely manner. The failure to address previously identified and reported internal control weaknesses reflects poorly on both the governing body and management.
6.3 Information technology security
Information security is important for protecting IT applications, infrastructure and information assets from threats, in order to enable business continuity, minimise business risks, mitigate the risks of fraud or error, meet business objectives and protect personal and sensitive information from theft or unauthorised access.
Effective IT security controls mitigate the risks that information will be inappropriately released and that information will be incomplete, unreliable or inaccurate. Ineffective IT security controls increase the risk of financial data losses.
The key elements of an effective IT security framework are detailed in Figure 6A. The framework draws upon the requirements of:
- Victorian Government framework
- WoVG SEC POL 01 Information Security Management Policy – 2012and the three SEC STD Standards
- AS/NZS ISO/IEC 27001:2006 Information technology – Security techniques – Information security management systems
- AS/NZS ISO/IEC 27002:2006 Information technology – Security techniques – Code of practice for information security
- AS/NZS ISO/IEC 27005:2008 Information technology – Security techniques – Information security risk management
- United Kingdom Government best practice IT Infrastructure Library
- Information Systems and Control Association's best practice guidelines.
Figure 6A
Key elements of an effective information technology security framework
|
Component |
Key element |
|---|---|
|
Policy |
There is an IT security policy and it:
|
|
Management practices |
An IT security strategy is developed. A risk-based information classification framework is developed. An IT risk register is developed and maintained. The implementation of risk mitigation strategies is monitored and its effectiveness is assessed. The operation of the following is implemented and monitored by management:
Compliance with information classification frameworks is monitored including that:
Entity-wide training is conducted to develop and maintain an understanding of the policy and procedures. Alignment with industry standards/government requirements is reviewed periodically. Compliance with security policy and requirements, risk and threats, breaches and mitigating actions are regularly reported to the board or subcommittee. Opportunities for improvement to address noncompliance or breaches are taken in a timely manner. Policy and procedures are reviewed, updated and provided to the board for approval periodically. |
|
Governance and oversight |
An information security committee oversees the development and monitoring of security strategies, standards, policies and procedures. An IT steering committee advises management of IT investment requirements and provides guidance on the provision of IT services. Subcommittees consider management reports and monitor the timeliness of management action to address noncompliance, breaches or opportunities for improvements. Subcommittees regularly report to the board on compliance with security policy and requirements, risk and threats, breaches and mitigating action. An IT risk register is reviewed by the board periodically. Compliance with the approved policy is monitored by the board. The policy is reviewed and approved by the board. Internal auditors are used to assess compliance with IT security controls, the veracity of controls and opportunities for improvement periodically. |
Source: Victorian Auditor-General's Office.
We assessed the IT security controls of the 19 water entities against these better practice elements. We found that controls over IT security were generally adequate, though there are areas for improvement.
6.3.1 Policies
Sixteen of the 19 water entities had an approved IT security policy. Policies were being finalised at two entities and one entity did not have an IT security policy and was not developing one.
The IT security policies included many elements of the framework outlined in Figure 6A, and each had been approved by the board, chief information officer (CIO) or executive management team within the past two years.
Fourteen of the 16 policies covered both physical and logical security requirements. Twelve also made reference to the Victorian Government framework and Australian Standards. Four of the 16 did not.
The IT security policies could be further improved by addressing:
- incident management
- information classification principals and requirements
- acquisition, development and maintenance
- governance structures
- the assignment of roles and responsibilities for information security
- physical and logical security requirements
- the minimum requirements of the Victorian Government framework and Australian Standards.
6.3.2 Management practices
Sound management practices over IT security were observed at most water entities, although opportunities for improvement exist. Specifically,
- an IT security strategy had been developed or security requirements were included in a broader entity-wide IT strategy at 11 entities—a further seven are developing or revising their IT strategies
- a risk-based information classification framework had been developed at 12entities and eight of the 12 monitored compliance with information asset identification and information classification requirements
- 16 water entities had a risk register to address IT-specific risks, while the remaining three had elected to incorporate IT risks into their corporate risk register
- all 19 entities had approval processes for granting and/or modifying user access
- all 19 entities required the IT department to be informed when staff and contractors were terminated so that access could be removed in a timely manner
- 12 entities regularly reviewed user access.
While processes had been established, as noted at Section 6.3, our audit did identify instances of noncompliance.
IT security requirements were generally communicated to staff and contractors at induction sessions. Eleven entities had specific IT security training undertaken by all staff on an ad hoc basis. The remaining eight entities should develop and implement training in a structured manner either through in-house refresher courses or training delivered by external providers.
Generic user accounts and privileged access
A lack of monitoring of generic user, shared user, privileged user or system administrator accounts may compromise the security of information, breach change management policies and expose the business to internal and external threats.
Eleven water entities used generic user access for vendor support, but had appropriate controls in place over the accounts. Best practice was observed at six entities where users that need access to the systems are provided with individual access accounts. In these cases, all vendor support accounts were locked when access was not required.
Logging and monitoring of privileged user access is required to ensure that any inappropriate access to data and financial information is detected. Thirteen water entities maintained logs of privileged user access, but the monitoring processes varied from regular reviews, ad hoc or 'as required' reviews to no review. We identified six instances where privileged user accounts were not managed appropriately.
Application and network security
All entities had firewalls, security filters, gateways and antivirus software. However, only 12 had appropriate processes in place to detect network intrusions and report them when identified. When reported, the reporting of intrusions was generally to a steering committee or to executive management.
Detection of network intrusions is essential to maintaining network security. The use of a firewall and software alerts IT staff to actual or potential breaches of network security. Some water entities engaged external experts to undertake penetration testing to test the robustness of the network security protocols.
Maintaining up-to-date software patches is important to prevent known exploitations in software. Generally water entities maintained patches for software. However, we observed two instances where such patches were not maintained.
Seven water entities had not conducted independent assessments of security access to external networks. The use of protocols such as telnet and ftp has the potential to expose networks to external threats, if not properly managed.
Water entities generally enforced password settings for complexity and periodic change at a network and application level in accordance with their IT security policy. However, inconsistencies were noted at three entities regarding the password settings.
6.3.3 Governance and oversight
No water entities reported on IT security to their board unless major intrusions were identified. Generally IT security was considered operational in nature and was reported to executive management, an IT steering committee or equivalent.
The IT steering committee at 13 water entities oversaw IT security, although reporting to the committee on security breaches appeared to be by exception rather than as a regular report on the agenda. Six water entities had not established IT steering committees to specifically address IT issues.
A separate risk register to address IT-specific risks was maintained and reviewed at least annually by 16 water entities. A further three had incorporated IT risks into their corporate risk register. The risk registers were reviewed by the boards at least annually.
All water entities engaged internal auditors as part of their governance and oversight of IT controls. Fourteen had used internal auditors to review IT security over the past two years.
6.4 Information technology change management
In an effective IT environment, changes to IT applications and infrastructure are authorised and implemented in a controlled and secure environment. The key elements of an effective IT change management framework are detailed in Figure 6B. The framework draws upon the requirements of:
- Victorian Government framework
- AS/NZS ISO/IEC 27001:2006 Information technology – Security techniques – Information security management systems – Requirements
- AS/NZS ISO/IEC 27002:2006 Information technology – Security techniques – Code of practice for information security management
- Information Systems and Control Association's best practice guidelines.
Figure 6B
Key elements of an effective information technology change management framework
|
Component |
Key element |
|---|---|
|
Policy |
An IT change management policy is developed and addresses all IT application and infrastructure changes. The policy includes:
The policy is approved by the governing body. |
|
Management practices |
The conduct of awareness training activities is designed to create an understanding of the policy and procedures. Operational effectiveness is maintained. Change management responsibilities are identified and appropriately segregated. Significant changes are identified, recorded and monitored. The impact, including the security impact, of changes is progressively assessed. Changes are planned and tested in separate environments. Compliance with the policy and procedures is monitored. The progress of change implementation, the impact of changes and compliance with the policy is monitored and reported to the governing body regularly. The effectiveness of change and change management practices is evaluated and reported to the governing body. The policy and procedures are reviewed and updated regularly and provided to the governing body for approval. |
|
Governance and oversight |
Reports are provided to the governing body, and opportunities for improvement are considered and acted upon as necessary. Alignment with industry standards/government requirements is reviewed periodically. Changes to the policy and procedures are approved by the governing body. |
Source: Victorian Auditor-General's Office.
We assessed the IT change management controls of the 19 water entities against these better practice elements. We found that controls over IT change management were generally adequate, although there are areas for improvement.
6.4.1 Policies
Twelve of the 19 water entities had an IT change management policy to guide changes within their businesses. Most policies reviewed:
- contained objectives
- defined roles and responsibilities of staff
- established the segregation of duties
- addressed change creation, categorisation, authorisation, reporting and approval requirements
- addressed prioritisation, implementation approaches, testing requirements, version control and release management.
Five of the seven water entities without IT change management policies had other documents or policies that addressed the better practice elements.
One entity followed change management procedures that were not formally documented.
One water entity was transitioning its IT function from an outsourced provider to an in‑house arrangement and was in the process of establishing IT policies incorporating procedures for change management.
Two of the 12 entities with an IT change management policy had their policy approved by the governing body. For the other 10, the policy had been approved by the CIO, the executive management team, the IT steering committee or a change control board. Eight of the 12 had reviewed their policy in the past two years, four were being reviewed in 2012–13.
Eight of the 12 policies made reference to or followed the Victorian Government framework.
All policies examined covered IT application and infrastructure changes including emergency changes, patches, hardware upgrades and configuration. Six of the 12 required operational software to be maintained at versions supported by the vendor.
6.4.2 Management practices
The change management processes were authorised and monitored via steering committees, the CIO, executive management or by the board.
Eighteen of 19 entities addressed IT security risks throughout the IT change process. This was generally achieved by conducting a risk assessment at the planning phase and included regular reviews by project managers and IT staff as projects progressed.
All entities conducted tests of changes in separately managed and controlled non‑production environments to minimise the potential negative impacts on the live working environment. Changes were generally authorised for transfer to the production environment by the CIO, IT steering committee, change control board, project manager or systems administrator.
Fifteen of 19 entities provided staff with training on IT change management. The training varied depending on the degree of change being implemented. Generally there was either:
- awareness training
- ad hoc training
- formal training by external parties.
Where training programs were formalised the training was provided at least once every two years.
The effectiveness of IT change management was evaluated by or reported to an IT steering committee or equivalent where one existed, otherwise its effectiveness was assessed by executive management or the CIO.
6.4.3 Governance and oversight
Nine of the 12 water entities that had a change management policy reviewed the policy at least annually to maintain alignment with the Australian standards.
Change management progress was reported to the governing body or audit committee at five water entities, unless it is an insignificant change. In many cases change management was considered to be an operational matter and was reported to the executive management through an IT steering committee or change control board.
The established IT steering committees and change control boards generally operated under an approved charter that supported the overall governance structure of the entity.
Three of the 19 water entities had practices that required the governing body or audit committee to monitor compliance with IT change management policies. The method of reporting included quarterly IT reports and reports by exception in the case of noncompliance.
Three water entities had used internal auditors to review their change management policies and procedures within the past three years. Given that control weaknesses in relation to IT change management were identified at seven entities as a part of the annual financial audit, an opportunity exists for water entities to engage internal auditors or an independent expert to critically review their IT change management policies, procedures and their compliance with them.
Recommendations
That water entities:
- address information technology control weaknesses in a timely manner in order to ensure sound internal controls are in place and are operating effectively to protect information from unauthorised access, theft or manipulation, to ensure continuity of service provision and to guard against the emergence of external threats and new security risks
- develop and implement comprehensive information technology security and change management policies and procedures
- establish an information technology steering committee to oversight all information technology-related matters including risk management, security and change management
- improve reporting to the information technology steering committee on matters such as risk management, information technology security, change management and network breaches and intrusions
- implement a periodic review of user access to confirm that access rights are commensurate with staff member's roles and responsibilities, and regularly monitor the use of generic and privileged user accounts.
7 Procurement
At a glance
Background
The water industry spent around $2.7 billion on goods, services and capital items in 2012–13. In this Part we comment on the controls over procurement at the 19 water entities.
Conclusion
Procurement frameworks were observed to be generally adequate. However, the high incidence of noncompliance with procurement policies, procedures and control activities identified by internal audits indicates there are opportunities for the governing bodies and management to improve practices.
Our review of seven tenders indicated conflict of interest declarations were not always completed by members of tender evaluation panels. This means that the water entities could not demonstrate they had mitigated the risk of bias in the evaluation process, and that the integrity of the process had been maintained.
Findings
- All 19 water entities have detailed policies and procedures relating to procurement that comply with government policies and guidelines.
- A review of seven tenders identified two tenders where no members of the evaluation panel had completed a conflict of interest declaration.
- Internal audit reviews identified weaknesses and areas of noncompliance in all water entities reviewed, and at four of the 15 entities management was yet to resolve the deficiencies identified.
Recommendations
Water entities should:
- require each member of a tender evaluation panel to complete a conflict of interest declaration at the start of the evaluation process
- address recommendations arising from internal audits in a timely manner and report progress to the audit committee or the board.
7.1 Introduction
The water industry spent around $1.2 billion on goods and services and $1.5 billion on capital items in 2012–13. Consequently effective controls over procurement activities are important.
Entities are required to implement and maintain effective internal controls to ensure that procurement activities satisfy their business needs, are suitably authorised, are in line with policies and procedures and are consistent with the principles of value for money, open and fair competition, accountability, risk management, probity and transparency.
In this Part we comment on the controls over procurement at the 19 water entities. We also report on the results of detailed testing of a selection of contracts awarded during 2012–13 at seven water entities.
7.2 Conclusion
Procurement frameworks were observed to be generally adequate. However, the high incidence of noncompliance with procurement policies, procedures and control activities identified by internal audits indicates there are opportunities for the governing bodies and management to improve practices.
Our review of seven tenders also indicated that conflict of interest declarations were not always completed by members of tender evaluation panels. This means that the water entities could not demonstrate they had mitigated the risk of bias in the evaluation process, and that the integrity of the process had been maintained.
7.3 Procurement management framework
The key elements of an effective procurement management framework are detailed in Figure 7A. The framework draws upon the:
- Victorian Government Purchasing Board policies
- Standing Directions of the Minister for Finance under the Financial Management Act 1994
- VAGO Public Sector Procurement: Turning Principles into Practiceguidance.
Figure 7A
Key elements of an effective procurement framework
|
Component |
Key elements |
|---|---|
|
Policy |
Procurement and tendering policies exist and include:
A strategic procurement plan is required detailing all activities during the procurement process for high-value, high-risk or complex procurement exercises. The policy is approved by the governing body. |
|
Management practices |
A probity plan is developed for all high-value, high-risk or complex procurements. Conflicts of interest, actual or perceived, are identified and declared. An evaluation plan is clearly documented and specifies each evaluation panel member's responsibility. A probity auditor is required for complex procurement or procurement over $10 million. Tender submissions are evaluated fairly against identical criteria. Tender submissions are evaluated by suitably qualified staff. There is documented evidence to demonstrate the fairness and transparency of the tender process. There is compliance and monitoring of established procurement policies, as well as government requirements. Post-tender evaluations are conducted. Long-term purchasing arrangements are periodically assessed to confirm performance, value for money or to identify alternative suppliers. There is an analysis of value for money achieved under procurement arrangements. There is comprehensive and regular reporting to management and the governing body. Management review of policies, practices and procedures occurs periodically. |
|
Governance and oversight |
Procurement risks are included and managed in the entity's risk register. There is oversight and authorisation of probity plans for all high-value, high-risk or complex procurement. There is monitoring of procurement performance and the results of significant tenders. Internal audits are used to assess compliance with policies and delegations, and opportunities for improvement periodically, and a report is provided to the governing body or delegated subcommittee. Policies are reviewed periodically and changes are approved by the governing body. |
Source: Victorian Auditor-General's Office.
We assessed the arrangements in place at the 19 water entities against these elements.
7.4 Policies
All 19 entities had detailed policies and procedures relating to procurement, which included tendering, that complied with government policies and guidelines. The majority included:
- an objective
- financial delegations and authorisation requirements
- probity requirements and the stated need to avoid any actual or perceived bias or preferential treatment
- details on when an open tender, selective tender, limited tender or quotation is required
- detail on when an exemption from public and selective tendering is permitted.
The policies should be strengthened by including the process and arrangements to be adopted for obtaining quotes, specifying reporting frequencies and accountabilities, and the rules and requirements for purchases made using corporate cards.
All procurement and tendering policies and procedures were current and approved by the governing body or management where approval had been delegated.
7.5 Management practices
The management of the 19 water entities adequately oversee procurement processes.
For all high-value, high-risk or complex procurements, probity plans were required to be developed.
Victorian Government Purchasing Board policies state that probity auditors should be engaged for all procurement in excess of $10 million. Thirteen of 19 water entities require probity auditors to be used for complex procurement exercises or where procurement involves amounts over $10 million. Five entities had not considered the use of probity auditors as they do not procure items in excess of $10 million. The policies and procedures at one entity do not require probity auditors to be used.
Eighteen of 19 water entities have procedures that require the preparation of evaluation criteria for each tender and guidance material to assist tender evaluation panels' assessments and scoring of tenders.
Post-tender evaluations should be conducted to identify opportunities for improvement in procurement. Post-tender evaluations are required at 17 of 19 water entities, however, the degree of evaluation varied. For example:
- evaluations are required to occur within a specified time frame after awarding contracts at 13 water entities
- lessons learnt are documented and applied to future procurement activities at 14water entities.
All water entities assessed contracts to confirm the value for money of the arrangement at the tender evaluation phase. Management stated that the frequency of assessments at subsequent phases varies depending on the type and dollar value of the procurement.
7.6 Governance and oversight
Procurement and related risks were identified and considered in the risk registers of most water entities. Risks and mitigation plans were reviewed on a quarterly and/or yearly basis by management, the audit committee and governing body.
The boards of all water entities monitored compliance with procurement policies. Fifteen water entities had used internal audits to review procurement policies, procedures and the effectiveness of key controls over the past three years. The internal audits had identified weaknesses and areas of noncompliance in all water entities. At four of the entities, management was yet to resolve the deficiencies identified.
Regular and comprehensive reporting on procurement is provided to all water entity boards. Sixteen of 19 entities generated reports showing a summary and commenting on recent tender activities with further detail on high-value, high-risk procurement activities, and actual spend compared to contractual amount and/or budget.
7.7 Contract testing
At seven of the 19 water entities we selected one contract entered into in 2012–13 for detailed testing. It was pleasing that all seven contracts had been subject to a competitive tender, that specifications were clearly documented prior to tendering and that procurement plans existed for each. The procurement plans addressed the following matters:
- a business case
- options for achieving desired outcomes
- initial estimates of cost
- risk management
- performance measures.
The procurement plans could be improved by including:
- consideration of potential partnerships and alliances
- a market capability analysis.
The tender process for each of the seven contracts involved a tender evaluation panel consisting of members with sufficient technical knowledge of the goods, services or capital items being procured. However, for two of the seven panels reviewed, no evaluation panel member had completed a conflict of interest declaration. This means that water entities could not demonstrate they had mitigated the risk of bias in the evaluation process, and that integrity had been maintained.
Tender evaluation plans or equivalent documentation existed for each of the seven contracts and included evaluation criteria and a scoring regime for each criterion, and outlined each panel member's responsibilities. Tender evaluation reports were prepared that documented:
- each tenderer's score against the pre-determined criteria
- the total score for each tenderer
- the value‑for‑money assessment
- the rationale for selecting the preferred tender.
After awarding the contract, the performance of the contractor was monitored by a project manager for each of the seven contracts reviewed. Depending on the type of contract, the performance was monitored through progress reports, site visits and/or a review of compliance with service standards.
Recommendations
That water entities:
- require each member of a tender evaluation panel to complete a conflict of interest declaration at the start of the evaluation process
- address recommendations arising from internal audits in a timely manner and report progress to the audit committee or the board.
8 Treasury management
At a glance
Background
An effective treasury function should monitor and manage cash flows to minimise borrowing costs while providing sufficient cash to meet obligations when they fall due. In this Part we comment on treasury management at the 19 water entities.
Conclusion
Controls over treasury management at most water entities were established, however, the level of compliance with the approved policies and procedures varied. Improvements can be made with respect to compliance with the Treasury management guidelines at some entities. There is a need for the Department of Treasury and Finance (DTF) to more actively oversight treasury management by the water entities.
Findings
- One entity delayed final payment to a contractor as insufficient funds were available when payment was due. It incurred a penalty interest charge of 18percent on the outstanding amount, a waste of approximately $90 000.
- Four entities breached their own treasury management policies by not adhering to their approved debt maturity profiles during 2012–13.
- Four water entities did not align their borrowings with the related capital projects, reducing accountability over their use of borrowed funds.
- Not all water entities provided their treasury management policies to DTF for review prior to approval. Ten of 19 water entities did not complete their 2011–12 compliance certifications within one month of the year end as required by DTF.
Recommendations
- That water entities improve the monitoring of their debt maturity profiles in order to ensure compliance with approved policies, and to confirm the availability of funds to meet their contractual obligations as and when they fall due.
- That DTF take a more active role in overseeing the treasury management activities of entities, including their compliance with the requirements of the DTF Treasury management guidelines.
8.1 Introduction
An effective treasury function should monitor and manage cash flows so that the cost of borrowings are minimised while ensuring that sufficient cash is available to meet obligations when they fall due. The importance of an effective treasury function has increased over the past five years, as significant investment in new infrastructure across the water industry has been largely funded by borrowings.
The 19 water entities had borrowings of $14.5 billion at 30 June 2013, with $12.3 billion relating to the four metropolitan water entities—Melbourne Water, City West Water, South East Water and Yarra Valley Water. In recent years regional urban water entities have also increased their borrowings.
All borrowings are sourced from the Treasury Corporation of Victoria (TCV) in accordance with the Borrowings and Investment Powers Act 1987. The Department of Treasury and Finance (DTF) is responsible for ensuring that government objectives in relation to treasury management are achieved.
In this Part we comment on the policies, management practices, governance and oversight of treasury management activities at the 19 water entities.
8.2 Conclusion
Controls over treasury management at most water entities were established, however, the level of compliance with the approved policies and procedures varied. Improvements can be made in adhering to the requirements of the DTF Treasury management guidelines, complying with maturity profiles, aligning borrowings with related capital projects and effectively managing the cash flow requirements of the entity to ensure sufficient cash is available to meet obligations when they fall due.
There is also a need for DTF to take a more active oversight role as not all water entities submit their policies to DTF before approving them, and annual attestations of compliance are not provided to DTF within the required time frame.
8.3 Treasury management framework
The key elements of an effective treasury management framework are detailed in Figure 8A. The framework draws upon the Treasury management guidelines published by DTF.
Figure 8A
Key elements of an effective treasury management framework
Component |
Key element |
|---|---|
Policy |
A treasury management policy exists and includes:
Policies and procedures are readily accessible to responsible staff. |
Management practices |
Debt levels/financing costs and maturity profiles are incorporated into corporate plans and management accounts. Business cases are prepared for projects to be funded by new borrowings. The level of the cash management account (11 a.m. account) maintained with TCV to meet immediate financial obligations is considered. Compliance with approved policies and procedures is monitored and assessed by management. There is a review of policies and procedures for currency and relevance periodically. DTF is consulted in developing or reviewing policies. Comprehensive reporting to management and the governing body occurs regularly. |
Governance and oversight |
Policies are forwarded to DTF for review/comment prior to approval. Regular reports from management are considered by the governing board and/or subcommittee. Certification is provided to DTF annually that the entity is operating within the approved treasury policy parameters. Internal auditors are engaged periodically to review policy compliance and processes and to identify opportunities for improvement. Policies and procedures are approved by the governing body. |
Source: Victorian Auditor-General's Office.
We assessed the arrangements in place at the 19 water entities against these elements.
8.4 Policies
All water entities had treasury management policies that were robust and addressed most of the elements outlined in Figure 8A. All policies:
- clearly assigned treasury function responsibilities to staff and/or positions
- referred to relevant authoritative documents such as the Borrowings and Investment Powers Act 1987and DTF's Treasury management guidelines
- were approved by the board.
8.4.1 Submitting treasury management policies to the Department of Treasury and Finance for comment
While policies were approved by the board, four water entities did not submit their policies to DTF for review, as required by the Treasury management guidelines. The guidelines state that:
- 'the draft should be submitted together with a copy of the board minute documenting the board's approval of the draft
- any revisions of the treasury policy document are also required to be resubmitted to DTF for comment prior to obtaining board approval for the final policy'.
8.5 Management practices
The following key controls had been implemented by management at all water entities:
- segregation of duties
- appropriate restriction of access to bank accounts and accounts payable
- reconciliation of borrowings to the general ledger
- reconciliation of all bank accounts
- monitoring of actual borrowings compared to approved borrowing limits.
Management reporting contained details of cash flow projections, the maturity profile of the debt, commentary over the annual borrowing limit and a new borrowings forecast.
8.5.1 Monitoring compliance with approved maturity profiles
Management at all water entities monitored borrowing levels and short- and long-term cash flow requirements against approved corporate plans. The frequency of monitoring varied across entities—daily, weekly, monthly, quarterly or annually. Entities with significant borrowings generally monitor their cash flow requirements on a daily or weekly basis whereas an entity with minimal borrowings was more likely to be monthly or quarterly.
Despite the level and frequency of monitoring, four water entities breached their approved maturity profiles. These entities prepared monthly reports relating to borrowings. The governing body approved the maturity profiles. This is significant as noncompliance with treasury management policies can result in a water entity receiving a penalty from DTF, and the entity can have its borrowing rights revoked and/or be subjected to a more onerous borrowing approval process. At each of the four entities, once the breach was detected, it was fixed and the breach reported to DTF.
8.5.2 Managing and monitoring cash requirements to meet commitments
Water entities are responsible for mitigating their liquidity risk, that is, the risk that they do not have sufficient funds to meet their commitments or to deal with crises brought on by unforeseen events.
During the 2012–13 financial audit of one entity we found the entity was unable to meet the final payments for a major capital project completed in 2012–13 because insufficient cash was available when payment was due, and the entity's borrowing limit had been reached. As a result, the entity chose to defer the final payment rather than apply for an increase in its borrowing limit. This action invoked a penalty interest clause in the contract, and the entity incurred interest on the outstanding balance at a rate of 18 per cent until the payment could be made in July 2013. This example of ineffective treasury management amounted to the waste of approximately $90 000.
The example shows the critical link between the procurement and treasury management functions, which can assist the board and management with their decision-making and the setting of an appropriate maturity profile to manage their cash flows.
In the case of major capital projects, a board should assess the implication of different scenarios—project delivered on time or ahead of schedule—from a cash management perspective to ensure that sufficient funds are available to meet the entity's contractual obligations as and when they fall due. In the example, the contract provided for completion and payment in 2012–13, however, the entity had not made the necessary arrangements to ensure that the final payment could be made in the event the project was delivered on time.
Fifteen of 19 water entities prepare business cases for new projects to be funded by new borrowings. However, four do not align their borrowings to specific capital projects. Instead, they draw down on their approved borrowing facilities based on the need to make payments for their entire capital program. This means that accountability over the use of borrowed funds is reduced when it is not aligned to specific projects.
8.6 Governance and oversight
The information provided to the board should allow it to effectively monitor an entity's performance and make informed decisions. In relation to treasury management, the management and the governing body of water entities received reports containing:
- a summary of recent treasury activities—at 17 of 19 entities
- approved borrowing limits—at 16 of 19 entities
- year-to-date draw downs—at 17 of 19 entities
- the maturity profile—at 16 of 19 entities
- an interest expense analysis—at 16 of 19 entities
- breaches of their debt maturity profile,reasons for them and actions taken to rectify the matter—at the entities where breaches occurred.
Reporting to the board occurred monthly or quarterly at most entities.
The boards of 18 of the 19 water entities monitored compliance with the approved treasury management policies and procedures. The other, given its low level of debt, only monitored its cash flow requirements.
While monitoring occurs, there is an opportunity for water entities to revisit the rigour of their review and monitoring processes given that debt maturity profiles were breached at four entities and one entity had insufficient funds available to meet its contractual obligations.
Furthermore, Melbourne Water was subject to a $4 billion borrowing limit under the Borrowings and Investment Powers Act 1987. As part of the 2012–13 audit we flagged the borrowing limit with management as there was a risk that the limit may have been exceeded. Prior to its identification by audit, DTF, Melbourne Water and TCV appeared unaware of the borrowing cap. As soon as the borrowing cap was brought to Melbourne Water's attention it actively addressed the matter with DTF and TCV. Without removing the limit, Melbourne Water would have been constrained in managing its financial obligations, affecting its ability to make payments relating to the desalination plant as and when they fell due.
The Borrowings and Investment Powers Act 1987 was amended by the Borrowings and Investment Powers Amendment Act 2013, which received royal assent on 28 June 2013. The amendments resulted in the removal of the borrowing limit.
A board is required to complete and provide an Annual Certification of Compliance to DTF within a month after year end, in line with the requirements of DTF's Treasury management guidelines. For 2011–12, the boards at 10 of 19 water entities did not complete their certifications within the time frame. This was because the boards at the 10 entities did not meet during July 2012.
8.6.1 Department of Treasury and Finance oversight
DTF is responsible for ensuring that government objectives in relation to treasury management are achieved. A key part of this role is to set guidelines that enable entities to effectively manage their treasury functions and monitor, and report on, the associated risks. DTF is also responsible for advising the Treasurer on treasury management issues affecting the state, including making recommendations about the borrowing powers of entities.
DTF's oversight responsibilities for the water entities' borrowings include:
- reviewing and providing input into treasury management policies
- reviewing requests submitted to the Treasurer for approval, including requests for new borrowings or for the refinancing of maturing debt
- receiving an annual attestation from all water entities within one month of year end that they have complied with the approved policies.
The water industry has increased its level of interest bearing liabilities by $10.3 billion, or 248 per cent, over the past five years. Consequently, and in light of our observations, there is a need for DTF to take a more active oversight role to ensure compliance with its Treasury management guidelines. Ineffective oversight at a central agency level may have adverse implications for the achievement of state government objectives in relation to treasury management.
8.6.2 Internal audit
Over the past three years, 12 of 19 water entities used internal audits to review their treasury management policies and assess compliance with them. At seven of the 12, management had addressed the findings and issues raised. No issues were identified by internal audits at the remaining five entities.
An internal audit of treasury management was not conducted at seven entities in the past three years. Of the seven:
- three have internal audits scheduled in the next 12 months
- four assessed their treasury management risk as low and determined that a separate internal audit was not required.
Recommendations
- That water entities improve the monitoring of their debt maturity profiles in order to ensure compliance with approved policies, and to confirm the availability of funds to meet their contractual obligations as and when they fall due.
- That the Department of Treasury and Finance take a more active role in overseeing the treasury management activities of entities, including their compliance with the requirements of the Department of Treasury and Finance's Treasury management guidelines.
Appendix A. VAGO Reports on the results of the 2012–13 financial audits
This report is part of a suite of reports presented to Parliament covering the results of our audits of public sector financial reports. The reports are outlined in Figure A1.
Figure A1
VAGO reports on the results of the 2012–13 financial audits
|
Report |
Description |
|---|---|
|
Auditor-General's Report on the Annual Financial Report of the State of Victoria, 2012–13 |
The report provides the result of the audit of the state's annual financial report. The report addresses the quality and timing of financial reporting, explains significant financial results for the state and financial implications of significant projects and developments that occurred during 2012–13. Tabled in Parliament in November 2013. |
|
Portfolio Departments and Associated Entities: Results of the 2012–13 Audits |
The report provides the results of the audits of approximately 210 entities. The report addresses their financial reporting, financial sustainability and reporting development, the use of contractors and temporary staff, and management of business continuity and information technology disaster recovery planning. Tabled in Parliament in November 2013. |
|
The report provides the results of the audits of approximately 110 entities in the public hospital sector. It addresses their financial performance, financial sustainability, and management of private patient fees and risk. Tabled in Parliament in November 2013. |
|
|
The report provides the results of the audits of approximately 100 entities in the local government sector. The report addresses their financial and performance reporting, financial sustainability, aspects of how they manage rate revenue, and the operation of audit committees. Tabled in Parliament in December 2013. |
|
|
Water Entities: Results of the 2012–13 Audits This report |
This report provides the results of the audits of 20 entities in the water sector. The report addresses their financial and performance reporting, financial sustainability, and comments on internal controls relating to information technology security and change management, procurement and treasury management. Tabled in Parliament in December 2013. |
|
Tertiary Education and Other Entities: Results of the 2013 Audits |
This report provides the results of the audits of approximately 110 entities with a financial year other than 30 June 2013. The report will address their financial and performance reporting, financial sustainability, their financial policies and delegations, and management of procurement. Proposed to be tabled in Parliament in May 2014. |
Source: Victorian Auditor-General’s Office.
Appendix B. Frameworks
Internal control framework
Figure B1 identifies the main components of an effective internal control framework.
Figure B1
Components of an internal control framework
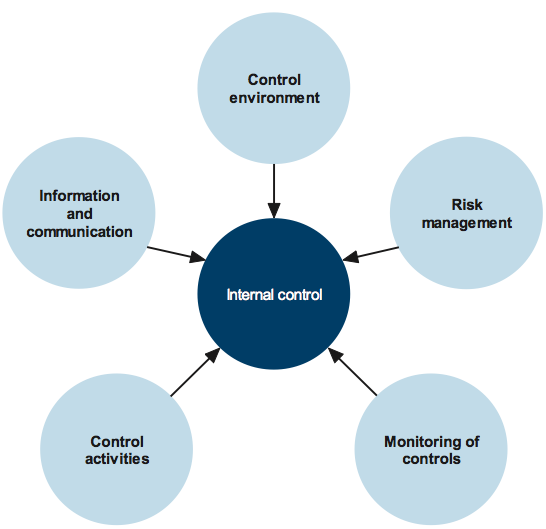
Source: Victorian Auditor-General’s Office.
In the diagram:
- the control environment provides the fundamental discipline and structure for the controls and includes governance and management functions and the attitudes, awareness, and actions of those charged with governance and management of an entity
- risk management involves identifying, analysing and mitigating risks
- monitoring of controls involves observing the internal controls in practice and assessing their effectiveness
- control activities are policies, procedures and practices prescribed by management to help meet an entity's objectives
- information and communication involves communicating control responsibilities throughout the entity and providing information in a form and time frame that allows officers to discharge their responsibilities.
The annual financial audit enables the Auditor-General to form an opinion on an entity's financial report. Integral to this, and a requirement of Australian Auditing Standard 315, Identifying and Assessing the Risks of Material Misstatement through Understanding the Entity and Its Environment, is to assess the adequacy of an entity's internal control framework and governance processes related to its financial reporting.
Internal control weaknesses we identify during an audit do not usually result in a 'qualified' audit opinion. A qualification is usually warranted only if weaknesses cause significant uncertainty about the accuracy, completeness and reliability of the financial information being reported. Often, an entity will have compensating controls that mitigate the risk of a material error in the financial report.
Weaknesses we find during an audit are brought to the attention of an entity's chairperson, managing director and audit committee by way of a management letter.
Section 16 of the Audit Act 1994 empowers the Auditor-General to report to Parliament on the results of audits. This report includes the results of our review of internal controls related to the financial reporting responsibilities of the water industry.
Financial report preparation
Our assessment of financial reporting performance against better practice was based on criteria outlined in Figure B2.
Figure B2
Financial report preparation better practice
Key area |
Better practice |
|---|---|
Financial report preparation plan |
Establish a plan that outlines the processes, resources, milestones, oversight, and quality assurance practices required in preparing the financial report. |
Preparation of shell statements |
Prepare a shell financial report and provide it to the auditors early to enable early identification of amendments, minimising the need for significant disclosure changes at year end. |
Materiality assessment |
Assess materiality, including quantitative and qualitative thresholds, at the planning phase in consultation with the audit committee. The assessment assists preparers to identify potential errors in the financial report. |
Monthly financial reporting |
Adopt full accrual monthly reporting to assist in preparing the annual financial report. This allows the year-end process to be an extension of the month-end process. |
Quality control and assurance procedures |
Require rigorous review of the supporting documentation, data and the financial report itself by an appropriately experienced and independent officer prior to providing it to the auditors. |
Supporting documentation |
Prepare high-standard documentation to support and validate the financial report and provide a management trail. |
Analytical reviews |
Undertake rigorous and objective analytical review during the financial report preparation process to help to improve the accuracy of the report. |
Reviews of controls/ self-assessment |
Establish sufficiently robust quality control and assurance processes to provide assurance to the audit committee on the accuracy and completeness of the financial report. |
Competency of staff |
The preparers of the financial report have a good understanding of, and experience in, applying relevant accounting standards and legislation. They also have effective project management and interpersonal skills. |
Financial compliance reviews |
Undertake periodic compliance reviews to identify areas of noncompliance or changes to legislation that impact the financial report. |
Adequate security |
Protect and safeguard sensitive information throughout the process to prevent inappropriate public disclosure. |
Source: Victorian Auditor-General's Office, and Australian National Audit Office Better Practice Guide Preparation of Financial Statements by Public Sector Entities, June 2009.
Performance report preparation
Our assessment of performance reporting performance against better practice was based on criteria outline in Figure B3.
Figure B3
Performance report preparation better practice
Key area |
Better practice |
|---|---|
Performance report preparation plan |
Establish a plan that outlines the processes, resources, milestones, oversight, and quality assurance practices required in preparing the performance report. |
Preparation of shell statements |
Prepare a shell performance report and provide to the auditors early to enable early identification of amendments, minimising the need for significant disclosure changes at year end. |
Materiality assessment |
Assess materiality, including quantitative and qualitative thresholds, at the planning phase in consultation with the audit committee. The assessment assists preparers to identify potential errors in the performance report. |
Monthly performance reporting |
Adopt monthly reporting to assist in preparing the annual performance report. This allows the year-end process to be an extension of the month-end process. |
Quality control and assurance procedures |
Require rigorous review of the supporting documentation, data and the performance report itself, by an appropriately experienced and independent officer prior to providing it to the auditors. |
Supporting documentation |
Prepare high-standard documentation to support and validate the performance report, and provide a management trail. |
Reviews of controls/ self-assessment |
Establish sufficiently robust quality control and assurance processes to provide assurance to the audit committee on the accuracy and completeness of the performance report. |
Competency of staff |
The preparers of the performance report have a good understanding of, and experience in, applying relevant requirements and legislation. They also have effective project management and interpersonal skills. |
Performance compliance reviews |
Undertake periodic compliance reviews to identify areas of noncompliance or changes to ministerial directives that impact the performance report. |
Adequate security |
Protect and safeguard sensitive information throughout the process to prevent inappropriate public disclosure. |
Source: Victorian Auditor-General's Office.
Appendix C. Audit status
Financial audits
Audit types |
Financial statements |
Timeliness of audited financial statement completion |
||||||
|---|---|---|---|---|---|---|---|---|
Entity |
FMA |
Non-FMA |
Clear opinion issued |
Auditor-General's report signed |
Within 12 weeks |
More than 12 weeks |
||
COMPLETED AUDITS WITHIN 30 JUNE 2013 BALANCE DATES |
||||||||
METROPOLITAN | ||||||||
| Wholesaler | ||||||||
Melbourne Water |
• |
✔ |
10 Sep 2013 |
• |
||||
| Retailers | ||||||||
City West Water |
• |
✔ |
30 Aug 2013 |
• |
||||
South East Water |
• |
✔ |
26 Aug 2013 |
• |
||||
Yarra Valley Water |
• |
✔ |
14 Aug 2013 |
• |
||||
REGIONAL URBAN | ||||||||
Barwon Water |
• |
✔ |
21 Aug 2013 |
• |
||||
Central Highlands Water |
• |
✔ |
02 Sep 2013 |
• |
||||
Coliban Water |
• |
✔ |
21 Aug 2013 |
• |
||||
East Gippsland Water |
• |
✔ |
30 Aug 2013 |
• |
||||
Gippsland Water |
• |
✔ |
27 Aug 2013 |
• |
||||
Goulburn Valley Water |
• |
✔ |
30 Aug 2013 |
• |
||||
GWMWater |
• |
✔ |
21 Aug 2013 |
• |
||||
Lower Murray Water |
• |
✔ |
02 Sep 2013 |
• |
||||
North East Water |
• |
✔ |
29 Aug 2013 |
• |
||||
South Gippsland Water |
• |
✔ |
29 Aug 2013 |
• |
||||
Wannon Water |
• |
✔ |
20 Aug 2013 |
• |
||||
Western Water |
• |
✔ |
30 Aug 2013 |
• |
||||
Westernport Water |
• |
✔ |
04 Sep 2013 |
• |
||||
RURAL | ||||||||
Goulburn-Murray Water |
• |
✔ |
28 Aug 2013 |
• |
||||
Watermove(a) |
C |
✔ |
29 Oct 2013 |
• |
||||
Southern Rural Water |
• |
✔ |
30 Aug 2013 |
• |
||||
2012–13 Total number of entities = 20 |
19 |
1 |
19 |
1 |
||||
Per cent |
95 |
5 |
||||||
2011–12 Total number of entities = 20 |
16 |
4 |
19 |
1 |
||||
Per cent |
95 |
5 |
||||||
Note: FMA
– Financial
Management Act 1994.
Note: Non-FMA
audit types: C – Corporations Act 2001.
Note: The performance report for Melbourne Water and for regional urban and rural water entities were completed on the same date as the financial report. A clear opinion was issued.
(a) Watermove
is a controlled subsidiary of Goulburn-Murray Water. The financial report for
Watermove for 2011–12 was finalised on 5 April 2013.
Source: Victorian
Auditor-General's Office.
Other audit services
Entity |
Description |
Purpose |
Period |
Date of report |
|---|---|---|---|---|
Goulburn-Murray Water |
East Loddon Pipeline Project acquittal |
To certify that the amount reported as expended on the East Loddon Pipeline Project was in accordance with the funding agreement. |
1 January 2011 to 14 June 2013 |
20 June 2013 |
Melbourne Water |
Review of waterways and drainage charges |
To assess the:
|
2012–13 |
27 Nov 2013 |
Source: Victorian Auditor-General's Office.
Appendix D. Entity level financial sustainability
Indicators of financial sustainability
This Appendix sets out the financial indicators used in this report. The indicators should be considered collectively, and are more useful when assessed over time as part of a trend analysis. The indicators have been applied to the published financial information of the 19 water entities for the five-year period 2008–09 to 2012–13.
The analysis of financial sustainability in this report reflects on the position of each entity individually, and of each water sector as a category. The financial sustainability indicators used in this report are indicative of the financial sustainability of the water entities.
The financial sustainability indicators are outlined in Figure D1.
Figure D1
Financial sustainability indicators
|
Indicator |
Formula |
Description |
|---|---|---|
|
Underlying result (per cent) |
Net result / Total underlying revenue |
A positive result indicates a surplus, and the larger the percentage, the stronger the result. A negative result indicates a deficit. Operating deficits cannot be sustained in the long term. Underlying revenue does not take into account one‑off or non-recurring transactions. Net result and total underlying revenue is obtained from the comprehensive operating statement. |
|
Liquidity (ratio) |
Current assets / Current liabilities |
This measures an entity’s ability to pay existing liabilities in the next 12 months. A ratio of one or more means there are more cash and liquid assets than short-term liabilities. Current liabilities exclude long-term employee provisions and revenue in advance. |
|
Interest cover (ratio) |
Net operating cash flows before net interest and tax payments / Net interest payments |
This measures an entity’s ability to meet ongoing interest payments and ability to service debt. Net operating cash flows and net interest and tax payments are obtained from the cash flow statement. |
|
Debt service cover (ratio) |
Profit plus interest, depreciation and amortisation / Total interest and debt repayments |
This measures the ability of an entity to repay its debt from operating profits. Profit, interest, depreciation and amortisation are taken from the comprehensive operating statement. Total interest and debt repayments are taken from the cash flow statement. |
|
Debt-to-assets (ratio) |
Debt / Total assets |
This is a longer-term measure that compares all current and non-current interest bearing liabilities to total assets. It complements the liquidity ratio which is a short‑term measure. A low ratio indicates less reliance on debt to finance the assets of an organisation. |
|
Self-financing (per cent) |
Net operating cash flows / Total underlying revenue |
This measures an entity’s ability to replace assets using cash generated by the entity’s operations. The higher the percentage the more effectively this can be done. Net operating cash flows are obtained from the cash flow statement. |
|
Capital replacement (ratio) |
Cash outflows for infrastructure, property, plant and equipment and intangibles/ Depreciation and amortisation |
Comparison of the rate of spending on infrastructure, property, plant and equipment and intangibles with its depreciation and amortisation. Ratios higher than 1:1 indicate that spending is faster than the depreciating rate. This is a long-term indicator, as capital expenditure can be deferred in the short term if there are insufficient funds available from operations, and borrowing is not an option. Cash outflows for infrastructure, property, plant and equipment and intangibles are taken from the cash flow statement. Depreciation is taken from the comprehensive operating statement. |
Source: Victorian Auditor-General’s Office.
Financial sustainability risk assessment criteria
The financial sustainability of each water entity has been assessed using the risk criteria outlined in Figure F2.
Figure D2
Financial sustainability indicators – risk assessment criteria
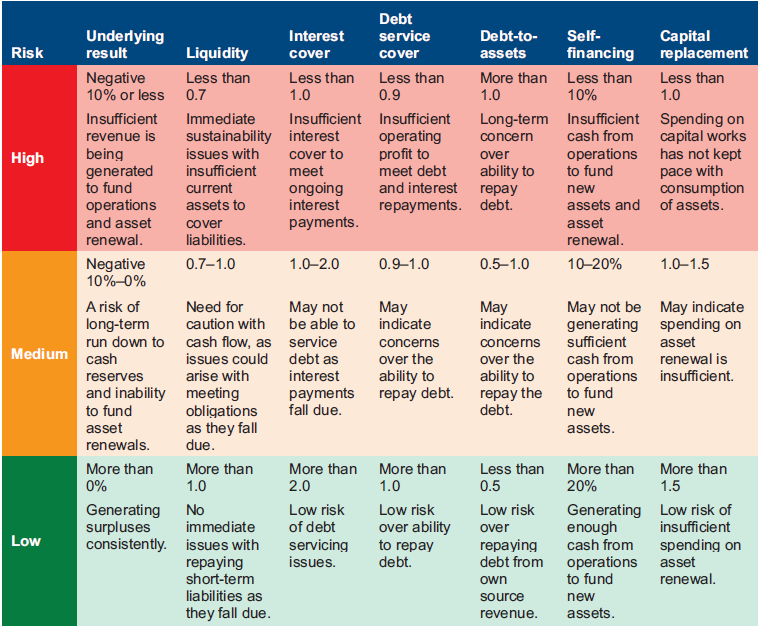
Source: Victorian Auditor-General’s Office.
The overall financial sustainability risk assessment has been calculated using the ratings determined for each indicator as outlined in Figure D3. A trend has also been determined for each ratio by entity and the sector.
Figure D3
Overall financial sustainability risk assessment
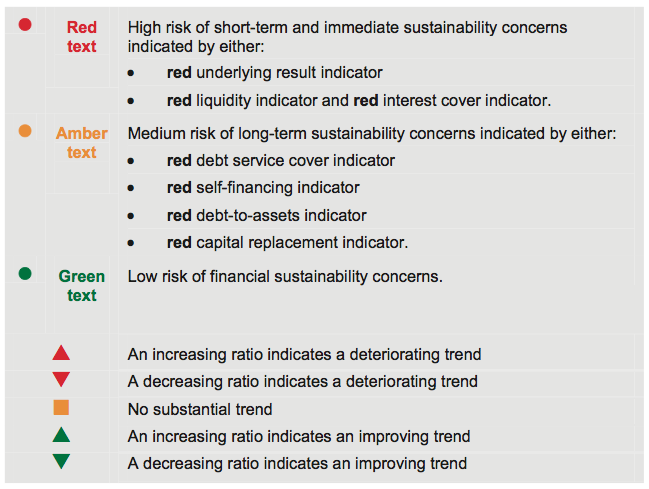
Metropolitan
Wholesaler
Figure D4
Melbourne Water
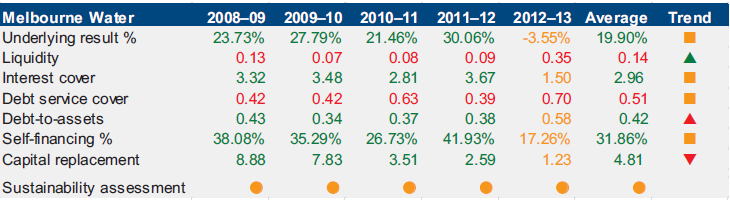
Source: Victorian Auditor-General’s Office.
Retailers
Figure D5
City West Water
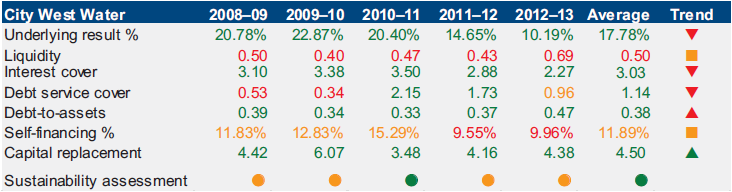
Source: Victorian Auditor-General’s Office.
Figure D6
South East Water
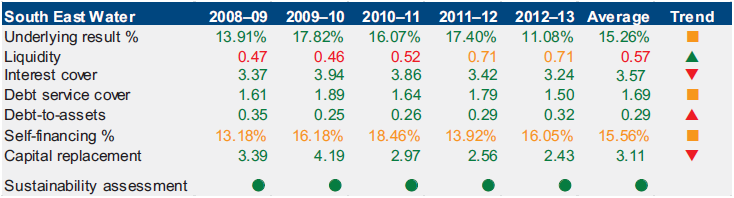
Source: Victorian Auditor-General’s Office.
Figure D7
Yarra Valley Water
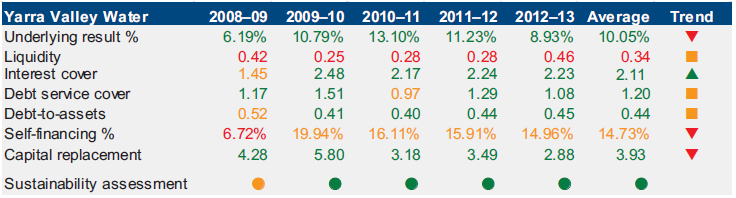
Source: Victorian Auditor-General’s Office.
Figure D8
Metropolitan Average
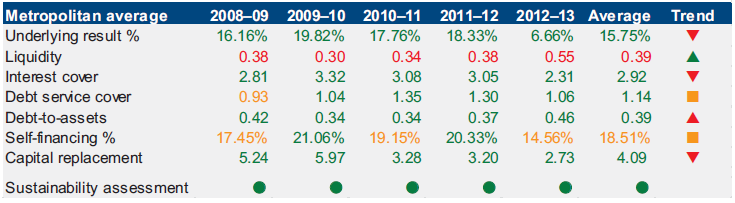
Source: Victorian Auditor-General’s Office.
Regional urban
Figure D9
Barwon Water
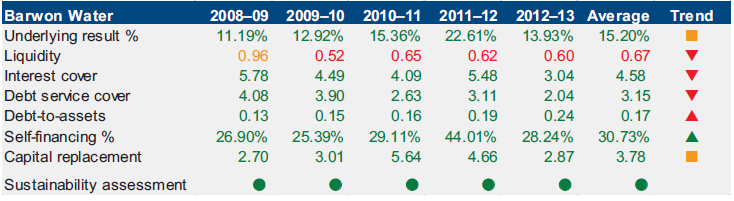
Source: Victorian Auditor-General’s Office.
Figure D10
Central Highlands Water
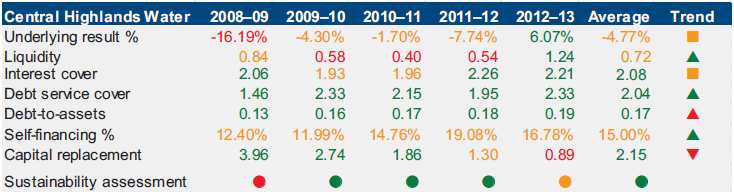
Source: Victorian Auditor-General’s Office.
Figure D11
Coliban Water
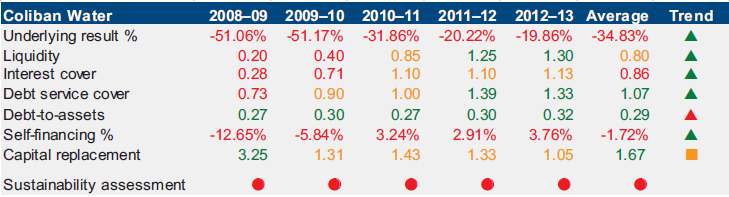
Source: Victorian Auditor-General’s Office.
Figure D12
East Gippsland Water
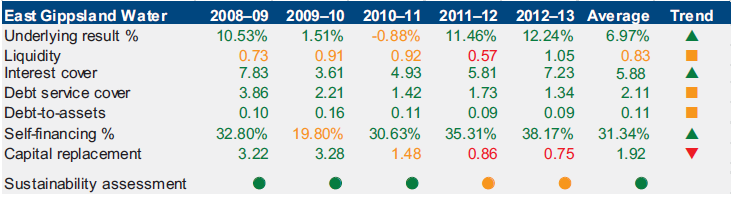
Source: Victorian Auditor-General’s Office.
Figure D13
Gippsland Water
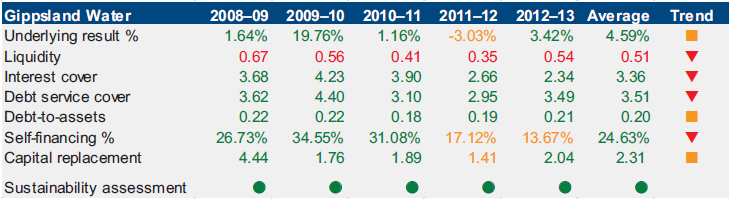
Source: Victorian Auditor-General’s Office.
Figure D14
Goulburn Valley Water
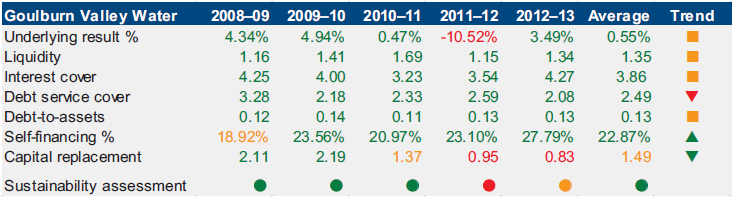
Source: Victorian Auditor-General’s Office.
Figure D15
GWMWater
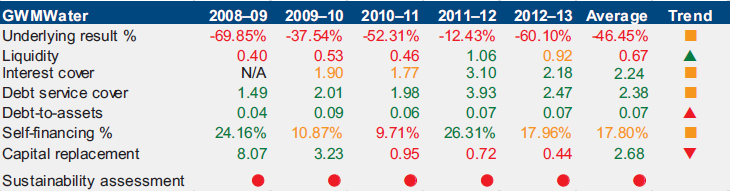
Note: N/A – interest received exceeds interest paid.
Source: Victorian Auditor-General’s Office.
Figure D16
Lower Murray Water
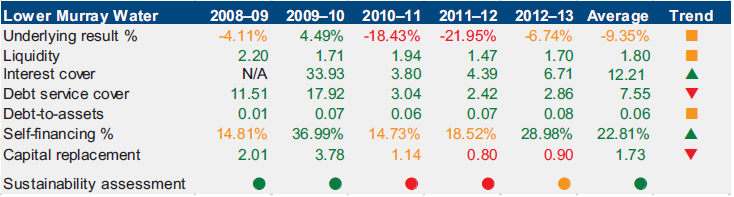
Note: N/A – interest received exceeds interest paid.
Source: Victorian Auditor-General’s Office.
Figure D17
North East Water
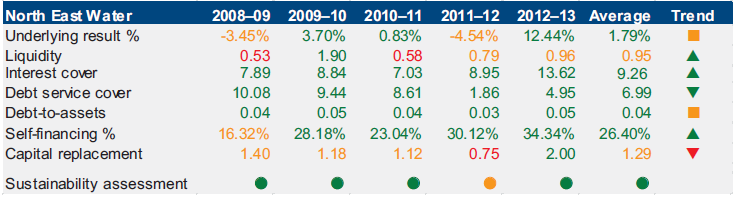
Source: Victorian Auditor-General’s Office.
Figure D18
South Gippsland Water
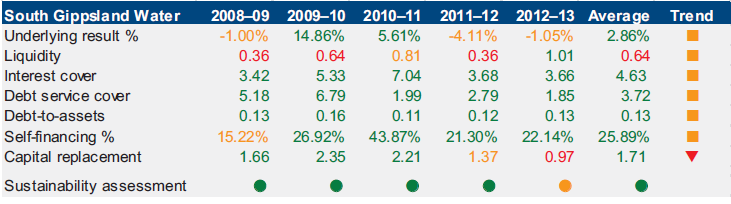
Source: Victorian Auditor-General’s Office.
Figure D19
Wannon Water
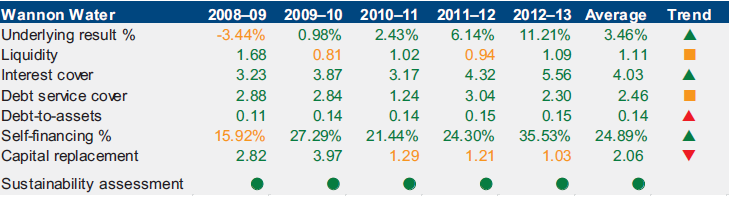
Source: Victorian Auditor-General’s Office.
Figure D20
Western Water
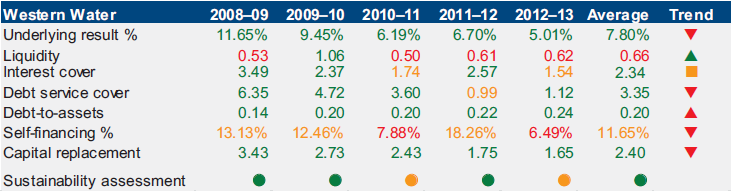
Source: Victorian Auditor-General’s Office.
Figure D21
Westernport Water
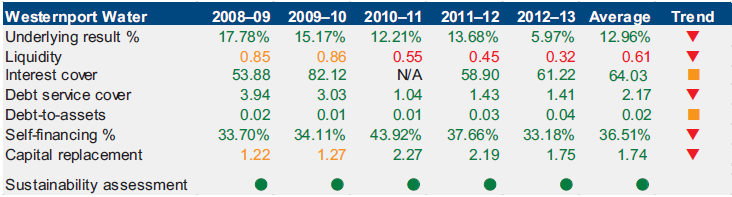
Note: N/A – interest received exceeds interest paid.
Source: Victorian Auditor-General’s Office.
Figure D22
Regional Urban Average
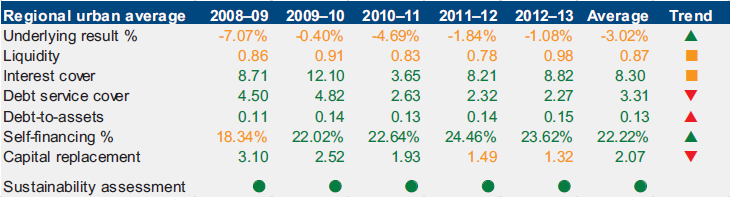
Source: Victorian Auditor-General’s Office.
Rural
Figure D23
Goulburn-Murray Water
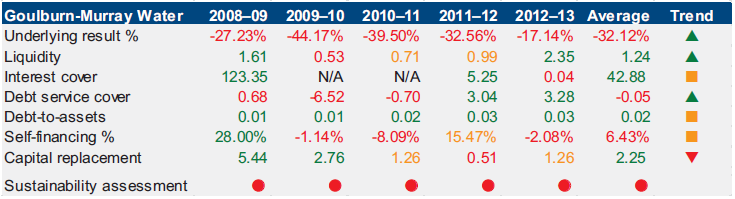
Source: Victorian Auditor-General’s Office.
Figure D24
Southern Rural Water
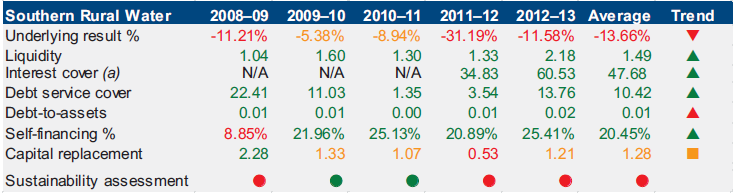
Note N/A – interest received exceeds interest paid.
Source: Victorian Auditor-General’s Office.
Figure D25
Rural Average
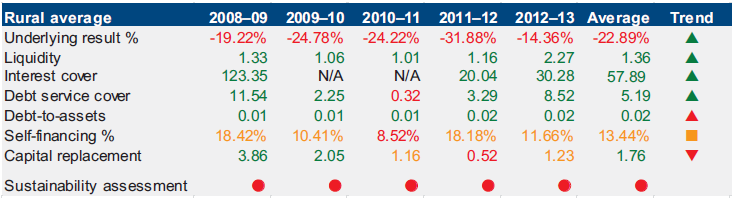
Source: Victorian Auditor-General’s Office.
Appendix E. Acronyms and glossary
Acronyms
DEPI Department of Environment and Primary Industries
DTF Department of Treasury and Finance
ESC Essential Services Commission
FMA Financial Management Act 1994
Glossary
Accountability
Responsibility of public sector entities to achieve their objectives, with regard to reliability of financial reporting, effectiveness and efficiency of operations, compliance with applicable laws, and reporting to interested parties.
Amortisation
The systematic allocation of the depreciable amount of an intangible asset over its expected useful life.
Asset
A resource controlled by an entity as a result of past events, and from which future economic benefits are expected to flow to the entity.
Audit Act 1994
The Audit Act 1994 establishes the operating powers and responsibilities of the Auditor-General. This includes the operations of his office, VAGO, as well as the nature and scope of audits conducted by VAGO.
Auditor's opinion
Written expression within a specified framework indicating the auditor's overall conclusion on the financial (and performance) reports based on audit evidence obtained.
Capital expenditure
Amount capitalised to the balance sheet for contributions by a public sector entity to major assets owned by the entity, including expenditure on:
- capital renewal of existing assets that returns the service potential or the life of the asset
- new assets, including buildings, infrastructure, plant and equipment.
Clear audit opinion – financial report
A positive written expression provided when the financial report has been prepared and presents fairly the transactions and balances for the reporting period in accordance with the requirements of the relevant legislation and Australian accounting standards.
Also referred to as an unqualified audit opinion.
Clear audit opinion – performance report
A positive written expression provided when the performance report has been prepared and presents fairly the performance indicators and results of performance for the reporting period in accordance with the requirements of the relevant legislation.
Also referred to as an unqualified audit opinion.
Corporations Act 2001
The Corporations Act 2001 is an act of the Commonwealth of Australia that sets out the laws dealing with business entities in Australia at federal and state levels. It focuses primarily on companies, although it also covers some laws relating to other entities such as partnerships and managed investment schemes.
Depreciation
The systematic allocation of the value of an asset over its expected useful life.
Entity
Is a body whether corporate or unincorporated that has a public function to exercise on behalf of the state or is wholly owned by the state, including: departments, statutory authorities, statutory corporations and government business enterprises.
Equity or net assets
Residual interest in the assets of an entity after deduction of its liabilities.
Expense
Outflows or other depletions of economic benefits in the form of incurrence of liabilities or depletion of assets of the entity.
Fair value
The amount for which a financial or non-financial asset could be exchanged between knowledgeable and willing parties in an arm's-length transaction.
Financial accommodation levy
Applied to government-owned entities declared to be leviable authorities under the Financial Management Act 1994.
The purpose of the levy is to remove the market advantage government entities may experience in borrowing, as a result of their sovereign status, thereby ensuring that borrowings are valued appropriately in financing decisions for capital projects.
The levy can be payable where borrowings are greater than $5 million.
Financial Management Act 1994
The Act of the State of Victoria that establishes the financial administration and accountability of the public sector, as well as annual reporting to the Parliament by all departments and public sector bodies.
Financial delegation
A schedule that specifies the level or approval required for each transaction category to facilitate the execution of functions necessary for the efficient operation of the entity.
Financial report
Structured representation of financial information, which usually includes accompanying notes, derived from accounting records and intended to communicate an entity's economic resources or obligations at a point in time or the changes therein for a period in accordance with a financial reporting framework.
Financial reporting direction
Financial reports are prepared in accordance with Australian Accounting Standards and Interpretations as issued by the Australian Accounting Standards Board (AASB). When an AASB standard provides accounting treatment options, the Minister for Finance issues financial reporting directions to ensure consistent application of accounting treatment across the Victorian public sector in compliance with that particular standard.
Financial sustainability
An entity's ability to manage financial resources so it can meet spending commitments, both at present and into the future.
Financial year
The period of 12 months for which a financial report (and performance report) is prepared.
Independent auditor's report
An expression of the independent auditor's opinion on an entity's financial (and performance) report.
Internal audit
A function of an entity's governance framework that examines and reports to management on the effectiveness of risk management, control and governance processes.
Internal control
Internal control is a means by which an entity's resources are directed, monitored and measured. It plays an important role in preventing and detecting error and fraud and protecting the entity's resources.
Liability
A present obligation of the entity arising from past events, the settlement of which is expected to result in an outflow from the entity of resources embodying economic benefits.
Materiality
Information is material if its omission or misstatement could influence the economic decisions of users taken on the basis of the financial report. Materiality depends on the size or nature of the item or error judged in the particular circumstances of its omission or misstatement.
Net result
The net result is calculated by subtracting an entity's total expenses from the total revenue, to show what the entity has earned or lost in a given period of time.
Performance report
A statement containing predetermined performance indicators and targets and actual results achieved against these for that financial year, with an explanation for any significant variance between the results and targets.
Relevant
Measures or indicators used by an entity are relevant if they have a logical and consistent relationship to an entity's objectives and are linked to the outcomes to be achieved.
Revaluation
Recognising a reassessment of values for non-current assets at a particular point in time.
Revenue
Inflows of funds or other enhancements or savings in outflows of service potential, or future economic benefits in the form of increases in assets or reductions in liabilities of the entity, other than those relating to contributions by owners which result in an increase in equity during the reporting period.
Unqualified audit opinion – financial report
Refer to clear audit opinion – financial report.
Unqualified audit opinion – performance report
Refer to clear audit opinion – performance report.
Appendix F. Audit Act 1994 section 16–submissions and comments
Introduction
In accordance with section 16(3) of the Audit Act 1994 a copy of this report, or relevant extracts from the report, was provided to the Department of Environment and Primary Industries, the Department of Treasury and Finance, the Treasury Corporation of Victoria, the Essential Services Commission and the 20 entities with a request for submissions or comments.
The submissions and comments provided are not subject to audit nor the evidentiary standards required to reach an audit conclusion. Responsibility for the accuracy, fairness and balance of those comments rests solely with the agency head.
Responses were received as follows:
- Department of Environment and Primary Industries
- Department of Treasury and Finance
- Essential Services Commission
- Goulburn-Murray Water
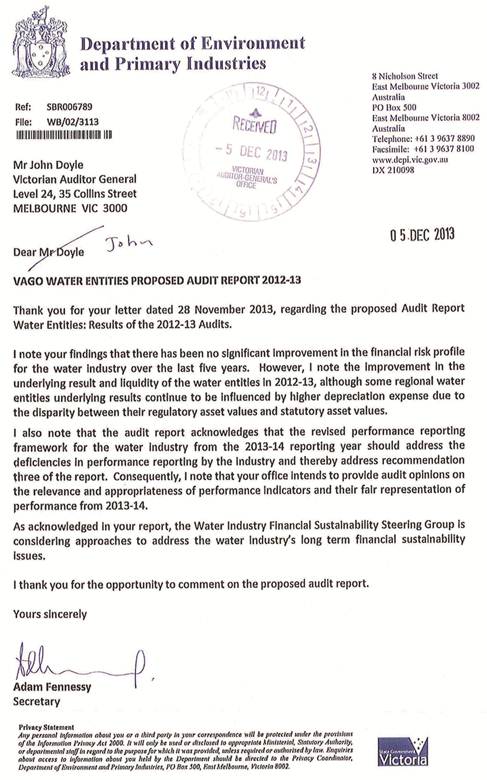
RESPONSE provided by the Acting Secretary, Department of Treasury and Finance
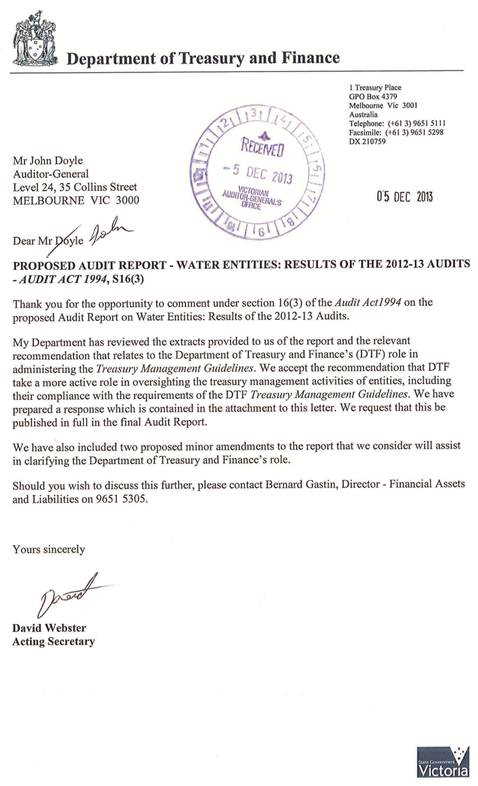
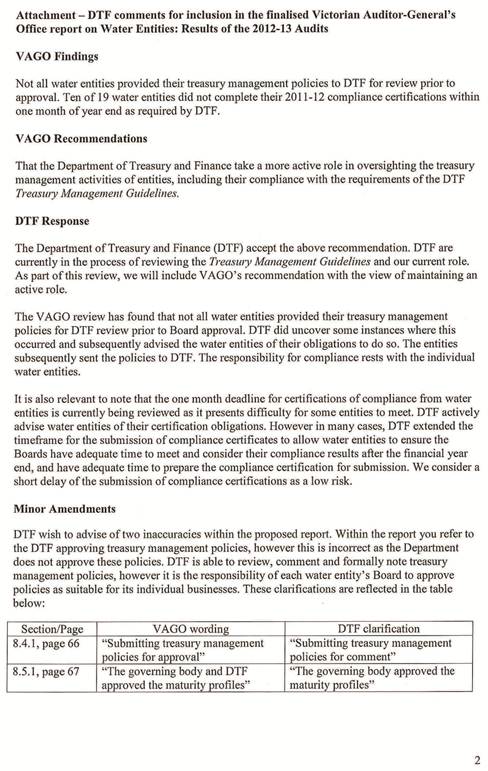
RESPONSE provided by the Chief Executive Officer, Essential Services Commission
RESPONSE provided by the Managing Director, Goulburn-Murray Water