Local Government: Results of the 2012–13 Audits
Overview
This report presents the results of our financial audits of 102 entities within the Local Government sector comprising 79 councils, 11 regional library corporations and 12 associated entities. It provides a detailed analysis of council financial reporting, performance reporting, financial results, financial sustainability of councils, internal controls over the preparation of financial and performance statements, audit committee arrangements and controls over rate revenue. It informs Parliament about significant issues arising from the audits and complements the assurance provided through individual audit opinions included in the entities' annual reports.
Local Government: Results of the 2012–13 Audits: Message
Ordered to be printed
VICTORIAN GOVERNMENT PRINTER December 2013
PP No 288, Session 2010–13
President
Legislative Council
Parliament House
Melbourne
Speaker
Legislative Assembly
Parliament House
Melbourne
Dear Presiding Officers
Under the provisions of section 16AB of the Audit Act 1994, I transmit my report on Local Government: Results of the 2012–13 Audits.
The report summarises the results of the financial audits of 79 local councils, 11 regional library corporations and 12 associated entities at 30 June 2013.
It informs Parliament about significant issues identified during our audits and complements the assurance provided through individual audit opinions included in the entities' annual reports.
The report addresses financial reporting and sustainability, and controls associated with the preparation of financial and performance statements, audit committees and rate revenue.
It also provides an update of progress made by Local Government Victoria in conjunction with local councils in developing a performance reporting framework for the sector. The progress to date is on track to enable us to commence forming audit opinions on the relevance and appropriateness of performance statements in 2014–15.
Yours faithfully

John Doyle
Auditor-General
11 December 2013
Audit summary
The Victorian local government sector comprises 79 councils, 11 regional library corporations (RLCs) and 12 associated entities. Local government is recognised in Victoria's constitution as the third tier of government. Local councils are governed by democratically elected councillors and their operations are administered by the council-appointed chief executive officer. While administered under the Local Government Act 1989, each council operates autonomously and is directly accountable to its constituents.
This report provides a detailed analysis of councils':
- financial reporting
- performance reporting
- financial results
- financial sustainability
- internal controls over the preparation of financial and performance statements
- audit committee arrangements
- rate revenue.
It informs Parliament about significant issues during our audits and complements the assurance provided through individual audit opinions included in the entities' annual reports.
Conclusion
Parliament can have confidence in the 2012–13 financial and standard statements of local councils, RLCs and associated entities. Clear audit opinions on the financial and standard statements were issued for each of the 102 audits completed, meaning that the 2012–13 financial reports of the audited entities were reliable, and fairly presented the results of the entities' operations for the year and their assets and liabilities as at 30 June 2013.
Clear audit opinions were also issued on 78 of the 79, 2012–13 performance statements, meaning that the 78 were fairly presented. A qualified audit opinion was issued on the performance statement of Wangaratta Rural City Council as some key performance indicators and targets were not included in its 2012–13 budget as required for reporting.
Financial reporting quality
Material errors identified during the financial report preparation and audit need to be corrected before a clear audit opinion can be issued. Other errors should also be corrected. While some errors may appear immaterial in isolation, in aggregate a series of small errors may have a significant impact on the statements or an entity's operating result.
Our expectation is that all entities will adjust errors identified during an audit, other than those errors that are clearly trivial as defined under the auditing guidelines. This expectation is consistent with our principle that the public is entitled to expect financial statements that bear the Auditor-General's opinion to be accurate and of the highest quality possible.
Financial reporting quality improved in 2012–13 with a decrease in the number of material adjustments and adjustments to disclosures required by audit from the levels seen in 2011–12.
Performance reporting by councils
The Audit Act 1994 empowers the Auditor-General to audit any performance indicators in the report of operations of an audited entity to determine whether they:
- are relevant to any stated objectives of the entity
- are appropriate for the assessment of the entity's actual performance
- fairly represent the entity's actual performance.
We have limited our opinions on performance statements of local councils to date, to addressing fair presentation and compliance with local government requirements. However, in response to our 2011 performance audit report Performance Reporting by Local Government (2011–12:27), Local Government Victoria (LGV) commenced a two-year project in 2011–12 to develop and implement a performance reporting regime for the sector which included a focus on relevant and appropriate performance indicators. LGV and local councils are making good progress in developing the performance reporting framework, which should enable us to commence forming audit opinions on the relevance and appropriateness of performance statements in 2014–15.
Financial sustainability of councils
The sector as a whole has maintained its financial sustainability year on year. Analysis of the six indicators shows that councils as a whole had a low financial sustainability risk assessment. The overall results for 2012–13 were affected by early repayment of defined benefit superannuation funding obligations and the timing of infrastructure works associated with natural disaster government funding. Councils continue to face the ongoing challenge of maintaining spending on capital works and existing assets at sufficient levels.
The number of councils with a financial sustainability risk assessment of high increased from one in 2011–12 to two in 2012–13. The number of councils assessed as having a medium sustainability risk increased from five in 2011–12 to 11 in 2012–13.
Recommendations
That councils, regional library corporations and associated entities should:
- refine their financial reporting processes by strengthening the review and assurance procedures over the accuracy of data needed for financial statement preparation
- adjust all errors identified during audits to ensure their financial statements are of the highest possible quality.
That councils should:
- continue to engage with Local Government Victoria at all stages in the development of the Local Government Performance Reporting Framework
- require audit committees to periodically self-assess their performance against their charters
- appoint an independent member as chair and require membership of the audit committee to include a majority of independent members
- maintain a conflict of interests register for audit committee members
- improve their rating strategies by incorporating elements of better practice identified in this report—including links to council plans, the rationale for rate changes, rating options adopted, and the assumptions and factors considered in rate setting
- use internal audit to assess the robustness of their rating systems and compliance with legislative requirements.
Submissions and comments received
In addition to progressive engagement during the course of the audit, in accordance with section 16(3) of the Audit Act 1994 a copy of this report, or relevant extracts from the report were provided to all councils and the Department of Transport, Planning and Local Infrastructure with a request for submissions or comments.
Agency views have been considered in reaching our audit conclusions and are represented to the extent relevant and warranted in preparing this report. Their full section 16(3) submissions and comments however, are included in Appendix G.
1 Background
1.1 Introduction
Local government is recognised in Victoria's constitution as the third tier of government. Local councils are governed by democratically elected councillors and their operations are administered by the council-appointed chief executive officer. While administered under the Local Government Act 1989, each council operates autonomously and is directly accountable to its constituents.
This report is one of a suite of reports on the results of the 2012–13 financial audits conducted by the Victorian Auditor-General's Office (VAGO). The full list of reports can be found in Appendix A.
The Victorian local government sector consists of 102 entities, comprising 79 local councils, 11 regional library corporations and 12 associated entities.
The number of local government entities subject to audit by VAGO in 2012–13 decreased by one. During 2012–13 Melbourne Wholesale Fish Market Pty Ltd ceased trading and changes to the ownership arrangements of Yarra Energy Foundation Limited meant that the entity is no longer subject to audit by VAGO. The Dandenong Market Pty Ltd—a subsidiary of Greater Dandenong City Council—was established during the year and is audited by VAGO.
The local government entities audited by VAGO are listed in Appendix B.
This report informs Parliament about significant issues arising from the financial audits and adds to the assurance provided through audit opinions on financial, standard and performance statements included in the respective entities' annual reports. It comments on the financial sustainability of the entities, their general internal controls, audit committee arrangements and controls over rate revenue.
1.2 Audit of financial and standard statements
An annual financial and standard statements audit has two aims:
- to give an opinion consistent with section 9 of the Audit Act 1994, on whether the financial statements and standard statements are fairly stated, prepared in accordance with Australian Accounting Standards and/or the Local Government Act 1989
- to consider whether there has been waste of public resources or a lack of probity or financial prudence in the management or application of public resources, consistent with section 3A (2) of the Audit Act 1994.
The financial audit framework used is set out in Appendix C.
1.2.1 Audit of internal controls relevant to the preparation of the financial and standard statements
An assessment of the adequacy of the internal control framework and the governance processes related to an entity's financial reporting is integral to the annual financial audit. In making this assessment, consideration is given to the internal controls relevant to the entity's preparation and fair presentation of the financial and standard statements in order to design audit procedures that are appropriate in the circumstances, but not for the purpose of expressing an opinion on the effectiveness of the entity's internal control.
Internal controls are systems, policies and procedures that help an entity to reliably and cost-effectively meet its objectives. Sound internal controls enable the delivery of reliable, accurate and timely internal and external reporting.
An explanation of the internal control framework, and its main components, is set out in Appendix C. An entity's governing body is responsible for developing and maintaining its internal control framework. Internal control weaknesses we identify during an audit do not usually result in a 'qualified' audit opinion because often an entity will have compensating controls that mitigate the risk of a material error in the financial and standard statements. A qualification is warranted only if weaknesses cause significant uncertainty about the accuracy, completeness and reliability of the financial information being reported.
Weaknesses in internal control found during the audit of an entity are reported to its mayor or administrator, chief executive officer and audit committee in a management letter.
Our reports to Parliament raise systemic or common weaknesses identified during our assessments of internal controls over financial reporting, across a sector.
1.3 Audit of performance statements
Section 132 of the Local Government Act 1989 requires councils to prepare performance statements annually, and section 133 requires the auditor to prepare a report to the Minister for Local Government.
1.4 Audit conduct
The audits of the 102 local government entities were undertaken in accordance with Australian Auditing Standards. Pursuant to section 20(3) of the Audit Act 1994, unless otherwise indicated, any persons named in this report are not the subject of adverse comment or opinion.
The cost of preparing and printing this report was $205 000.
1.5 Structure of this report
The structure of this report is set out in Figure 1A.
Figure 1A
Report structure
Part |
Description |
|---|---|
Part 2: Financial reporting by entities |
This Part covers the results of the 2012–13 audits of the:
It also comments on the quality of financial reporting and timeliness against legislated time lines. |
Part 3: Performance reporting by councils |
This Part covers the results of the audits of the performance statements of 79 councils for 2012–13. It also details the progress made by Local Government Victoria in developing the Local Government Performance Reporting Framework. |
Part 4: Financial results of councils and regional library corporations |
This Part summarises and analyses the financial results of the 79 councils and 11 regional library corporations for 2012–13. |
Part 5: Financial sustainability of councils |
This Part provides insight into the financial sustainability of the 79 councils based on the trends in six financial sustainability indicators over a five-year period. |
Part 6: Internal controls of councils |
This Part comments on the internal controls associated with the preparation of financial statements, audit committees and controls over rate revenue. |
Source: Victorian Auditor-General's Office.
2 Financial reporting by entities
At a glance
Background
Independent audit opinions add credibility to financial and standard statements by providing assurance that the information reported is reliable. This Part covers the results of the 2012–13 financial statement audits of the 79 councils, 11 regional library corporations and 12 associated entities.
Conclusion
Clear audit opinions were issued for each of the 102 audits completed, meaning that the 2012–13 financial reports of the audited entities were reliable, and fairly presented the results of the entities' operations and their assets and liabilities as at 30 June 2013.
Findings
- Three entities did not meet the legislated reporting time frame of 30 September 2013. Each was granted a reporting extension and audit opinions were issued as follows:
- Frankston City Council on 11 October 2013
- West Wimmera Shire Council on 22 October 2013
- Moira Shire Council on 23 October 2013.
- The financial statement of Buloke Shire Council was prepared on a going concern basis, however, conditions existed at 30 June 2013 that cast significant doubt on its ability to continue as a going concern.
- Eighty-five clear acquittal opinions were issued providing assurance to funding bodies that councils had spent grant monies according to grant conditions, and that grant expenditure was incurred in accordance with grant agreements.
Recommendation
That councils, regional library corporations and associated entities:
- refine their financial reporting processes by strengthening the review and assurance procedures over the accuracy of data needed for financial statement preparation
- adjust all errors identified during audits to ensure their financial statements are of the highest possible quality.
2.1 Introduction
This Part covers the results of the 2012–13 audits of 79 local councils, 11 regional library corporations (RLCs) and 12 associated entities, and our observations regarding the quality of agency financial reporting.
2.2 Conclusion
Financial and standard statements prepared by local councils, RLCs and associated entities for 2012–13 were of a good standard. To date, clear audit opinions have been issued for 102 financial statements and 90 standard statements. Three of the audit opinions were issued after the statutory reporting time frame of 30 September 2013.
2.3 Financial reporting framework
The principal legislation governing the financial reporting of councils, RLCs and their associated entities is the Local Government Act 1989 (the Act). Under the Act, they must prepare annual general purpose and standard financial statements, as set out in Figure 2A.
Figure 2A
Local government sector financial reporting requirements
Statement |
Details |
Councils |
RLCs |
Other |
|---|---|---|---|---|
General purpose |
General purpose financial statements prepared in accordance with Australian Accounting Standards, and comprising:
|
✔ |
✔ |
✔ |
Special purpose—also referred to as standard statements |
Statements comprising:
|
✔ |
✔ |
n.a. |
Note: n.a = not applicable.
Source: Victorian
Auditor-General's Office.
Councils are also required to prepare performance statements and have them audited. The results of our audits of performance statements are presented in Part 3 of this report.
Councils and RLCs must submit their annual reports to the Minister for Local Government by 30 September each year unless granted an extension.
2.4 Audit opinions issued
Independent audit opinions add credibility to financial reports by providing assurance that the information in the reports is reliable and presents the entity's results fairly.
A clear audit opinion on the financial statements confirms that the financial statements have been prepared according to applicable accounting standards and the financial reporting requirements of the Act.
A clear audit opinion on the standard statements confirms that the standard statements have been prepared in accordance with the requirements of the Act.
A qualified audit opinion means that the financial statement is materially different to the requirements of the relevant reporting framework or accounting standards, and is less reliable and useful as an accountability document.
In certain circumstances an audit opinion may draw attention to, or emphasise, a matter that is relevant to the users of an entity's financial statement but does not warrant a qualification. Unmodified opinions can include an 'emphasis of matter' (EoM) paragraph.
2.4.1 General purpose financial statements
For 2012–13, 102 clear audit opinions were issued on the general purpose statements of councils, RLCs and associated entities (103 clear in 2011–12).
An auditor can draw a reader's attention to a matter or disclosure in the financial report to provide important context. Financial reports that include an EoM paragraph still present the entity's financial information fairly and can be relied upon by users.
In 2012–13 one entity received an audit opinion containing an EoM. Figure 2B provides the details of the entity and the reason for adding an EoM in the audit opinion.
Figure 2B
Emphasis of matter audit opinions issued for 2012–13
Entity |
Status |
Reason |
|---|---|---|
Buloke Shire Council |
Ongoing |
The financial statement was prepared on a going concern basis, however, conditions existed at 30 June 2013 that cast significant doubt on the council's ability to continue as a going concern. |
Source: Victorian Auditor-General's Office.
2.4.2 Standard statements
Councils and RLCs are required to prepare standard statements under section 131 of the Act. These statements are 'special purpose financial reports', which report actual expenditure against budget for the financial year. Consistent with auditing standards, our audit opinions on special purpose financial reports include an EoM drawing the users' attention to the fact that they are prepared to meet the requirements of the Act and may not be suitable for another purpose.
For 2012–13, 90 clear audit opinions with an EoM were issued on all the standard financial statements of councils and RLCs (90 clear in 2011–12).
2.4.3 Grant acquittals
At times, councils are required to report on the use of specific grants provided to them. For example, conditions of grants provided by the Commonwealth Government may require the council to report back on, or acquit, the use of that funding. An acquittal report generally consists of an income and expenditure statement based on a prescribed template provided by the funding body.
Audits of grants are usually a funding condition and may be a prerequisite for continued funding. A grant acquittal audit provides assurance to the funding body that grant conditions have been met, and that grant expenditure was incurred in accordance with the grant agreement, including any special conditions and payment requirements. Grant acquittal audits are conducted in accordance with the Australian Auditing Standards and the requirements of the relevant grant agreement or grant conditions.
In 2012–13 we issued 85 acquittals (69 in 2011–12), most of which related to the Nation Building Program managed by the Commonwealth Government's Department of Infrastructure and Regional Development. The details of acquittals issued during the year are provided in Appendix D.
2.5 Quality of financial reporting
The quality of an entity's financial reporting can be measured by the accuracy and timeliness of the preparation and finalisation of its financial and standard statements.
2.5.1 Accuracy
The frequency and size of errors in financial statements are direct measures of the quality of the financial reports submitted to audit. Ideally, there should be no errors or adjustments required as a result of an audit. When we detect errors in the financial statements they are raised with management.
Material errors identified during the financial report preparation and audit need to be corrected before a clear audit opinion can be issued. Other errors should also be corrected. While some errors may appear immaterial in isolation, in aggregate, a series of small errors may have a significant impact on the statements or an entity's operating result.
Our expectation is that all entities will adjust errors identified during an audit, other than those errors that are clearly trivial as defined under the auditing guidelines. This expectation is consistent with our principle that the public is entitled to expect that financial statements that bear the Auditor-General's opinion are as accurate and of the highest quality possible.
Material adjustments
The number of material adjustments decreased from 61 in 2011–12 to 39 in 2012–13. Large and small shire councils accounted for 77 per cent of the material adjustments.
The number of adjustments to disclosures reduced from 22 last year to 13 in 2012–13. Regional and large shire councils accounted for 69 per cent of these adjustments (77 per cent in 2011–12).
Adjustments were required to correct errors due to:
- incorrect valuations of infrastructure assets based on poor quality data
- inadequate quality assurance over the reasonableness of asset revaluation data.
Adjustment of other misstatements
While some errors may appear immaterial in isolation, in aggregate, a series of small errors may have a significant impact on the statements or an entity's operating result. It is important therefore that these errors be corrected before the audit opinion is signed.
2.5.2 Timeliness
Timely financial reporting is key to accountability to stakeholders and enables them to make well-timed and informed decisions. The later a financial report is produced and published after year end, the less useful it is.
Councils, RLCs and related entities are required to finalise their audited financial statements and submit them to the Minister for Local Government by 30 September each year. In 2012–13, 76 councils (96 per cent) met the time frame compared with 98 per cent in 2011–12. Three councils were granted extensions by the minister, as shown in Figure 2C.
Figure 2C
Entities that missed the statutory reporting time line, 2012–13
Entity |
Details |
|---|---|
Frankston City Council |
An extension to 30 November 2013 granted. The financial report signed 7 October 2013. Audit opinion issued 11 October 2013. |
West Wimmera Shire Council |
An extension until 30 November 2013 granted. The financial report signed 17 October 2013. Audit opinion issued 22 October 2013. |
Moira Shire Council |
An extension until 30 November 2013 granted. The financial report signed 21 October 2013. Audit opinion issued 23 October 2013. |
Source: Victorian Auditor-General's Office.
All RLCs and associated entities met the reporting time frame in 2012–13 (100 per cent in 2011–12).
Recommendations
That councils, regional library corporations and associated entities should:
- refine their financial reporting processes by strengthening the review and assurance procedures over the accuracy of data needed for financial statement preparation
- adjust all errors identified during audits to ensure their financial statements are of the highest possible quality.
3 Performance reporting by councils
At a glance
Background
All councils are required to report their actual performance against measures and targets associated with the key strategic activities set out in their four-year plans. This Part covers the results of the 2012–13 audits of council performance statements. It also details the progress made by Local Government Victoria and the sector in developing the Local Government Performance Reporting Framework.
Conclusion
Parliament can have confidence in the fair presentation of 78 performance statements that received clear audit opinions for 2012–13.
Wangaratta Rural City Council received a qualified audit opinion on its performance statement as some key performance indicators and targets were not included in its 2012–13 budget, as required for reporting.
Local Government Victoria, in conjunction with local councils, is making good progress in developing a performance reporting framework for the sector. The initiative, which includes developing a common suite of performance indicators, should enable us to commence forming audit opinions on the relevance and appropriateness of performance statements in 2014–15, consistent with our intent announced in Local Government: Results of the 2010–11 Audits (2011–12:14).
Recommendation
Councils should continue to engage with Local Government Victoria at all stages in the development of the Local Government Performance Reporting Framework.
3.1 Introduction
This Part covers the results of the audits of the 2012–13 performance statements of local councils and provides an update on Local Government Victoria (LGV) and local councils' progress in developing the Local Government Performance Reporting Framework (LGPRF).
3.2 Conclusion
Performance statements continue to be audited on a fair presentation basis, with 78 councils receiving a clear audit opinion and one qualified opinion for 2012–13.
LGV has continued to develop the LGPRF which will enable us to commence forming an audit opinion on the relevance and appropriateness of the performance statements from 2014–15.
3.3 Performance reporting framework
Section 132 of the Local Government Act 1989 requires councils to prepare performance statements annually, and section 133 requires these statements to be audited. Councils are required to report their performance against the measures and targets related to the key strategic activities established in their four-year plans.
3.4 Audit opinions issued
By the statutory reporting date of 30 September 2013, 75 clear audit opinions and one qualified audit opinion were issued on council performance statements for 2012–13 (77 clear in 2011–12).
Figure 3A provides the detail of the qualified audit opinion issued.
Figure 3A
Qualified audit opinions issued for 2012–13
|
Entity |
Status |
Reason |
|---|---|---|
|
Wangaratta Rural City Council |
New |
Some key performance indicators and targets were not included in the council's 2012–13 budget required for the performance statement for 30 June 2013, as required by the Local Government Act 1989. |
Source: Victorian Auditor-General's Office.
Clear audit opinions were issued after the statutory deadline to Frankston City Council on 11 October 2013, West Wimmera Shire Council on 22 October 2013 and Moira Shire Council on 23 October 2013. The three councils were granted reporting extensions to 30 November 2013 by the Minister for Local Government.
3.5 Developing the sector's performance reporting framework
The Audit Act 1994 empowers the Auditor-General to audit any performance indicators in the report of operations of an audited entity to determine whether they:
- are relevant to any stated objectives of the entity
- are appropriate for the assessment of the entity's actual performance
- fairly represent the entity's actual performance.
However, to date, in accordance with section 132 of the Local Government Act 1989, we have restricted our audit opinion to commenting on fair presentation. In response to our 2011 performance audit report Performance Reporting by Local Government (2011–12:27), in 2011–12 LGV commenced a two-year project to develop and implement a performance reporting regime for the sector. The LGPRF is expected to be in place by June 2015 to align with our expressed intention to issue opinions covering the Auditor-General's full mandate from—and including—2014–15.
3.5.1 Progress in 2012–13
The development and implementation of the LGPRF is being carried out in five stages:
- Stage 1—indicator development (October 2012 to June 2013)
- Stage 2—pilot program (July 2013 to June 2014)
- Stage 3—enabling legislation (July 2013 to June 2014)
- Stage 4—data collection (July 2014 to June 2015)
- Stage 5—reporting (July 2015 to September 2015).
The LGPRF under development comprises a range of output and outcome indicators to be reported within an LGV-collated report for the sector. This is consistent with the recommendation from our report, Performance Reporting by Local Government (2011–12:27). It is expected that a subset of the established indicators will be incorporated into the performance statements to be audited by VAGO.
The project is proceeding to the established time frame:
- Stage 1 delivered a Directions Paper in December 2012 providing an overview of the key features of the proposed framework, and outlined the process for its implementation
- Stage 2 which is aimed at refining and validating the proposed framework and indicators through piloting with 43 volunteer councils is currently underway. Community input will also be sought on the format of reporting as part of the pilot.
Progress is also underway on Stage 3 with work proceeding to draft the enabling legislation and regulatory impact statements for consideration in 2013–14.
3.5.2 Observations from 2012–13 audits of local councils
When we announced our intention to expand our audit opinions, we signalled to councils that we would report our opinion on relevance and appropriateness of performance indicators to councils via management letters, while continuing to express a public opinion on their fair presentation. Consequently in 2012–13, in addition to auditing and issuing our opinion on the fair presentation of performance statements, we provided feedback to 40 selected councils through our management letters on their readiness to report on relevant and appropriate indicators.
This feedback was also designed to enable councils to better engage with, and provide constructive feedback to, LGV on the framework and indicators being developed.
Relevance and appropriateness of performance indicators
While some councils presented performance indicators that were both output and outcome-based, the majority have some way to go to deliver performance statements that include relevant and appropriate indicators. For example, 90 per cent of selected councils did not clearly align the strategic indicators in their performance statements with the key strategic activities outlined in their council plans.
Without a clear nexus between the strategic indicators and key strategic activities, the effectiveness of a council's performance can only be inferred, not definitively determined.
Performance reporting policies
Consistent with our report Performance Reporting by Local Government (2007–08:27), we found that 68 per cent of the selected councils did not have formalised and defined performance reporting policies.
Policies that articulate the context within which a council operates can assist the development of appropriate targets and priority setting. For example, councils that have a strong environmental sustainability aim may choose to set higher targets for recycling or maintaining green areas, or councils in growth areas may choose to set higher targets for establishing local infrastructure.
The absence of policies may impact a council's ability to fairly and accurately reflect its achievements against strategic objectives within their performance statements, and to set appropriate targets.
Recommendation
- Councils should continue to engage with Local Government Victoria at all stages in the development of the Local Government Performance Reporting Framework.
4 Financial results of councils and regional library corporations
At a glance
Background
This Part covers the financial results of the 79 local councils and 11 regional library corporations for 2012–13.
Conclusion
The overall operating result for councils has improved in 2012–13. Sustained positive operating results indicate that councils are living within their means allowing them to build capacity, expand services, retire debt and/or facilitate capital works and renewal.
Regional library corporations remain heavily dependent on council support for their ongoing operations. Without continued support regional library corporations will struggle to provide their services.
4.1 Introduction
Accrual-based financial statements enable an assessment of whether entities generate sufficient surpluses from their operations to maintain services, fund asset maintenance and retire debt.
The financial objective for councils and regional library corporations (RLCs) should be to generate sufficient resources from operations to meet their financial obligations, fund asset replacement and acquisitions. The ability of councils and RLCs to do this depends largely on how they manage their expenditure and maximise revenue.
4.2 Financial result—councils
The overall operating result for councils improved 20 per cent from a surplus of $1.03 billion in 2011–12 to a surplus of $1.23 billion in 2012–13.
The ongoing positive result means that councils have greater capacity to expand services, reduce debt and/or facilitate capital works. In 2011–12, 22 councils reported underlying operating deficits because of a call from their defined benefit superannuation fund to address unfunded liabilities. The funding call was not repeated in 2012–13, and as a direct result only eight councils reported an underlying operating deficit for the year.
4.2.1 Operating revenue
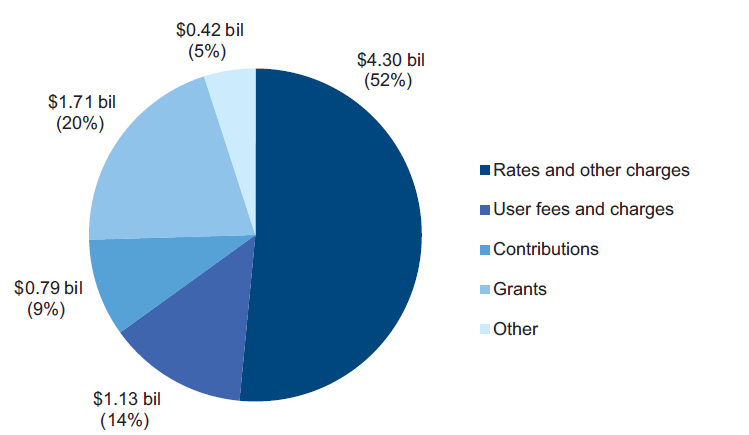
Councils generated operating revenue of $8.35 billion in 2012–13, an increase of 2 per cent on the $8.18 billion collected in 2011–12. This included an increase in rates and user fees and charges of $419 million, offset by a decrease in grants, developer contributions and interest yields of $246 million.
Figure 4A shows the composition of council operating revenue for 2012–13.
Figure 4A
Council revenue composition, 2012–13
Source: Victorian Auditor-General's Office.
4.2.2 Operating expenditure
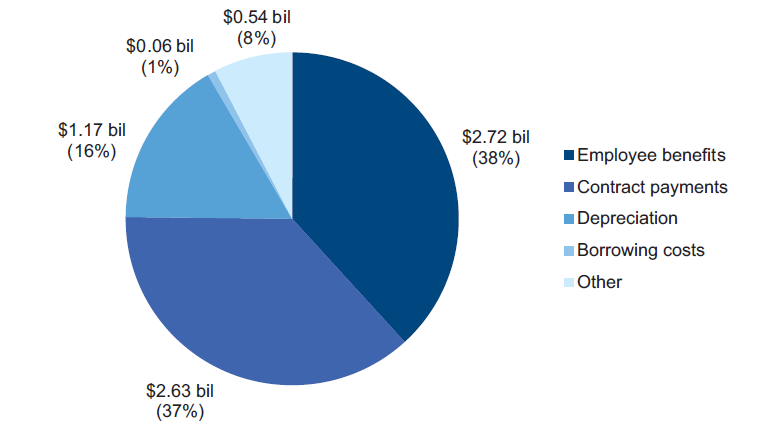
Total operating expenditure of councils was $7.12 billion in 2012–13 ($7.15 billion in 2011–12), a reduction of 0.4 per cent.
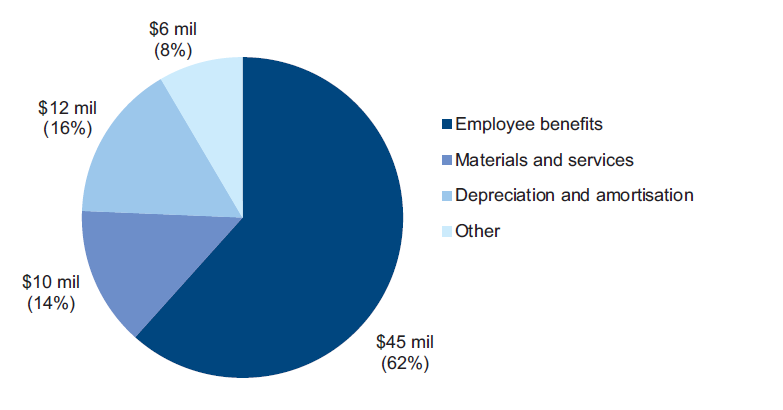
The largest expenditure for councils was employee benefits. This has decreased from $3.01 billion in 2011–12 to $2.72 billion in 2012–13—a 9.6 per cent decrease—due to the defined benefit superannuation funding call not being repeated in 2012–13. All other expenditure components remained at similar values to 2011–12.
Figure 4B shows the composition of operating expenditure for 2012–13.
Figure 4B
Council expenditure composition, 2012–13
Source: Victorian Auditor-General's Office.
4.3 Financial result—regional library corporations
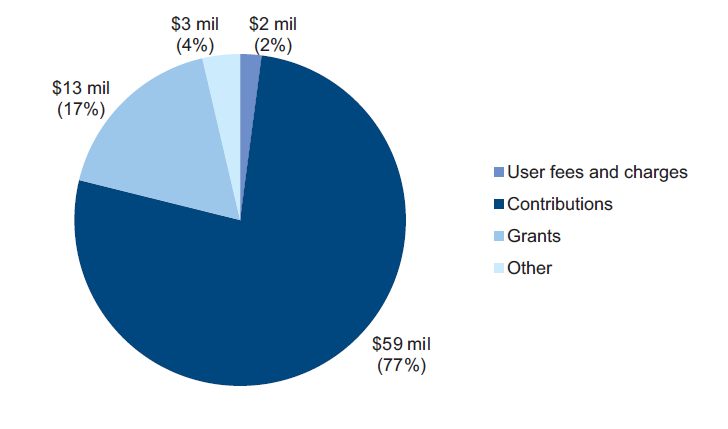
The overall operating result for RLCs improved from a deficit of $3.06 million in 2011–12 to a surplus of $3.11 million in 2012–13. This improvement in the overall operating result was due to an increase of $3 million in grant funding and lower employee benefit expenses due to the defined benefit superannuation funding call not repeating in 2012–13. Council contributions had also decreased from $63 million in 2011–12 to $59 million in 2012–13.
Seventy-seven per cent of RLCs total revenue comes from councils, so they remain heavily dependent upon council support to fund their ongoing operations. Without this level of continuing support RLCs will struggle to provide the services that they were set up to deliver.
4.3.1 Operating revenue
In 2012–13, revenue for RLCs amounted to $77 million ($78 million in 2011–12). Government grants increased from $10 million in 2011–12 to $13 million in 2012–13. Council contributions reduced by $7 million because the additional contributions provided by councils to cover the 2011–12 defined benefit superannuation funding call on RLCs was not needed in 2012–13. While not required in 2012–13, the reliance on local councils to absorb financial risks that materialise is indicative of the ongoing challenges to the sustainability of RLCs.
The reduction in council contributions during 2012–13 was partly offset by an increase of $3 million in government grants.
Figure 4C shows the overall composition of operating revenue for RLCs in 2012–13.
Figure 4C
Regional library corporations—revenue composition, 2012–13
Source: Victorian Auditor-General's Office.
4.3.2 Operating expenditure
In 2012–13, RLCs had expenditure of $73 million ($81 million in 2011–12). Figure 4D shows the composition of expenditure for the year.
Figure 4D
Regional library corporations—expenditure composition, 2012–13
Source: Victorian Auditor-General's Office.
The largest component of expenditure was employee benefits of $45 million which had decreased from $ 55 million in 2011–12. This reduction was due to the defined benefit superannuation funding call not being repeated in 2012–13. All other expenditure components had remained consistent with 2012–13.
5 Financial sustainability of councils
At a glance
Background
To be financially sustainable, entities need to be able to meet current and future expenditure as it falls due and to absorb foreseeable changes and risks without significantly changing their revenue and expenditure policies. This Part provides insight into the financial sustainability of the 79 local councils.
Conclusion
Two councils improved their financial sustainability risk assessments from medium to low risk, however, the assessments for nine other councils deteriorated—a net movement of seven. Of the nine, eight councils had deteriorating self-financing or indebtedness ratios with five affected by their choice to repay the defined benefit superannuation funding call liability early. One council's sustainability assessment changed from low to high as a result of a liquidity ratio of less than one.
Inner metropolitan councils and regional city councils with an established asset base face longer-term pressures in maintaining and renewing existing assets or paying down existing debt while outer metropolitan and large shire councils face an ongoing challenge of maintaining spending on capital works and future renewal works to maintain their assets at serviceable levels. Small shire councils continued reliance on government funding exposes them to higher financial risks in the future.
5.1 Introduction
To be financially sustainable, entities need to meet their current and future expenditure as it falls due. They also need to absorb foreseeable changes and financial risks that materialise, without significantly changing their revenue and expenditure policies.
Financial sustainability should be viewed from both a short-term and long-term perspective. Short-term indicators relate to the ability of an entity to maintain positive operating cash flows, or the ability to generate an operating surplus in the next financial year. Long-term indicators focus on strategic issues such as the ability to fund significant asset replacement or reduce long-term debt.
In this Part, insight is provided into the financial sustainability of councils as at 30 June 2013 using six key financial sustainability indicators, and trends in the indicators over the past five years. This analysis identifies trends that warrant attention or highlight positive results for individual councils and the five council categories—inner metropolitan, outer metropolitan, regional city, large shire and small shire. Appendix E describes the sustainability indicators, the risk assessment criteria used and their significance.
5.2 Financial sustainability risk assessment
5.2.1 Assessment by council category
Figure 5A shows that the number of councils with a high financial sustainability risk increased from one in 2011–12 to two in 2012–13. The number of councils with a medium sustainability risk increased from five in 2011–12 to 11 in 2012–13.
Figure 5A
Two-year financial sustainability risk assessment, by council category
|
2012–13 |
2011–12 |
|||||
|---|---|---|---|---|---|---|
|
Council |
High |
Medium |
Low |
High |
Medium |
Low |
|
Inner metropolitan |
1 |
2 |
14 |
– |
– |
17 |
|
Outer metropolitan |
– |
4 |
10 |
– |
2 |
12 |
|
Regional city |
– |
1 |
10 |
– |
1 |
10 |
|
Large shire |
– |
3 |
13 |
– |
1 |
15 |
|
Small shire |
1 |
1 |
19 |
1 |
1 |
19 |
|
Total |
2 |
11 |
66 |
1 |
5 |
73 |
|
Per cent |
3 |
14 |
83 |
1 |
6 |
93 |
Source: Victorian Auditor-General’s Office.
Overall, indebtedness of the sector improved in 2012–13 due to the early payment by 63 councils of the defined benefit superannuation liabilities, in order to capitalise on discounts offered by the superannuation provider. However, this affected the cash flows of the councils, increasing their self-financing risk.
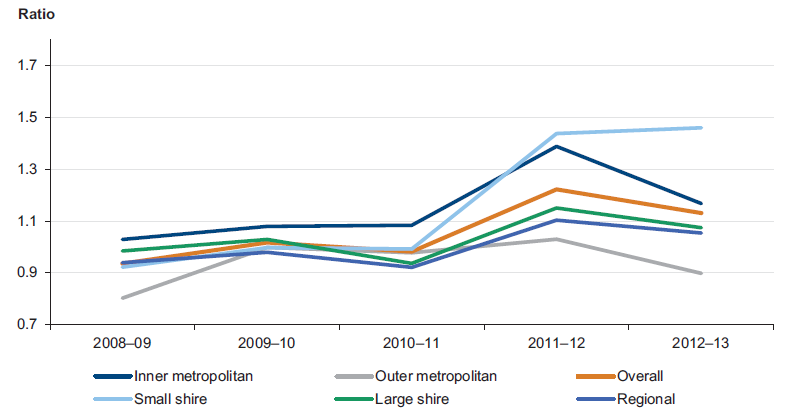
Figure 5B shows that from 2008–09 to 2011–12, the overall financial sustainability risk assessment was relatively consistent. However, in 2012–13, 13 councils were rated as medium or high risk compared with six in 2011–12.
Figure 5B
Five-year financial sustainability risk assessment
Source: Victorian Auditor-General’s Office.
Mansfield Shire Council and Surf Coast Shire Council had improved financial sustainability risk assessments from medium to low risk. However, the sustainability assessments for nine other councils deteriorated. Of the nine, eight councils had deteriorating self-financing or indebtedness ratios with five affected by their choice to repay the defined benefit superannuation funding call liability early. One council's sustainability assessment changed from low to high as a result of a liquidity ratio of less than one.
5.2.2 Assessment of financial sustainability risk by council category
The overall risk assessments for each of the five categories of councils are presented below. Detailed results of our sustainability risk assessments for each category and each council can be found in Appendix E.
Inner metropolitan councils
Financial sustainability risk for the 17 inner metropolitan councils was assessed as low. One council was assessed as high risk and two councils were assessed as medium risk in 2012–13 compared to none in this category in 2011–12.
Yarra City Council's liquidity ratio fell below 1.00 on 30 June 2013 following an increase in current trade creditors associated with the redevelopment of the Collingwood Town Hall compared to the previous year. The council's three-year forecast indicates a liquidity ratio above 1.00 from 2013–14 onwards.
The financial sustainability risk for Darebin City Council and Monash City Council was assessed as medium (low in 2011–12) due to higher self-financing ratios following repayment of their defined benefit superannuation funding call liability in 2012–13. The three-year forecasts for both indicate an improvement in the self-financing ratio.
Inner metropolitan councils have established assets with the challenge being to maintain them at serviceable levels. However, the weakest risk indicator for this cohort was self-financing, which suggests in the longer-term pressures may arise in maintaining and renewing existing assets or paying down existing debt.
Outer metropolitan councils
The financial sustainability risk for the 14 outer metropolitan councils was assessed as low for 2012–13. Four were assessed as medium risk compared with two in 2011–12.
Nillumbik Shire Council and Yarra Ranges Shire Council were assessed as medium risk (low in 2011–12) due to high self-financing ratio risk, again due to repaying their defined benefit superannuation funding call liability in 2012–13. The three-year forecasts for both indicate an improvement in the self-financing ratio.
Outer metropolitan councils service the growth corridors of Melbourne. While their primary focus is more on meeting new infrastructure rather than on maintaining assets at serviceable levels, the asset renewal gap is a challenge for them.
Regional city councils
The financial sustainability risk for the 11 regional city councils was assessed as low for 2012–13. However, as has been the case since 2007–08, Wodonga City Council was again assessed as medium risk. The council continues to pay off borrowings it incurred to fund its manufacturing, transport and logistics precinct known as LOGIC.
Similar to inner metropolitan councils, regional city councils have established assets. But uniquely; they serve as proxy centres to the large and small shire councils geographically located around them. The risk assessment suggests this cohort will need to continue to focus on spending on renewing and maintaining their existing assets while looking to stimulate economic growth in the area.
Large shire councils
Financial sustainability risk for the 16 large shire councils was assessed as low for 2012–13. Three councils in this cohort were assessed as medium risk (one council in 2011–12).
Moira Shire Council was medium risk (low in 2011–12) because of its self-financing ratio, driven by the timing of natural disaster funding and associated works.
South Gippsland Shire Council was also medium risk (low in 2011–12), following repayment of its portion of the defined benefit superannuation funding call liability in 2011–12, affecting its self-financing ratio.
Glenelg Shire Council was medium risk (low in 2011–12) because of its high indebtedness ratio after recognising additional landfill provisions associated with its Portland landfill site.
The capital replacement indicator for nine of the 16 councils was medium risk, highlighting the challenges large shire councils face in maintaining a level of capital spending to match the rate of depreciation on their existing assets.
Small shire councils
The financial sustainability risk for the 21 small shire councils was assessed as low for 2012–13. Buloke Shire Council was again assessed as high risk (high in 2011–12).
Buloke reported a positive underlying result for 2012–13. However, borrowing during 2012–13 to cover the defined benefit superannuation funding call liability further reduced its poor liquidity ratio from 2011–12. The audit opinion on the 2012–13 financial statements continued to emphasise this matter.
Pyrenees Shire Council's financial sustainability risk was assessed as medium (low in 2011–12) because of its self-financing ratio caused by a combination of the early payment of its defined benefit superannuation funding call liability and the timing of natural disaster funding and associated works.
This cohort of councils is the most vulnerable as their ratepayer bases are smaller, making them highly dependent on government funding to support their continued operations. Their reliance on government funding exposes them to the potential for higher financial risks in the future.
5.3 Five-year sustainability trend analysis
This section analyses and comments on the trends for six sustainability indicators over the past five years.
5.3.1 Underlying result
A continuous positive underlying operating result means that an entity has the capacity to expand services, reduce debt and/or facilitate capital works.
The underlying result for the sector across the five years has been positive, fluctuating between 5 per cent and 8 per cent indicating no immediate concerns at the sector level. However, in 2011–12, inner metropolitan, outer metropolitan and regional city council categories experienced declines in their average underlying results. They were impacted by a larger proportion of the call to address shortfalls in the defined benefit superannuation fund.
The impact of the defined benefit superannuation funding call was not as significant for the small shire and large shire cohorts in 2011–12 as it was offset by an increase in natural disaster funding for bushfires and floods.
Figure 5C shows the average underlying result for all councils since 2008–09.
Figure 5C
Average underlying result, by council category
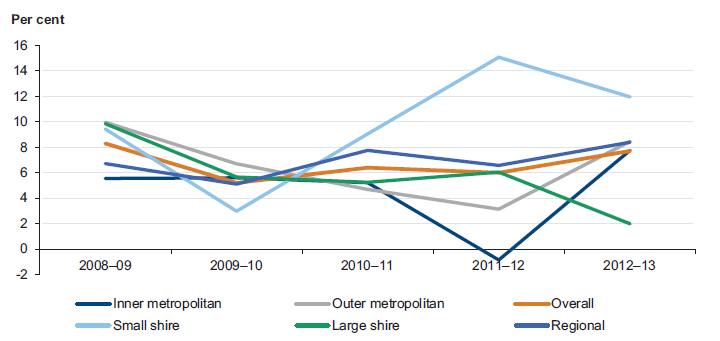
Source: Victorian Auditor-General’s Office.
Subsequently, the average underlying results for inner metropolitan, outer metropolitan and regional city councils improved. Overall, in 2012–13 eight councils reported an underlying deficit for the year, compared with 22 in 2011–12.
The results for small shire and large shire councils reduced in 2012–13, affected by lower natural disaster funding for floods and bushfires because there were fewer eligible incidents in 2012–13.
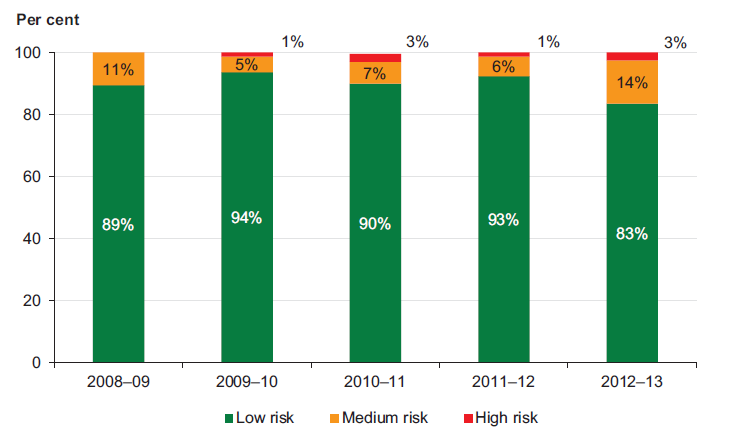
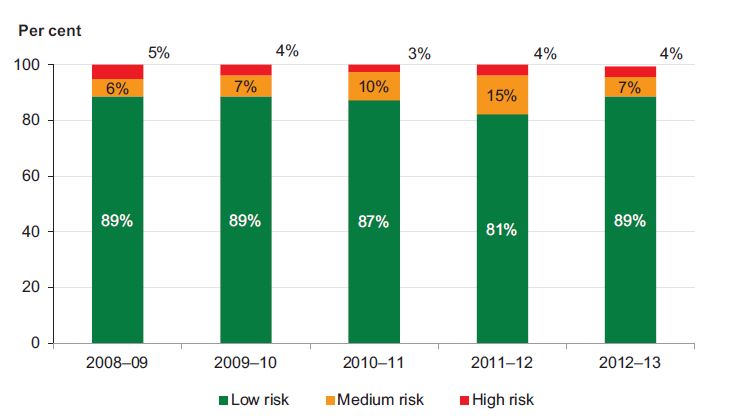
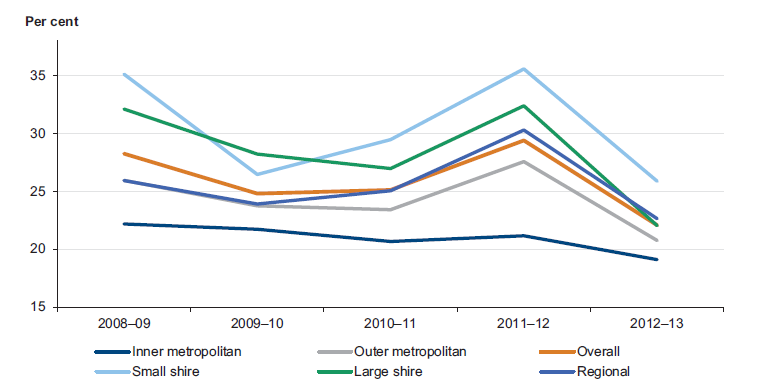
Figure 5D shows that the underlying result of 5 per cent of councils was assessed as medium risk in 2012–13 (5 per cent in 2011–12).
Figure 5D
Underlying result risk assessment
Source: Victorian Auditor-General’s Office.
The proportion of councils assessed as medium risk or high has decreased from 17 per cent to 5 per cent since 2009–10. The 2009–10 assessment reflected only one quarter grant payments in advance compared to two quarterly instalments in advance received since 2010–11.
5.3.2 Liquidity
Figure 5E shows that the average liquidity ratio for the sector was above 1.50 for 2012–13, indicating no immediate concerns at the sector level. However, the ability of councils to repay their short-term financial obligations has declined in all but the small shire cohort.
Figure 5E
Average liquidity ratio, by council category
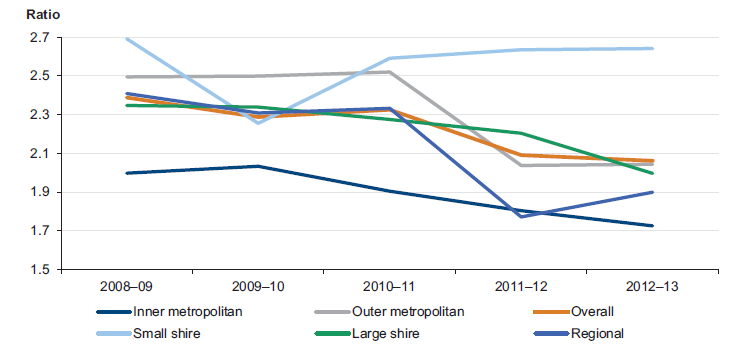
Source: Victorian Auditor-General’s Office.
The average liquidity ratio decreased from 2.09 in 2011–12 to 2.06 in 2012–13. Large shire and inner metropolitan councils experienced declines in their average liquidity ratios due to the 2011–12 repayment of the defined benefit superannuation funding call.
The liquidity ratio for small shire councils has averaged over 2.50 since 2010–11. Councils in this cohort were subject to bushfires and flooding over recent years, resulting in them receiving large amounts of natural disaster funding. The high ratio provides cash flow for repaying short-term debt. However, it can also indicate that cash has not been used effectively.
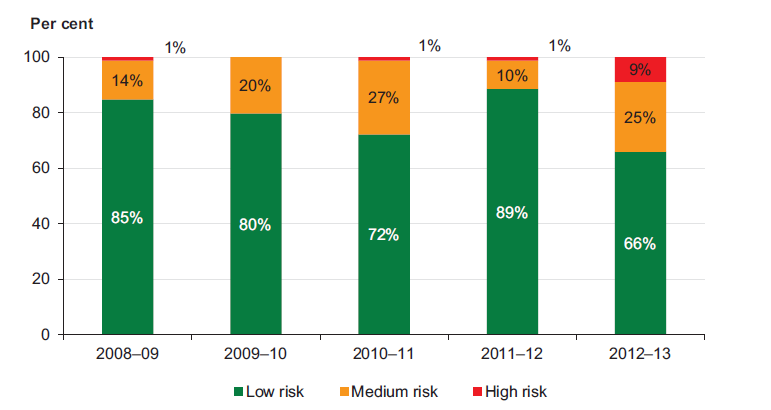
Figure 5F
Liquidity risk assessment
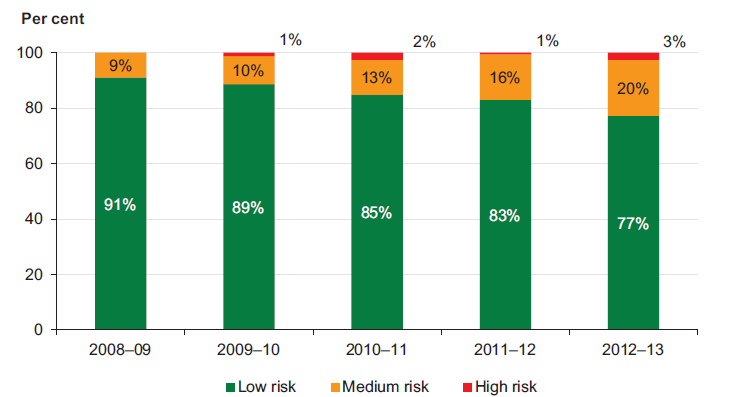
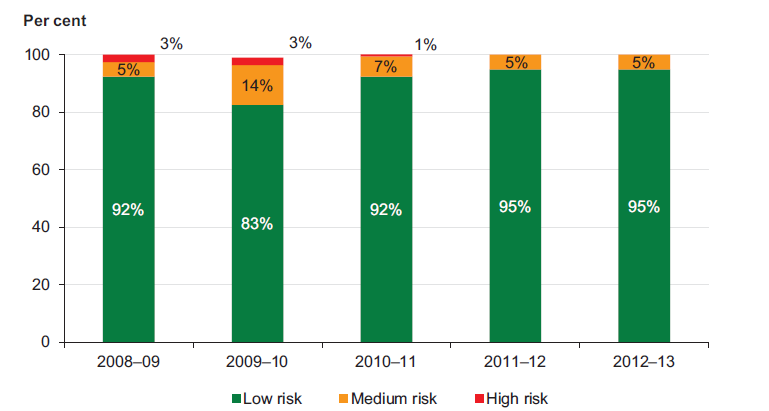
Source: Victorian Auditor-General’s Office.
Figure 5F shows that the proportion of councils assessed as having high liquidity risk increased from 1 per cent in 2011–12 to 3 per cent in 2012–13. The proportion of councils with medium liquidity risk also increased, from 16 per cent in 2011–12 to 20 per cent in 2012–13.
The impact on councils choosing to pay their liabilities for the defined benefit superannuation funding call varied. Councils with a deteriorating liquidity risk would have elected to pay their liability in 2012–13 to take advantage of early payment discounts.
5.3.3 Indebtedness
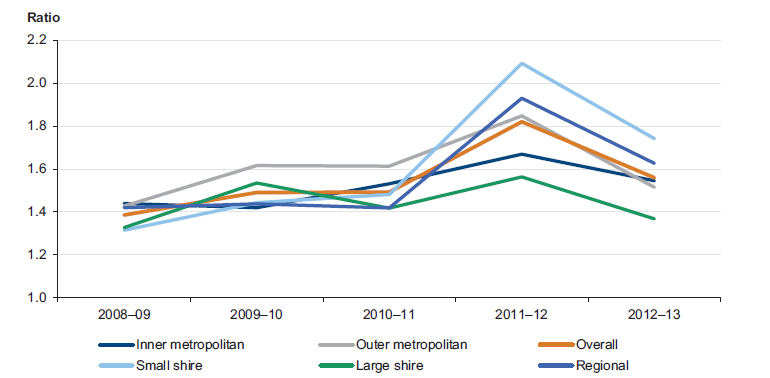
Figure 5G shows the average indebtedness of councils over the five-year period.
Figure 5G
Average indebtedness, by council category
Source: Victorian Auditor-General’s Office.
Average indebtedness for the sector, which peaked in 2011–12, was again affected by the payment option adopted. The improvement in 2012–13 was due to a reduction in obligations for those councils that chose to defer payment to 2012–13.
Inner metropolitan councils continued to have the lowest indebtedness of all categories and the greatest capacity to increase revenue through fees and charges. As a result, the risk that inner metropolitan councils will not service their debt is low.
Large shire and regional councils continue to have the highest indebtedness. These councils have limited discretionary revenue options and need to actively manage and monitor their debt.
Figure 5H shows that the proportion of councils in the medium- and high-risk categories is comparable to the proportions prior to 2011–12. Nevertheless councils need to remain focused on maintaining sustainable debt levels.
Figure 5H
Indebtedness risk assessment
Source: Victorian Auditor-General’s Office.
5.3.4 Self-financing
The self-financing ratio gives an indication on whether councils have generated sufficient operating cash flows to invest in asset renewal and repay any debt that may have incurred in the past. A self-financing risk assessment of greater than 20 per cent indicates that an entity has a lower risk of not being able to generate enough cash from operations to fund assets.
Figure 5I shows that the overall average self-financing risk assessment for councils remained above 20 per cent, but declined in 2012–13 as cash holdings decreased due to payments of the defined benefit superannuation funding call and lower natural disaster funding receipts in 2012–13.
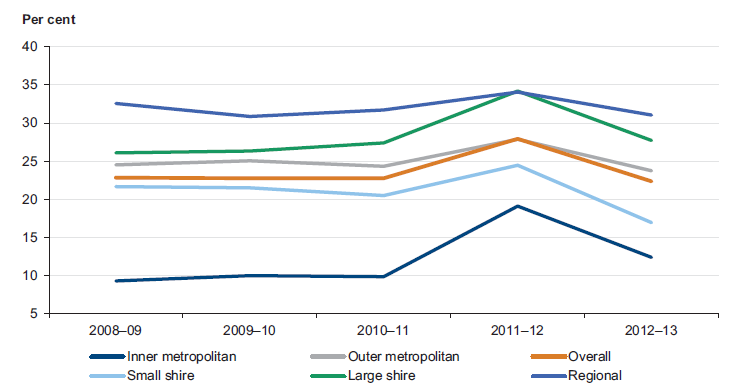
Figure 5I
Average self-financing, by council category
Source: Victorian Auditor-General’s Office.
Figure 5J shows an increase in self-financing risk over the five-year period. Nine per cent of councils were rated as high risk in 2012–13 compared with 1 per cent in 2011–12 and the proportion of councils rated as medium risk increased from 10 per cent in 2011–12 to 25 per cent in 2012–13.
Figure 5J
Self-financing risk assessment
Source: Victorian Auditor-General’s Office.
5.3.5 Capital replacement
Figure 5K shows the average capital replacement ratio across all council categories.
Figure 5K
Average capital replacement ratio, by council category
Source: Victorian Auditor-General’s Office.
The overall trend for the sector shows that capital spending on infrastructure, property, plant and equipment has improved since 2008–09 and is now at one and a half times the rate of aggregate depreciation and amortisation. However, in 2012–13 all council categories experienced decreases in their average capital replacement ratio. Lower aggregate capital expenditure of $1.8 billion in 2012–13 (2011–12: $1.9 billion) as well as higher depreciation of $1.2 billion (2011–12: $1.1 billion) contributed to the decline.
The capital replacement risk assessment for the large shire cohort changed from low in 2011–12 to medium in 2012–13 suggesting there is insufficient capital spending to match the consumption of assets.
Small shire councils and regional councils were the most challenged cohorts in 2008–09, however, due to increased capital spend associated with natural disasters their spending has grown to overtake all other council categories.
While outer metropolitan councils spend the most on assets, this needs to be assessed in conjunction with the renewal gap indicator. These councils service growth corridors, hence spending on new infrastructure is high, driving a higher capital replacement result.
Figure 5L shows that 46 per cent of councils were rated as having medium capital replacement risk in 2012–13 compared to 57 per cent in 2011–12. The proportion of councils assessed as low risk increased by 10 per cent in 2012–13 demonstrating that councils have made progress in replacing assets at a rate consistent with their consumption.
Figure 5L
Capital replacement risk assessment
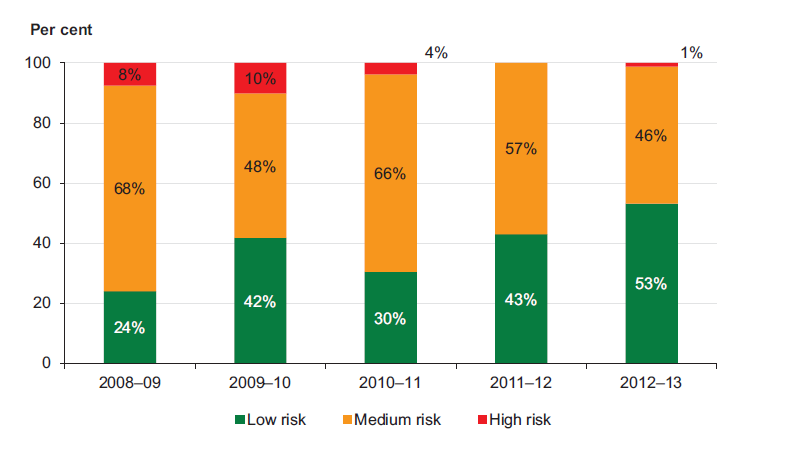
Source: Victorian Auditor-General’s Office.
5.3.6 Renewal gap
The renewal gap compares the rate of spending through renewing, restoring and replacing existing assets. Spending more than the rate an asset is used indicates that an entity is sufficiently maintaining and renewing its assets.
Figure 5M shows that the average renewal gap across all council categories improved over the five-year period. Outer metropolitan councils have typically spent less on renewal than other council categories. As predominantly growth area councils they have higher new infrastructure needs compared with established councils that require greater focus on maintenance and renewal. However, the longer-term challenge of maintaining and renewing their infrastructure remains for outer metropolitan councils as their assets begin to age and deteriorate over time.
Figure 5M
Average renewal gap, by council category
Source: Victorian Auditor-General’s Office.
Figure 5N shows that the proportion of councils with a low renewal gap risk increased from 56 per cent in 2011–12 to 65 per cent in 2012–13. The proportion of councils rated as high risk remained the same.
Figure 5N
Renewal gap risk assessment
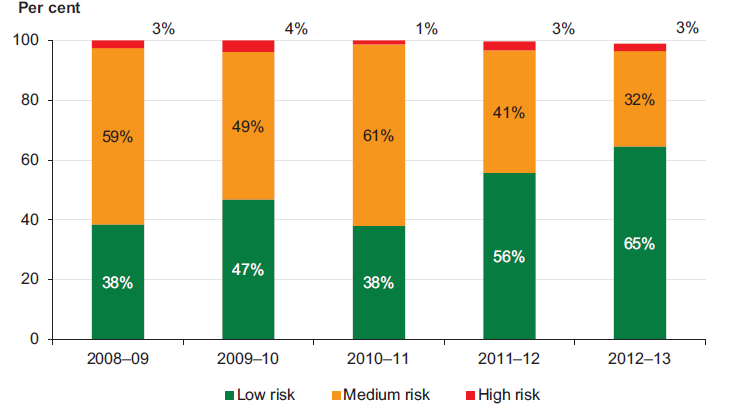
Source: Victorian Auditor-General’s Office.
The improvement has come from small and large shire councils, with three councils in each category previously rated as medium, now rated low risk. While overall the result has improved, councils need to remain focused on maintaining assets at serviceable levels.
6 Internal controls of councils
At a glance
Background
This Part presents the results of our assessment of the internal controls associated with the preparation of financial statements, the audit committee arrangements and controls over rate revenue.
Findings
Internal controls at councils were adequate for producing reliable financial statements.
During 2012–13, 78 of 79 councils had an audit committee in place. West Wimmera Shire Council has not had a functioning audit committee since August 2011. It was pleasing that the audit committee was re-formed in August 2013 and held its first meeting. Moira Shire Council determined to suspend its audit committee in September 2013 but the decision was rescinded in October 2013.
Twenty-two of the 78 audit committees in place during 2012–13 did not have sufficient independent members on their audit committees.
All councils had a rating strategy in place, however, the completeness, content and quality of the strategies varied. While the Local Government Act 1989 does not require one, the absence of a strategy that addresses the better practice elements outlined in this report affects the ability of councils to readily demonstrate the soundness and reasonableness of their rating decisions.
Recommendations
That councils:
- require audit committees to periodically self-assess their performance against their charters
- appoint an independent member as chair and require membership of the audit committee to include a majority of independent members
- maintain a conflict of interests register for audit committee members
- improve their rating strategies by incorporating elements of better practice identified in this report
- use internal audit to assess the robustness of their rating systems and compliance with legislative requirements.
6.1 Introduction
Poor internal controls diminish management's ability to achieve an entity's objectives, deliver upon agreed service levels and comply with relevant legislation. Poor internal controls also increase the risk of fraud, error, irregularities and misstatement. Reliable internal controls are a prerequisite for accurate and timely reporting. A representation of the internal control framework and its main components are set out in Appendix C.
The councillors and management of each local council are responsible for developing and maintaining adequate systems of internal control to enable:
- preparation of accurate financial records and other supporting information
- timely and reliable external and internal reporting
- safeguarding of public assets
- prevention or detection of fraud, errors and other irregularities.
Integral to the annual financial audit is an assessment of the adequacy of the internal control framework, and the governance processes, related to an entity's financial reporting.
Internal controls are systems, policies and procedures that help an entity to reliably and cost-effectively meet its objectives. Sound internal controls enable delivery of reliable, accurate and timely external and internal reports.
This Part comments on the general internal controls associated with the preparation of financial statements of the 79 councils, audit committee arrangements and rate revenue.
6.2 General internal controls
Internal controls at councils were assessed as adequate for producing reliable financial statements.
Weaknesses in controls found during the audits were reported to its mayor or chairperson, chief executive officer and audit committee in a management letter.
6.3 Audit committees
An independent and effective audit committee is critical to good governance. It assists council in discharging its responsibilities, and strengthens the financial accountability of the council and its senior management.
Key responsibilities of the audit committee include overseeing an entity's risk management framework, internal control environment and the accountability of senior management, engaging with internal and external audit and monitoring the status of actions to address audit recommendations.
Under the Local Government Act 1989 (the Act), primary responsibility for establishing and appropriately using an audit committee rests with the appointed council.
6.3.1 Audit committee framework
In establishing controls, councils should maintain an audit committee that incorporates:
- a comprehensive audit committee charter
- sound governance and oversight
- engagement with internal and external audit.
Figure 6A outlines the key elements of an effective audit committee framework. It draws on the requirements of the Act, Local Government Victoria's Audit Committees – A guide to good practice for local government, January 2011 and the ANAO's Public Sector Audit Committees – Independent Assurance and Advice for Chief Executives and Boards Better Practice Guide, August 2011.
Figure 6A
Key elements of an effective audit committee framework
|
Component |
Key elements |
|---|---|
|
Audit committee charter |
Audit committee charter is in place and sets out:
Charter approved by council. |
|
Governance and oversight |
Direct access and a clear reporting line to council. Oversight of entity's risk management framework and internal control framework. Advice provided to council and the chief executive on matters of concern and matters raised in audit reports. Advice provided to council and the chief executive on the preparation and review of the council's financial statements. Minutes of meetings prepared, approved and provided to council and the chief executive. Records of meetings held and attendances maintained. Self-assessment of performance annually. |
|
Involvement with internal and external audit |
External audit:
|
Source: Victorian Auditor-General's Office.
Of 79 local councils 78 had an audit committee in place during 2012–13. West Wimmera Shire Council has not had a functioning audit committee since August 2011. It was pleasing that the audit committee was re-formed in August 2013 and held its first meeting.
Moira Shire Council determined to suspend its audit committee in September 2013 but the decision was rescinded in October 2013.
6.3.2 Audit committee charter
The 78 councils with audit committees each had an approved audit committee charter and many of the better practice elements were in place. The following matters were covered in the charters of most councils:
- the role of the audit committee—100 per cent
- frequency of meetings—99 per cent
- attendance requirements for meetings and quorums—99 per cent
- reporting lines to council—99 per cent.
Committee role and composition
The audit committee oversaw matters of accountability and internal control and had direct access to elected council members in each of the 78 councils. Most audit committees had at least three members.
Better practice is that an audit committee be chaired by an independent chair, and comprise a majority of independent members. Councillors are not regarded as independent as they are part of the policy and decision-making processes of councils.
Of the 78 audit committees, 22 did not have sufficient independent members on their audit committees. One had a chairperson who was not independent.
Independent committee members can enrich audit committees by providing a range of experience and capabilities over and above those of elected councillors or council staff. They can also provide unbiased advice to council and challenge established thinking and approaches.
Register of interests
All 78 councils required audit committee members to disclose conflicts of interest at the commencement of each audit committee meeting, as required under the Act. However, only 45 maintained a conflict of interests register.
Failure to maintain a register can affect the ability of council officers to avoid conflicts in the event that such conflicts are not routinely disclosed at meetings.
Skills and experience
Independent members were suitably qualified with the majority of independent members experienced in:
- risk identification, evaluation and management—92 per cent
- project and program management—84 per cent
- information technology and controls—82 per cent
- understanding the roles of internal and external audit—93 per cent
- application of accounting, auditing and assurance standards—85 per cent.
6.3.3 Governance and oversight
Review of performance
In 29 of the 78 councils (37 per cent) the audit committee had not self-assessed its performance against its charter in the past 12 months.
Performance assessments provide information that the audit committee can use to improve processes. They are also used by audit when evaluating the control environment, including considering the effectiveness of the audit committee's oversight of financial reporting.
Review of financial statements
Of the 78 audit committees, 68 (87 per cent) reviewed and endorsed the entity's financial statements before presentation to council. These committees also provided advice and guidance to the chief executive officer about audit recommendations and requests for adjustments to financial statements.
Internal and external audit oversight
Seventy-four of the 78 councils with an audit committee engaged extensively with internal audit and were involved in reviewing internal audit's performance, coverage, annual work plans, and monitoring the implementation of recommendations made by internal audit. The remaining four councils do not have an internal audit function.
All 78 audit committees had appropriate communication protocols with external auditors, including for reviewing management letters and audit reports, and monitoring implementation of audit recommendations.
6.4 Rate revenue
Victoria's 79 councils rely heavily on revenue generated by property-based rates and charges to provide services to local communities. In 2012–13, councils generated operating revenue of $8.35 billion, with rates and charges accounting for $4.30 billion, or 52 per cent, of the total revenue.
Councils have statutory obligations and a responsibility to ratepayers to apply a robust and strategic approach to the collection and use of revenue through rates and charges. This is important given the rising financial pressures on councils.
Figure 6B outlines elements of an effective rating strategy. It draws from the Department of Victorian Communities' Developing a Rating Strategy: A Guide for Councils and A Rating Strategy: An Example 2004.
Figure 6B
Key elements of an effective rating strategy
|
Component |
Key elements |
|---|---|
|
Rating strategy, policy and procedures |
A rating strategy, policy and procedures are in place. The rating strategy, policy and procedures include:
|
|
Governance and oversight |
Rating decisions:
Adequacy of rating structures and decisions regularly reviewed. Rate structure proposals developed and impact on ratepayers and council objectives assessed. Compliance with approved policy and procedures and strategy monitored by councillors or audit committee. The nature of information provided to councillors about rates revenue and level of detail enables them to monitor performance effectively. Rating strategy, policy and procedures periodically reviewed and approved by council. |
|
Internal audit oversight |
Adequacy of, and compliance with, rating policy and procedures and strategy reviewed. Controls over the billing and property systems including data analysis reviewed. |
Source: Victorian Auditor-General's Office.
6.4.1 Rating policies and quality of strategies
Of the 79 councils, 14 had a policy specifically relating to rating revenue. Of the remaining 65, 39 had a revenue policy included as part of other policies, the Strategic Resource Plan, Rating Strategy or other procedure manual.
All councils had a rating strategy. However, the completeness, content and quality of the strategies varied.
Elements of better practice covered in the majority of rating strategies included:
- references to the legislative framework, including the objectives of the Act and the rating structure options available—58 councils (73 per cent)
- descriptions of the rating structure applied adequately described the rating structure, including the valuation method, differentials and charges—70 councils (89 per cent).
However, the following elements were not well incorporated in rating strategies across the sector:
- rate changes including the change amount, driving factors and a comparison to historical rate increases—33 per cent
- the rating options available to council and the reasons for council's choices—43per cent
- a link between the rating strategy to other council plans and strategies and benchmarking against other similar councils—51 per cent
- acknowledgement of the adverse effect that concession to one group of ratepayers could have on others—68 per cent
- the consideration of outcomes against best value principles and council objectives—56 per cent
- research or evidence used to support the introduction and use of differential rates adequately set out—66 per cent
- research to identify influences on rates, such as economic trends, demographic patterns and valuation shifts cited—63 per cent.
These findings were consistent with VAGO's performance audit report Rating Practices in Local Government (2012–13:22) which highlighted inconsistencies in rating practices of councils and the quality and soundness of council rating decisions.
While the Act does not require a rating strategy to be developed, the absence of a strategy that addresses the better practice elements affects the ability of councils to readily demonstrate the soundness and reasonableness of their rating decisions.
6.4.2 Oversight and management practices
Seventy-six councils (96 per cent) reported to their councillors or executive management on actual rate revenue compared to budgeted amounts. The frequency of reporting varied across councils with reporting occurring monthly, quarterly or annually.
Forty-two councils (53 per cent) had key performance indicators (KPIs) set by management addressing rates revenue. The KPIs included percentage collection targets and percentage of rates arrears. Of the 42, 76 per cent reported to management on performance against the KPIs. Seventy-eight per cent of the 42 reported monthly or annually.
6.4.3 Internal audit oversight
In the past three years only 22 councils (28 per cent) used internal auditors to assess the robustness of their rating systems and compliance with legislative requirements.
Internal audit can provide comfort that internal controls are operating as intended, and identify control weaknesses and potential process improvements.
Recommendations
That councils:
- require audit committees to periodically self-assess their performance against their charters
- appoint an independent member as chair and require membership of the audit committee to include a majority of independent members
- maintain a conflict of interests register for audit committee members
- improve their rating strategies by incorporating elements of better practice identified in this report—including links to council plans, the rationale for rate changes, rating options adopted, and the assumptions and factors considered in rate setting
- use internal audit to assess the robustness of their rating systems and compliance with legislative requirements.
Appendix A. VAGO reports on the results of financial audits
This report is part of a suite of reports presented to Parliament covering the results of our audits of public sector financial reports. The reports are outlined in Figure A1.
Figure A1
VAGO reports on the results of the 2012–13 financial audits
|
Report |
Description |
|---|---|
|
Auditor-General's Report on the Annual Financial Report of the State of Victoria, 2012–13 |
The report provides the result of the audit of the state's annual financial report. The report addresses the quality and timing of financial reporting, explains significant financial results for the state and financial implications of significant projects and developments that occurred during 2012–13. Tabled in Parliament in November 2013. |
|
Portfolio Departments and Associated Entities: Results of the 2012–13 Audits |
The report provides the results of the audits of approximately 210 entities. The report addresses their financial reporting, financial sustainability and reporting developments, the use of contractors and temporary staff, and management of business continuity and information technology disaster recovery planning. Tabled in Parliament in November 2013. |
|
The report provides the results of the audits of approximately 110 entities in the public hospital sector. It addresses their financial performance, financial sustainability, and management of private patient fees and risk. Tabled in Parliament in November 2013. |
|
|
Local Government: Results of the 2012–13 Audits This report |
This report provides the results of the audits of approximately 100 entities in the local government sector. This report addresses their financial and performance reporting, financial sustainability, aspects of how they manage rate revenue, and the operation of audit committees. Tabled in Parliament in December 2013. |
|
Water Entities: Results of the 2012–13 Audits |
The report provides the results of the audits of 20 entities in the water sector. The report addresses their financial and performance reporting, financial sustainability, and comments on internal controls relating to information technology security and change management, procurement and treasury management. Proposed to be tabled in Parliament in December 2013. |
|
Tertiary Education and Other Entities: Results of the 2013 Audits |
This report provides the results of the audits of approximately 110 entities with a financial year other than 30 June 2013. The report will address their financial and performance reporting, financial sustainability, their financial policies and delegations, and management of procurement. Proposed to be tabled in Parliament in May 2014. |
Source: Victorian Auditor-General’s Office.
Appendix B. Complete audit listing
Inner metropolitan councils and associated entities
Audit types |
Financial statements(a) |
Timeliness of audited financial statement completion |
||||||
|---|---|---|---|---|---|---|---|---|
Entity |
LG Act |
Non-LG |
Clear opinion issued |
Auditor-General's report signed |
Before 30 Sep 2013 |
After 30 Sep 2013 |
||
COMPLETED AUDITS WITHIN 30 JUNE 2013 BALANCE DATES |
||||||||
Banyule |
• |
✔ |
26 Sep 2013 |
• |
||||
Bayside |
• |
✔ |
16 Sep 2013 |
• |
||||
Boroondara |
• |
✔ |
6 Sep 2013 |
• |
||||
Darebin |
• |
✔ |
12 Sep 2013 |
• |
||||
Glen Eira |
• |
✔ |
12 Sep 2013 |
• |
||||
Hobsons Bay |
• |
✔ |
13 Sep 2013 |
• |
||||
Kingston |
• |
✔ |
13 Sep 2013 |
• |
||||
Maribyrnong |
• |
✔ |
20 Sep 2013 |
• |
||||
Maroondah |
• |
✔ |
30 Aug 2013 |
• |
||||
Melbourne |
• |
✔ |
30 Aug 2013 |
• |
||||
City Wide Service Solutions Pty Ltd |
C |
✔ |
22 Aug 2013 |
• |
||||
Queen Victoria Market Pty Ltd |
C |
✔ |
22 Aug 2013 |
• |
||||
Regent Management Company Pty Ltd |
C |
✔ |
23 Aug 2013 |
• |
||||
Sustainable Melbourne Trust Fund |
O |
✔ |
30 Aug 2013 |
• |
||||
Monash |
• |
✔ |
25 Sep 2013 |
• |
||||
Moonee Valley |
• |
✔ |
12 Sep 2013 |
• |
||||
Moreland |
• |
✔ |
16 Sep 2013 |
• |
||||
Port Phillip |
• |
✔ |
11 Sep 2013 |
• |
||||
Stonnington |
• |
✔ |
3 Sep 2013 |
• |
||||
Prahran Market Pty Ltd |
C |
✔ |
2 Sep 2013 |
• |
||||
Whitehorse |
• |
✔ |
30 Aug 2013 |
• |
||||
Yarra |
• |
✔ |
23 Aug 2013 |
• |
||||
2012–13 Total number of entities = 22* |
17 |
5 |
22 |
0 |
||||
Per cent |
100 |
0 |
||||||
2011–12 Total number of entities = 23 |
17 |
6 |
23 |
0 |
||||
Per cent |
100 |
0 |
||||||
(a) Councils – includes financial, standard and performance statements.
Note: Non-LG types: C – Corporations Act 2001
and O – other reporting framework.
* The Melbourne Wholesale Fisk Market Pty Ltd is no longer a controlled entity of the Melbourne City Council.
Source: Victorian
Auditor-General's Office.
Outer metropolitan councils
Audit types |
Financial statements(a) |
Timeliness of audited financial statement completion |
||||||
|---|---|---|---|---|---|---|---|---|
Entity |
LG Act |
Non-LG |
Clear opinion issued |
Auditor-General's report signed |
Before 30 Sep 2013 |
After 30 Sep 2013 |
||
COMPLETED AUDITS WITHIN 30 JUNE 2013 BALANCE DATES |
||||||||
Brimbank |
• |
✔ |
12 Sep 2013 |
• |
||||
Cardinia |
• |
✔ |
20 Sep 2013 |
• |
||||
Casey |
• |
✔ |
5 Sep 2013 |
• |
||||
Frankston |
• |
✔ |
11 Oct 2013* |
• |
||||
Greater Dandenong |
• |
✔ |
11 Sep 2013 |
• |
||||
Dandenong Market Pty Ltd |
C |
✔ |
30 Sep 2013 |
• |
||||
Hume |
• |
✔ |
18 Sep 2013 |
• |
||||
Knox |
• |
✔ |
5 Sep 2013 |
• |
||||
Manningham |
• |
✔ |
22 Aug 2013 |
• |
||||
Melton |
• |
✔ |
16 Sep 2013 |
• |
||||
Mornington Peninsula |
• |
✔ |
13 Aug 2013 |
• |
||||
Nillumbik |
• |
✔ |
30 Aug 2013 |
• |
||||
Whittlesea |
• |
✔ |
20 Sep 2013 |
• |
||||
Wyndham |
• |
✔ |
20 Sep 2013 |
• |
||||
Yarra Ranges |
• |
✔ |
6 Sep 2013 |
• |
||||
2012–13 Total number of entities = 15 |
14 |
1 |
14 |
1 |
||||
Per cent |
93 |
7 |
||||||
2011–12 Total number of entities = 14 |
14 |
0 |
14 |
0 |
||||
Per cent |
100 |
0 |
||||||
(a) Councils – includes financial standard and performance statements.
* Reporting extension granted by the Minister for Local Government until 30 November 2013.
Note: Non-LG
audit types: C – Corporations Act 2001
and O – other reporting framework.
Source: Victorian
Auditor-General's Office.
Regional city councils and associated entities
Audit types |
Financial statements(a) |
Timeliness of audited financial statement completion |
||||||
|---|---|---|---|---|---|---|---|---|
Entity |
LG Act |
Non-LG |
Clear opinion issued |
Auditor-General's report signed |
Before 30 Sep 2013 |
After 30 Sep 2013 |
||
COMPLETED AUDITS WITHIN 30 JUNE 2013 BALANCE DATES |
||||||||
Ballarat |
• |
✔ |
17 Sep 2013* |
• |
||||
Greater Bendigo |
• |
✔ |
12 Sep 2013 |
• |
||||
Greater Geelong |
• |
✔ |
30 Aug 2013 |
• |
||||
Greater Shepparton |
• |
✔ |
25 Sep 2013 |
• |
||||
Horsham |
• |
✔ |
20 Sep 2013 |
• |
||||
Latrobe |
• |
✔ |
19 Sep 2013 |
• |
||||
Mildura |
• |
✔ |
27 Sep 2013 |
• |
||||
Mildura Airport Pty Ltd |
C |
✔ |
27 Sep 2013 |
• |
||||
Swan Hill |
• |
✔ |
26 Sep 2013 |
• |
||||
Wangaratta |
• |
✗(b) |
25 Sep 2013 |
• |
||||
Warrnambool |
• |
✔ |
24 Sep 2013 |
• |
||||
Wodonga |
• |
✔ |
23 Sep 2013 |
• |
||||
2012–13 Total number of entities = 12 |
11 |
1 |
12 |
0 |
||||
Per cent |
100 |
0 |
||||||
2011–12 Total number of entities = 12 |
11 |
1 |
12 |
0 |
||||
Per cent |
100 |
0 |
||||||
(a) Councils – includes financial, standard and performance statements.
(b) Only performance statement received a qualification.
Note: Non-LG
audit types: C – Corporations Act 2001.
* AG report on performance statement signed 26 Sep 2013
Source: Victorian
Auditor-General's Office.
Large shire councils
Audit types |
Financial statements(a) |
Timeliness of audited financial statement completion |
||||||
|---|---|---|---|---|---|---|---|---|
Entity |
LG Act |
Non-LG |
Clear opinion issued |
Auditor-General's report signed |
Before 30 Sep 2013 |
After 30 Sep 2013 |
||
COMPLETED AUDITS WITHIN 30 JUNE 2013 BALANCE DATES |
||||||||
Bass Coast |
• |
✔ |
23 Sep 2013 |
• |
||||
Baw Baw |
• |
✔ |
13 Sep 2013 |
• |
||||
Campaspe |
• |
✔ |
18 Sep 2013 |
• |
||||
Colac-Otway |
• |
✔ |
27 Sep 2013 |
• |
||||
Corangamite |
• |
✔ |
25 Sep 2013 |
• |
||||
East Gippsland |
• |
✔ |
25 Sep 2013 |
• |
||||
Glenelg |
• |
✔ |
13 Sep 2013 |
• |
||||
Macedon Ranges |
• |
✔ |
16 Sep 2013 |
• |
||||
Mitchell |
• |
✔ |
24 Sep 2013 |
• |
||||
Moira |
• |
✔ |
23 Oct 2013 * |
• |
||||
Moorabool |
• |
✔ |
20 Sep 2013 |
• |
||||
Moyne |
• |
✔ |
17 Sep 2013 |
• |
||||
South Gippsland |
• |
✔ |
19 Sep 2013 |
• |
||||
Southern Grampians |
• |
✔ |
17 Sep 2013 |
• |
||||
Surf Coast |
• |
✔ |
30 Aug 2013 |
• |
||||
Wellington |
• |
✔ |
17 Sep 2013 |
• |
||||
2012–13 Total number of entities = 16 |
16 |
0 |
15 |
1 |
||||
Per cent |
94 |
6 |
||||||
2011–12 Total number of entities = 16 |
16 |
0 |
16 |
0 |
||||
Per cent |
100 |
0 |
||||||
(a) Councils – includes financial standard and performance statements.
* Reporting extension granted by the Minister for Local Government until 30 November 2013.
Source: Victorian
Auditor-General's Office.
Small shire councils
Audit types |
Financial statements(a) |
Timeliness of audited financial statement completion |
||||||
|---|---|---|---|---|---|---|---|---|
Entity |
LG Act |
Non-LG |
Clear opinion issued |
Auditor-General's report signed |
Before 30 Sep 2013 |
After 30 Sep 2013 |
||
COMPLETED AUDITS WITHIN 30 JUNE 2013 BALANCE DATES |
||||||||
Alpine |
• |
✔ |
20 Sep 2013 |
• |
||||
Ararat |
• |
✔ |
20 Sep 2013 |
• |
||||
Benalla |
• |
✔ |
20 Sep 2013 |
• |
||||
Buloke |
• |
✔ |
27 Sep 2013 |
• |
||||
Central Goldfields |
• |
✔ |
30 Sep 2013 |
• |
||||
Gannawarra |
• |
✔ |
16 Sep 2013 |
• |
||||
Golden Plains |
• |
✔ |
10 Sep 2013 |
• |
||||
Hepburn |
• |
✔ |
20 Sep 2013 |
• |
||||
Hindmarsh |
• |
✔ |
23 Sep 2013 |
• |
||||
Indigo |
• |
✔ |
20 Sep 2013 |
• |
||||
Loddon |
• |
✔ |
24 Sep 2013 |
• |
||||
Mansfield |
• |
✔ |
12 Sep 2013 |
• |
||||
Mount Alexander |
• |
✔ |
25 Sep 2013 |
• |
||||
Murrindindi |
• |
✔ |
26 Sep 2013 |
• |
||||
Northern Grampians |
• |
✔ |
6 Sep 2013 |
• |
||||
Pyrenees |
• |
✔ |
11 Sep 2013 |
• |
||||
Queenscliffe |
• |
✔ |
30 Sep 2013 |
• |
||||
Strathbogie |
• |
✔ |
25 Sep 2013 |
• |
||||
Towong |
• |
✔ |
20 Sep 2013 |
• |
||||
West Wimmera |
• |
✔ |
22 Oct 2013* |
• |
||||
Yarriambiack |
• |
✔ |
30 Sep 2013 |
• |
||||
2012–13 Total number of entities = 21 |
21 |
0 |
20 |
1 |
||||
Per cent |
95 |
5 |
||||||
2011–12 Total number of entities = 21 |
21 |
0 |
19 |
2 |
||||
Per cent |
90 |
10 |
||||||
(a) Councils – includes financial standard and performance statements.
* Reporting extension granted by the Minister for Local Government until 30 November 2013.
Source: Victorian
Auditor-General's Office.
Regional library corporations
Audit types |
Financial statements(a) |
Timeliness of audited financial statement completion |
||||||
|---|---|---|---|---|---|---|---|---|
Entity |
LG Act |
Non-LG |
Clear opinion issued |
Auditor-General's report signed |
Before 30 Sep 2013 |
After 30 Sep 2013 |
||
COMPLETED AUDITS WITHIN 30 JUNE 2013 BALANCE DATES |
||||||||
Casey-Cardinia |
• |
✔ |
5 Sep 2013 |
• |
||||
Corangamite |
• |
✔ |
26 Sep 2013 |
• |
||||
Eastern |
• |
✔ |
20 Sep 2013 |
• |
||||
Geelong |
• |
✔ |
22 Aug 2013 |
• |
||||
Goulburn Valley |
• |
✔ |
25 Sep 2013 |
• |
||||
High Country |
• |
✔ |
12 Sep 2013 |
• |
||||
North Central Goldfields |
• |
✔ |
6 Sep 2013 |
• |
||||
West Gippsland |
• |
✔ |
13 Sep 2013 |
• |
||||
Whitehorse-Manningham |
• |
✔ |
2 Sep 2013 |
• |
||||
Wimmera |
• |
✔ |
24 Sep 2013 |
• |
||||
Yarra Plenty |
• |
✔ |
30 Aug 2013 |
• |
||||
2012–13 Total number of entities = 11 |
11 |
0 |
11 |
0 |
||||
Per cent |
100 |
0 |
||||||
2011–12 Total number of entities = 11 |
11 |
0 |
11 |
0 |
||||
Per cent |
100 |
0 |
||||||
Source: Victorian Auditor-General's Office.
Associated companies
Audit types |
Financial statements(a) |
Timeliness of audited financial statement completion |
||||||
|---|---|---|---|---|---|---|---|---|
Entity |
LG Act |
Non-LG |
Clear opinion issued |
Auditor-General's report signed |
Before 30 Sep 2013 |
After 30 Sep 2013 |
||
COMPLETED AUDITS WITHIN 30 JUNE 2013 BALANCE DATES |
||||||||
Clayton Landfill Joint Venture |
O |
✔ |
17 Sep 2013 |
• |
||||
RFK Pty Ltd / Community Chef |
C |
✔ |
26 Sep 2013 |
• |
||||
Regional Kitchen Pty Ltd |
C |
✔ |
26 Sep 2013 |
• |
||||
Streetsahead Cleaning Services |
• |
✔ |
5 Sep 2013 |
• |
||||
Wimmera Development Association |
A |
✔ |
25 Sep 2013 |
• |
||||
2012–13 Total number of entities = 5* |
1 |
4 |
5 |
0 |
||||
Per cent |
100 |
0 |
||||||
2011–12 Total number of entities = 6 |
1 |
5 |
6 |
0 |
||||
Per cent |
100 |
0 |
||||||
Note: Non-LG
audit types: A – Associations Incorporation Act 1981, C – Corporations Act 2001
and O – other reporting framework.
* Yarra Energy Foundation no longer audited by the Victorian Auditor-General's Office.
Source: Victorian
Auditor-General's Office.
Overall totals
Audit types |
Timeliness of audited financial statement completion |
|||||||
|---|---|---|---|---|---|---|---|---|
Category |
LG Act |
Non-LG |
Before 30 Sep 2013 |
After 30 Sep 2013 |
||||
Inner metropolitan councils and associated entities |
17 |
5 |
22 |
0 |
||||
Outer metropolitan councils |
14 |
1 |
14 |
1 |
||||
Regional city councils and associated entities |
11 |
1 |
12 |
0 |
||||
Large shire councils |
16 |
0 |
16 |
0 |
||||
Small shire councils |
21 |
0 |
20 |
1 |
||||
Regional library corporations |
11 |
0 |
11 |
0 |
||||
Associated companies |
1 |
4 |
5 |
0 |
||||
2012–13 Overall total number of entities = 102 |
91 |
11 |
99 |
3 |
||||
Per cent |
97 |
3 |
||||||
2011–12 Overall total number of entities = 103 |
91 |
12 |
101 |
2 |
||||
Per cent |
98 |
2 |
||||||
Source: Victorian Auditor-General's Office.
Appendix C. Financial audit frameworks
Financial audit framework
The financial audit framework applied in the conduct of the 2012–13 audits of the local government sector is set out in Figure C1.
Figure C1
Financial audit framework
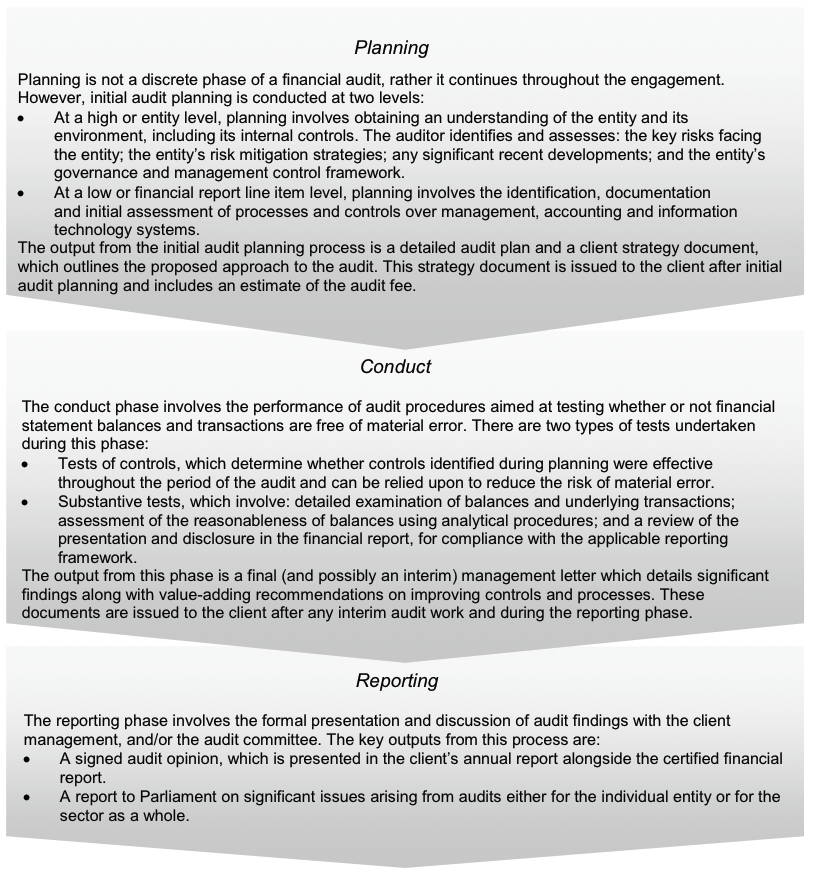
Source: Victorian Auditor-General’s Office.
Internal control framework
Figure C2 identifies the main components of an effective internal control framework.
Figure C2
Internal control framework
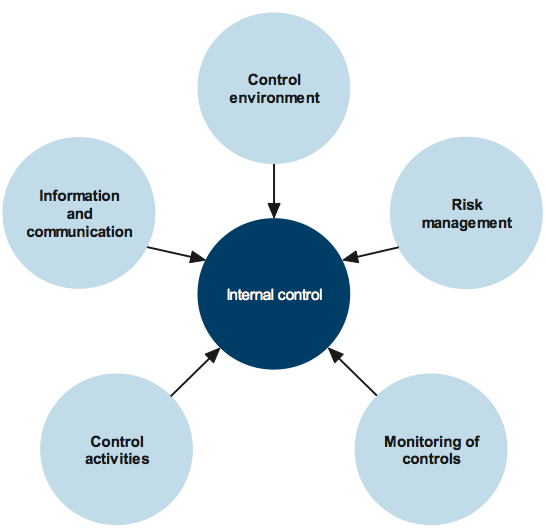
Source: Victorian Auditor-General’s Office.
Financial report preparation
Our assessment of council financial reporting performance against better practice was also based on criteria outlined in Figure C3.
Figure C3
Financial report preparation better practice
|
Key area |
Better practice |
|---|---|
|
Financial report preparation plan |
Establish a plan that outlines the processes, resources, milestones, oversight, and quality assurance practices required in preparing the financial report. |
|
Preparation of shell statements |
Prepare a shell financial report and provide it to the auditors early to enable early identification of amendments, minimising the need for significant disclosure changes at year-end. |
|
Materiality assessment |
Assess materiality, including quantitative and qualitative thresholds, at the planning phase in consultation with the audit committee. The assessment assists preparers to identify potential errors in the financial report. |
|
Monthly financial reporting |
Adopt full accrual monthly reporting to assist in preparing the annual financial report. This allows the year-end process to be an extension of the month-end process. |
|
Quality control and assurance procedures |
Require rigorous review of the supporting documentation, data and the financial report itself by an appropriately experienced and independent officer prior to providing it to the auditors. |
|
Supporting documentation |
Prepare high-standard documentation to support and validate the financial report and provide a management trail. |
|
Analytical reviews |
Undertake rigorous and objective analytical review during the financial report preparation process to help to improve the accuracy of the report. |
|
Reviews of controls/ self-assessment |
Establish sufficiently robust quality control and assurance processes to provide assurance to the audit committee on the accuracy and completeness of the financial report. |
|
Competency of staff |
Preparers of the financial report have a good understanding of, and experience in, applying relevant accounting standards and legislation. They should also have project management and interpersonal skills. |
|
Financial compliance reviews |
Undertake periodic compliance reviews to identify areas of noncompliance or changes to legislation that impact the financial report. |
|
Adequate security |
Protect and safeguard sensitive information throughout the process to prevent inappropriate public disclosure. |
Source: Victorian Auditor-General’s Office, and Australian National Audit Office Better Practice Guide Preparation of Financial Statements, June 2009.
Performance indicators assessment
Figure C4 identifies the audit assessment of council performance indicators.
Figure C4
Audit assessment of performance indicators
|
Principles |
Details |
|---|---|
|
Appropriate |
Performance indicators should be reported with appropriate context to allow community members to interpret results. Targets, trend data and an explanation of the result should be provided to allow members of the community without technical knowledge to draw meaningful conclusions about the performance of the council. |
|
Relevant |
To be comprehensive, indicators should be relevant to council objectives. Objectives should be clearly expressed and measurable, and there should be a clear nexus between objectives and performance indicators. Performance indicators should also cover all critical aspects of objectives and align with services. |
|
Balanced |
Performance indicators should cover the time, cost, quantity and quality of service provision, as well as the outcomes of council activity. A single indicator is typically not able to measure each of these aspects, therefore a suite of indicators is usually required to provide balanced performance information. |
|
Fairly represents |
To fairly represent performance, the information provided must be capable of measurement, represent what it purports to indicate, consistently and without bias, and be accurate and auditable. |
|
Auditable |
The data supporting the performance indicators should be quantifiable, consistent and verifiable. The information upon which the indicators are based is collected, recorded and analysed in such a way that the conclusions drawn from it can be verified. |
Source: Victorian Auditor-General’s Office.
Appendix D. Acquittal audits
Figure D1
Acquittal opinions issued in 2012–13
Council |
Acquittal opinion issued* |
|---|---|
COMPLETED ACQUITTALS |
|
Alpine Shire Council |
1 |
Ararat Rural City Council |
1 |
Ballarat City Council |
1 |
Banyule City Council |
1 |
Bass Coast Shire Council |
1 |
Baw Baw Shire Council |
1 |
Benalla Rural City Council |
1 |
Boroondara City Council |
4 |
Borough of Queenscliffe |
3 |
Brimbank City Council |
1 |
Campaspe Shire Council |
1 |
Cardinia Shire Council |
1 |
Central Goldfields Shire Council |
1 |
Colac Otway Shire Council |
1 |
Corangamite Shire Council |
1 |
Darebin City Council |
4 |
East Gippsland Shire Council |
1 |
Frankston City Council |
1 |
Gannawarra Shire Council |
1 |
Glen Eira City Council |
1 |
Glenelg Shire Council |
1 |
Golden Plains Shire Council |
1 |
Greater Bendigo Shire Council |
1 |
Greater Dandenong City Council |
1 |
Greater Geelong City Council |
1 |
Hepburn Shire Council |
1 |
Hindmarsh Shire Council |
1 |
Hobsons Bay City Council |
2 |
Horsham Rural City Council |
1 |
Hume City Council |
2 |
Indigo Shire Council |
1 |
Kingston City Council |
1 |
Knox City Council |
1 |
Latrobe Shire Council |
1 |
Loddon Shire Council |
1 |
Macedon Ranges Shire Council |
1 |
Manningham Shire Council |
1 |
Mansfield Shire Council |
1 |
Maribyrnong City Council |
1 |
Maroondah City Council |
1 |
Melbourne City Council |
1 |
Melton City Council |
1 |
Mildura Rural City Council |
1 |
Mitchell Shire Council |
1 |
Moira Shire Council |
1 |
Monash City Council |
1 |
Moonee Valley City Council |
1 |
Moreland City Council |
2 |
Moorabool Shire Council |
1 |
Mornington Peninsula Shire Council |
2 |
Mount Alexander Shire Council |
1 |
Moyne Shire Council |
1 |
Murrindindi Shire Council |
2 |
Nillumbik Shire Council |
1 |
Pyrenees Shire Council |
1 |
South Gippsland Shire Council |
1 |
Southern Grampians Shire Council |
1 |
Stonnington City Council |
1 |
Strathbogie Shire Council |
1 |
Swan Hill Rural City Council |
1 |
Towong Shire Council |
1 |
Wangaratta Rural City Council |
1 |
Warrnambool City Council |
1 |
Wellington Shire Council |
1 |
West Wimmera City Council |
1 |
Whitehorse City Council |
1 |
Wodonga City Council |
1 |
Wyndham City Council |
2 |
Yarra City Council |
1 |
Yarra Ranges Shire Council |
1 |
Yarriambiack Shire Council |
1 |
Total issued |
85 |
Note: * Includes all
opinions issued since 1 November 2012.
Source: Victorian Auditor-General’s Office.
Appendix E. Financial sustainability assessment, indicators and criteria
Indicators used reflect short- and long-term sustainability, and are measured by:
- underlying result—generate enough revenue to cover operating costs (including the cost of replacing assets reflected in depreciation expense)
- liquidity—have sufficient working capital to meet short-term commitments
- self-financing—generate sufficient operating cash flows to invest in asset renewal and repay any debt that may have been incurred in the past
- indebtedness—are not overly reliant on debt to fund capital programs
- capital replacement—have been replacing assets at a rate consistent with their consumption
- renewal gap—have been maintaining existing assets at a consistent rate.
Figure E1
Financial sustainability indicators for councils
|
Indicator |
Formula |
Description |
|---|---|---|
|
Underlying result (per cent) |
Adjusted net surplus/ total underlying revenue |
A positive result indicates a surplus. The larger the percentage, the stronger the result. A negative result indicates a deficit. Operating deficits cannot be sustained in the long term. Underlying revenue does not take into account non-cash developer contributions and other one-off (non‑recurring) adjustments. |
|
Liquidity |
Current assets/ current liabilities |
Measures the ability to pay existing liabilities in the next 12 months. A ratio higher than 1:1 means there is more cash and liquid assets than short‑term liabilities. |
|
Self-financing (per cent) |
Net operating cash flows/ underlying revenue |
Measures the ability to replace assets using cash generated by the entity’s operations. The higher the percentage, the more effectively this can be done. |
|
Indebtedness (per cent) |
Non-current liabilities/ own-sourced revenue |
Comparison of non-current liabilities (mainly comprised of borrowings) to own-sourced revenue. The higher the percentage, the less able to cover non‑current liabilities from the revenues the entity generates itself. Own-sourced revenue is used (rather than total revenue) because it does not include capital grants, which are usually tied to specific projects. |
|
Capital replacement |
Capital expenditure/ depreciation |
Comparison of the rate of spending on infrastructure with its depreciation. Ratios higher than 1:1 indicate that spending is faster than the depreciation rate. This is a long-term indicator, as capital expenditure can be deferred in the short‑term if there are insufficient funds available from operations, and borrowing is not an option. |
|
Renewal gap |
Renewal and upgrade expenditure/depreciation |
Comparison of the rate of spending on existing assets through renewing, restoring, and replacing existing assets with depreciation. Ratios higher than 1:1 indicate that spending on existing assets is greater than the depreciation rate. Similar to the investment gap, this is a long‑term indicator, as capital expenditure can be deferred in the short term if there are insufficient funds available from operations, and borrowing is not an option. |
Source: Victorian Auditor-General’s Office.
Figure E2
Risk assessment criteria for financial sustainability indicators
|
Risk |
Underlying result |
Liquidity |
Indebtedness |
Self-financing |
Capital replacement |
Renewal gap |
|---|---|---|---|---|---|---|
|
High |
Negative 10% or less |
Equal to or less than 1.0 |
More than 60% |
Less than 10% |
Equal to or less than 1.0 |
Equal to or less than 0.5 |
|
Insufficient revenue is being generated to fund operations and asset renewal. |
Insufficient current assets to cover liabilities. |
Potentially long-term concern over ability to repay debt levels from own‑source revenue. |
Insufficient cash from operations to fund new assets and asset renewal. |
Spending on capital works has not kept pace with consumption of assets. |
Spending on existing assets has not kept pace with consumption of these assets. |
|
|
Medium |
Negative 10% to zero |
1.0–1.5 |
40–60% |
10–20% |
1.0–1.5 |
0.5–1.0 |
|
A risk of long‑term run‑down to cash reserves and inability to fund asset renewals. |
Need for caution with cash flow, as issues could arise with meeting obligations as they fall due. |
Some concern over the ability to repay debt from own‑source revenue. |
May not be generating sufficient cash from operations to fund new assets. |
May indicate spending on asset renewal is insufficient. |
May indicate insufficient spending on renewal of existing assets. |
|
|
Low |
More than zero |
More than 1.5 |
40% or less |
20% or more |
More than 1.5 |
More than 1.0 |
|
Generating surpluses consistently. |
No immediate issues with repaying short-term liabilities as they fall due. |
No concern over the ability to repay debt from own‑source revenue. |
Generating enough cash from operations to fund assets. |
Low risk of insufficient spending on asset renewal. |
Low risk of insufficient spending on asset base. |
Source: Victorian Auditor-General’s Office.
The overall financial sustainability risk assessment is calculated using the ratings determined for each indicator as shown in Figure E3.
Figure E3
Overall financial sustainability risk assessment
|
|
High risk of short-term and immediate sustainability concerns indicated by either:
|
|
|
Medium risk of longer-term sustainability concerns indicated by either:
|
|
|
Low risk of financial sustainability concerns—there are no high-risk indicators. |


Source: Victorian Auditor-General’s Office.
A trend analysis uses actual figures for the previous five years and a trend analysis using forecast figures for the following three years. The sustainability indicators are colour coded in line with the risk assessment criteria. The legend in Figure E4 is used in presenting the results of our assessments.
Figure E4
Legend for financial sustainability tables
|
|
An improving trend. |
|
– |
No substantial trend. |
|
|
A deteriorating trend |


Source: Victorian Auditor-General’s Office.
Inner metropolitan councils
Figure E5
Financial sustainability risk assessment results 2012–13
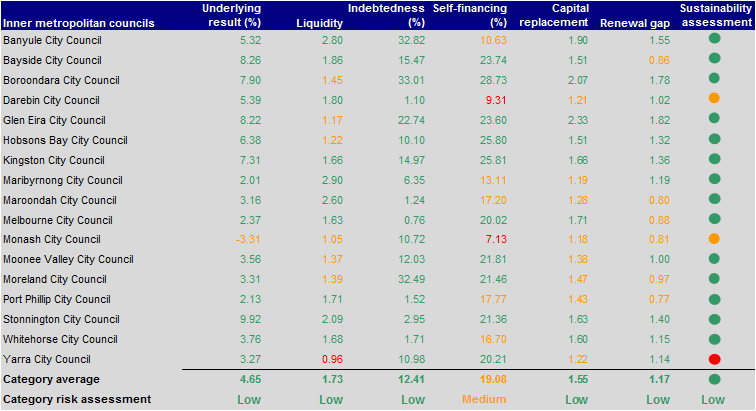
Source: Victorian Auditor-General’s Office.
Figure E6
Underlying result (per cent) 2009–2013
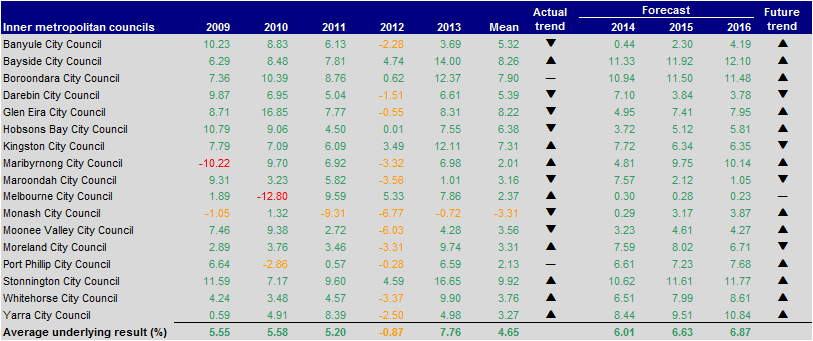
Source: Victorian Auditor-General’s Office.
Figure E7
Liquidity (ratio) 2009–2013
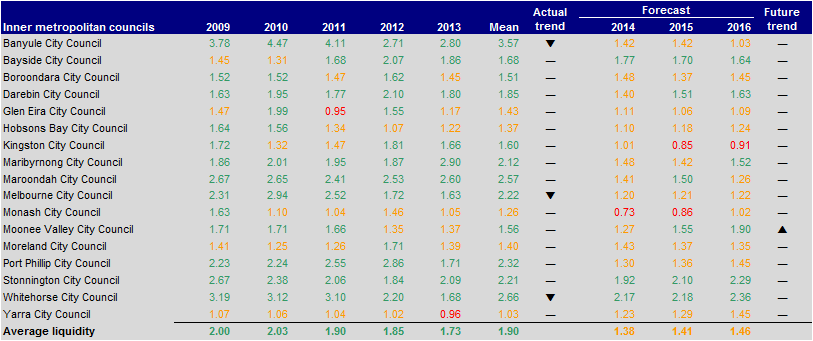
Source: Victorian Auditor-General’s Office.
Figure E8
Indebtedness (per cent) 2009–2013
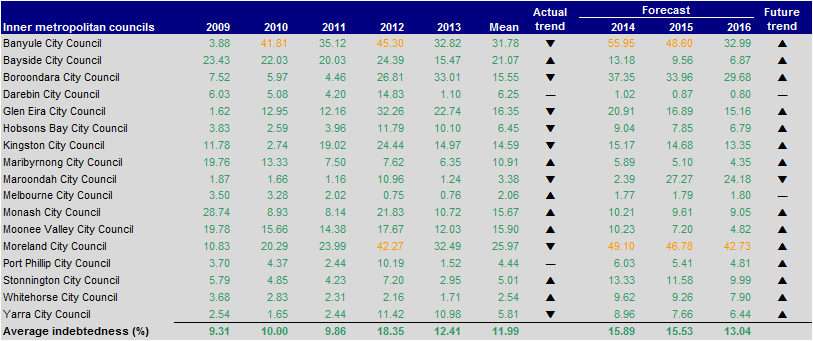
Source: Victorian Auditor-General’s Office.
Figure E9
Self-financing (per cent) 2009–2013
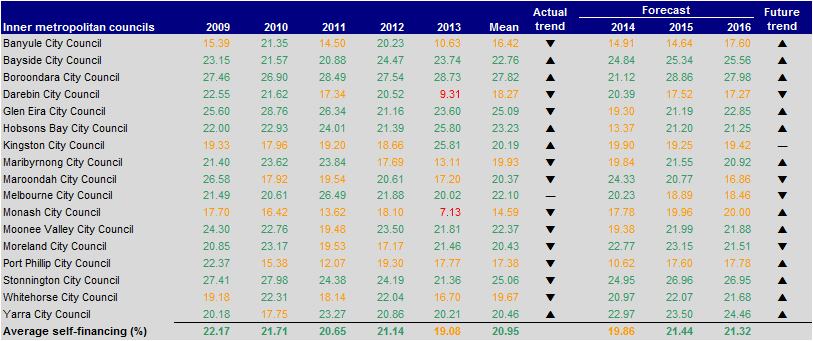
Source: Victorian Auditor-General’s Office.
Figure E10
Capital replacement (ratio) 2009–2013
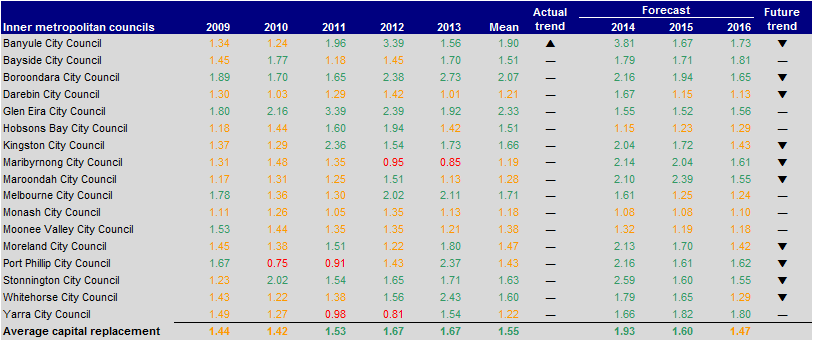
Source: Victorian Auditor-General’s Office.
Figure E11
Renewal gap (ratio) 2009–2013
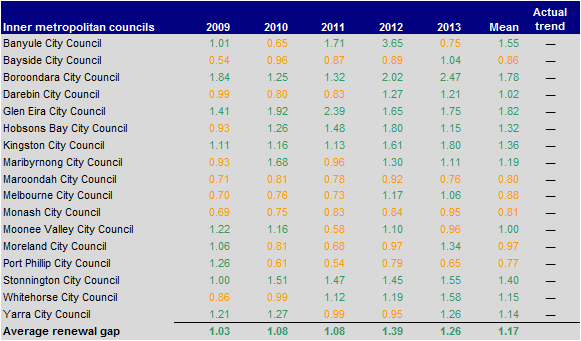
Source: Victorian Auditor-General’s Office.
Outer metropolitan councils
Figure E12
Financial sustainability risk assessment results 2012–13
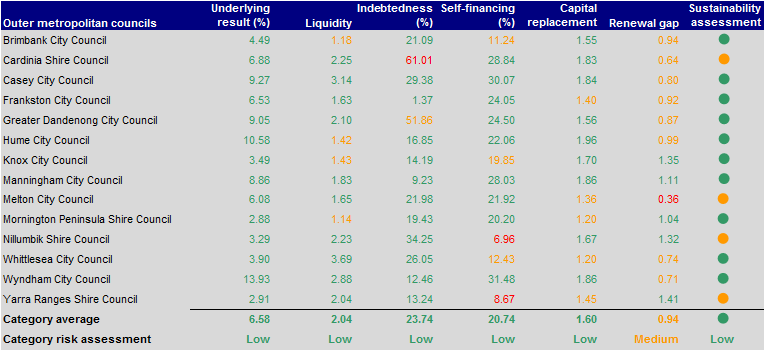
Source: Victorian Auditor-General’s Office.
Figure E13
Underlying result (per cent) 2009–2013
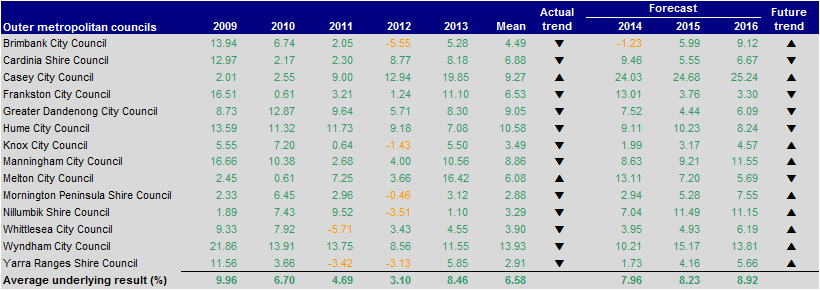
Source: Victorian Auditor-General’s Office.
Figure E14
Liquidity (ratio) 2009–2013
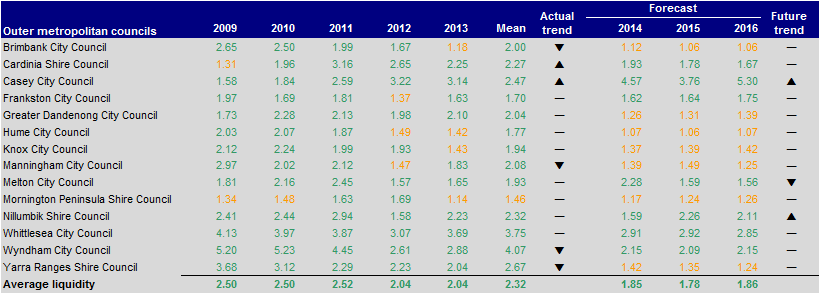
Source: Victorian Auditor-General’s Office.
Figure E15
Indebtedness (per cent) 2009–2013
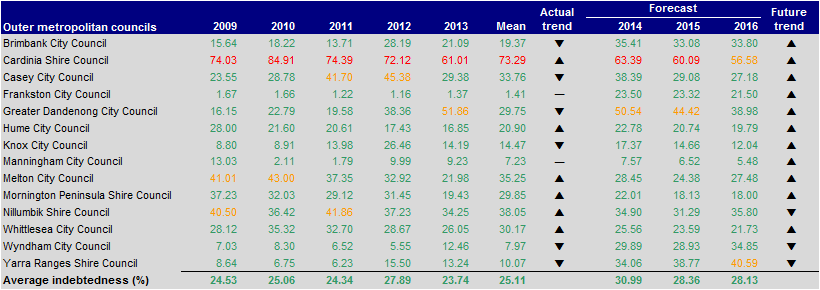
Source: Victorian Auditor-General’s Office.
Figure E16
Self-financing (per cent) 2009–2013
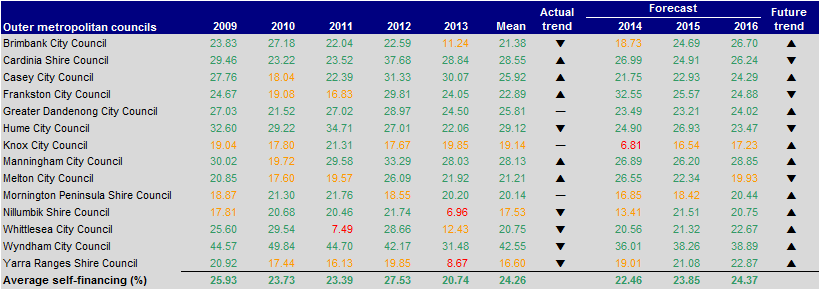
Source: Victorian Auditor-General’s Office.
Figure E17
Capital replacement (ratio) 2009–2013
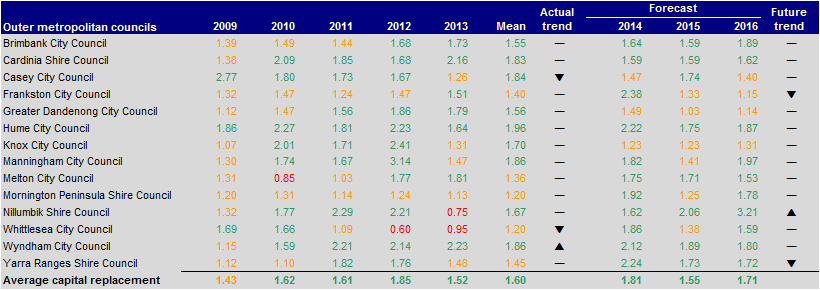
Source: Victorian Auditor-General’s Office.
Figure E18
Renewal gap (ratio) 2009–2013
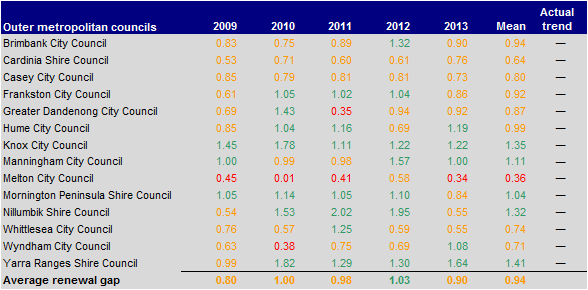
Source: Victorian Auditor-General’s Office.
Regional city councils
Figure E19
Financial sustainability risk assessment results 2012–13
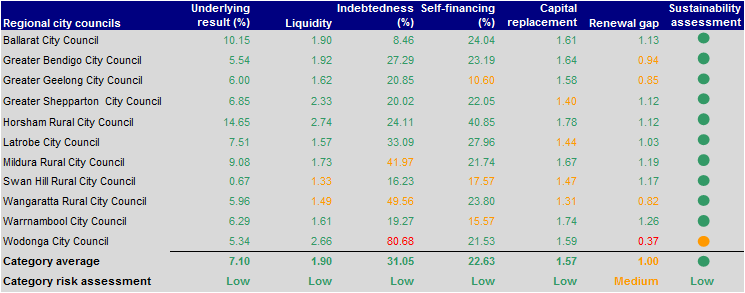
Source: Victorian Auditor-General’s Office.
Figure E20
Underlying result (per cent) 2009–2013
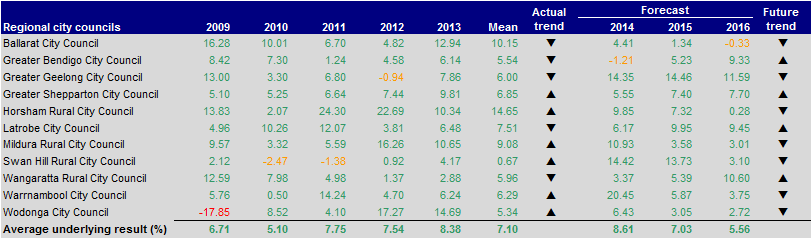
Source: Victorian Auditor-General’s Office.
Figure E21
Liquidity (ratio) 2009–2013
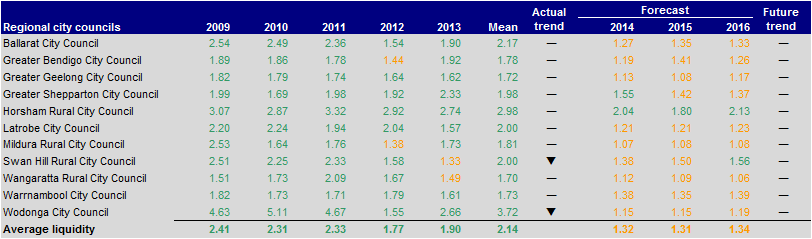
Source: Victorian Auditor-General’s Office.
Figure E22
Indebtedness (per cent) 2009–2013
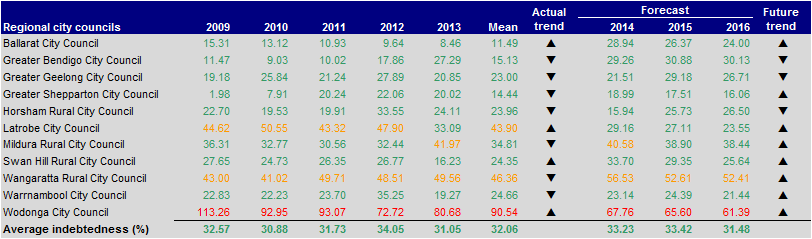
Source: Victorian Auditor-General’s Office.
Figure E23
Self-financing (per cent) 2009–2013
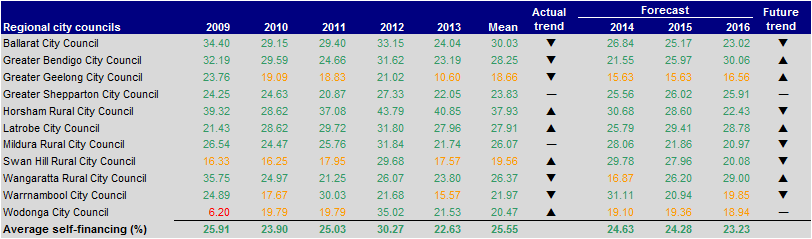
Source: Victorian Auditor-General’s Office.
Figure E24
Capital replacement (ratio) 2009–2013
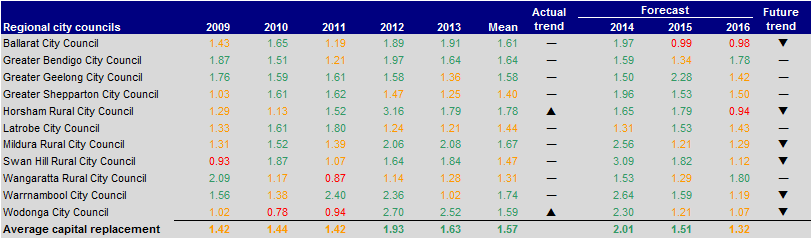
Source: Victorian Auditor-General’s Office.
Figure E25
Renewal gap (ratio) 2009–2013
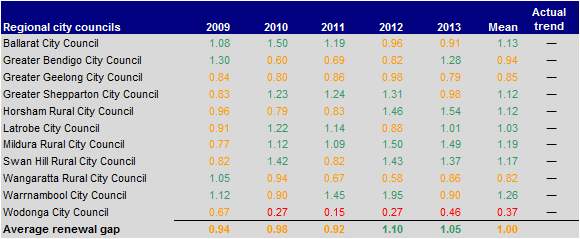
Source: Victorian Auditor-General’s Office.
Large shire councils
Figure E26
Financial sustainability risk assessment results 2012–13
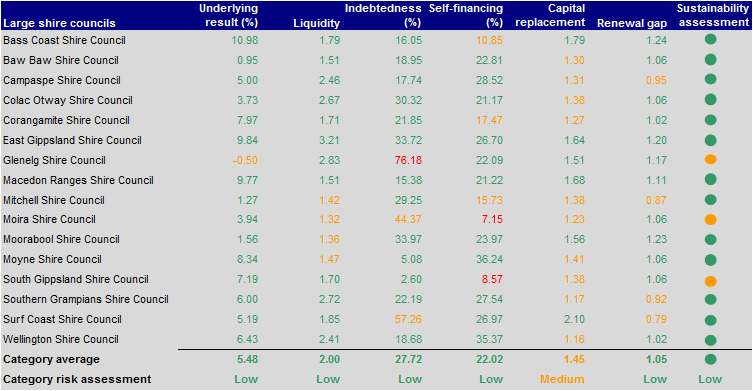
Source: Victorian Auditor-General’s Office.
Figure E27
Underlying result (per cent) 2009–2013
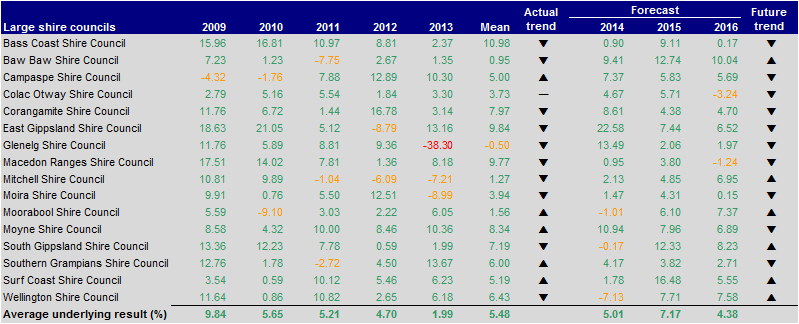
Source: Victorian Auditor-General’s Office.
Figure E28
Liquidity (ratio) 2009–2013
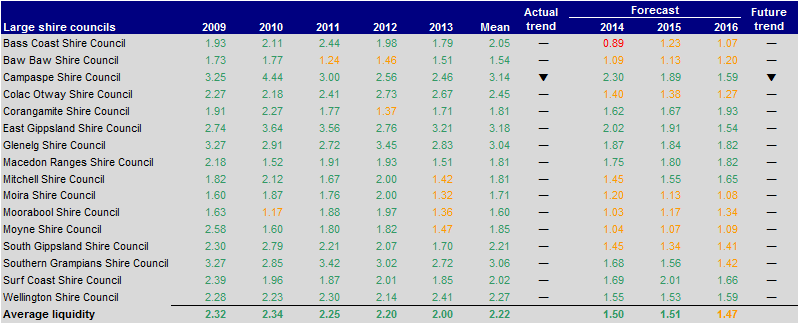
Source: Victorian Auditor-General’s Office.
Figure E29
Indebtedness (per cent) 2009–2013
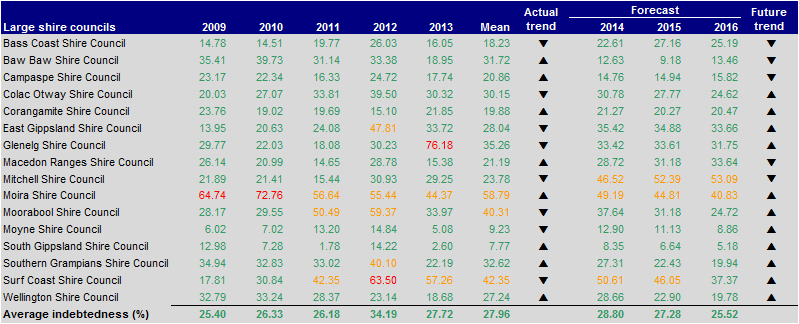
Source: Victorian Auditor-General’s Office.
Figure E30
Self-financing (per cent) 2009–2013
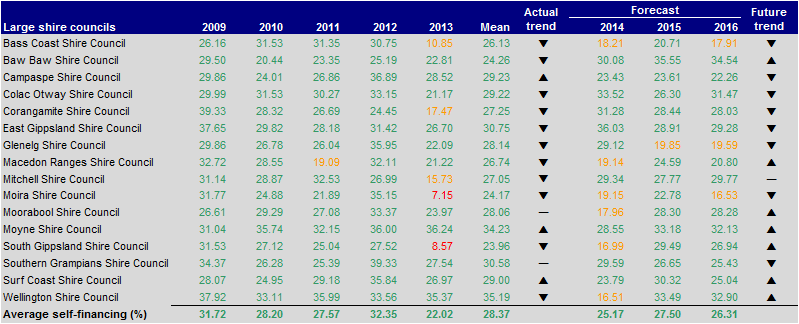
Source: Victorian Auditor-General’s Office.
Figure E31
Capital replacement (ratio) 2009–2013
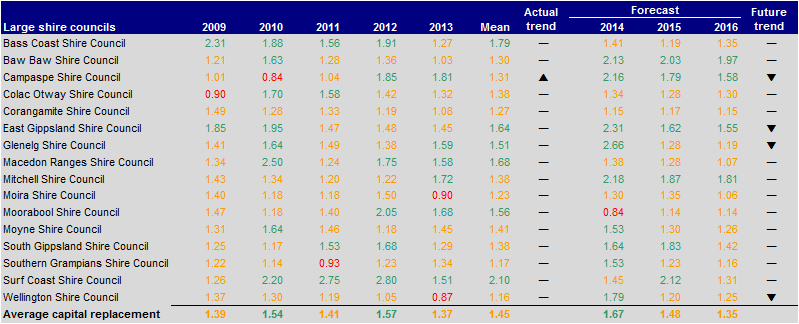
Source: Victorian Auditor-General’s Office.
Figure E32
Renewal gap (ratio) 2009–2013
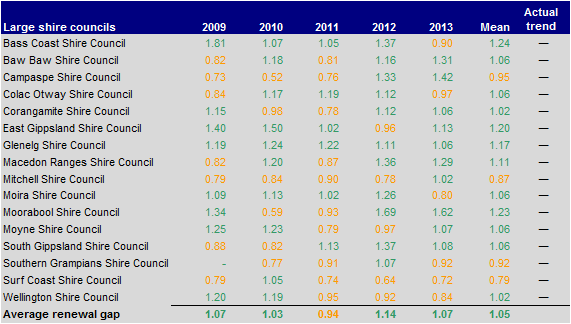
Source: Victorian Auditor-General’s Office.
Small shire councils
Figure E33
Financial sustainability risk assessment results 2012–13
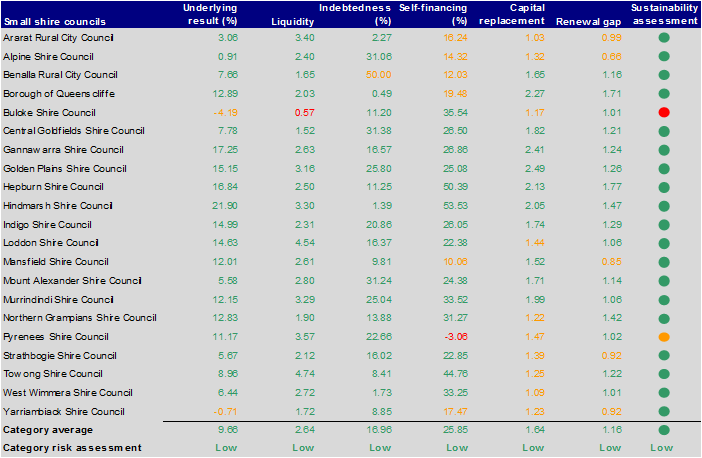
Source: Victorian Auditor-General’s Office.
Figure E34
Underlying result (per cent) 2009–2013
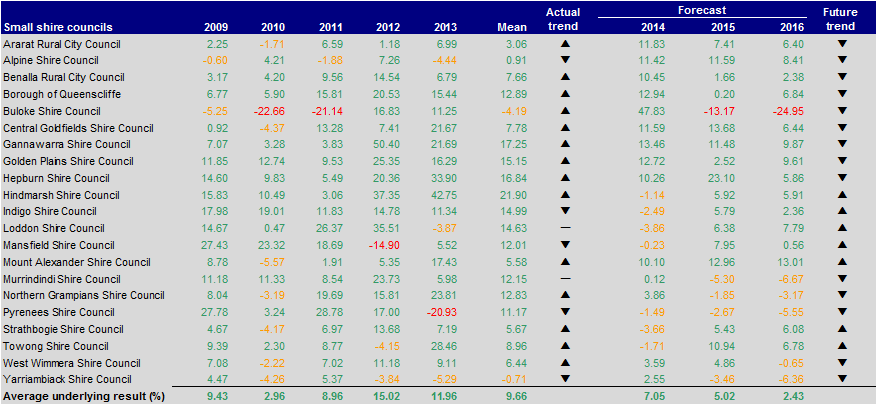
Source: Victorian Auditor-General’s Office.
Figure E35
Liquidity (ratio) 2009–2013
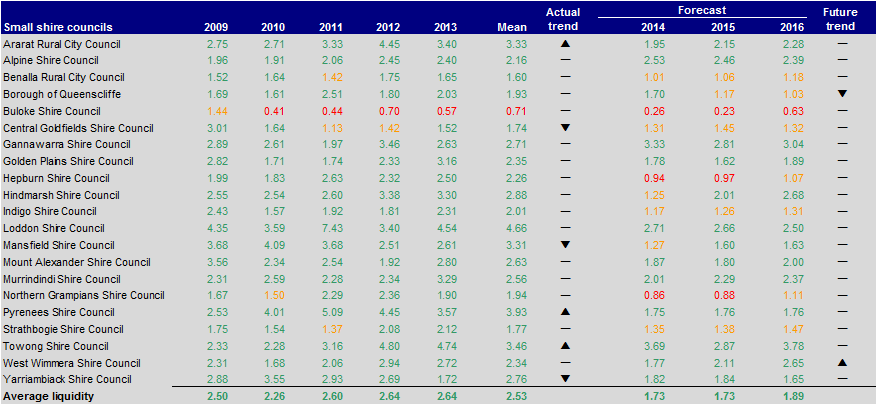
Source: Victorian Auditor-General’s Office.
Figure E36
Indebtedness (per cent) 2009–2013
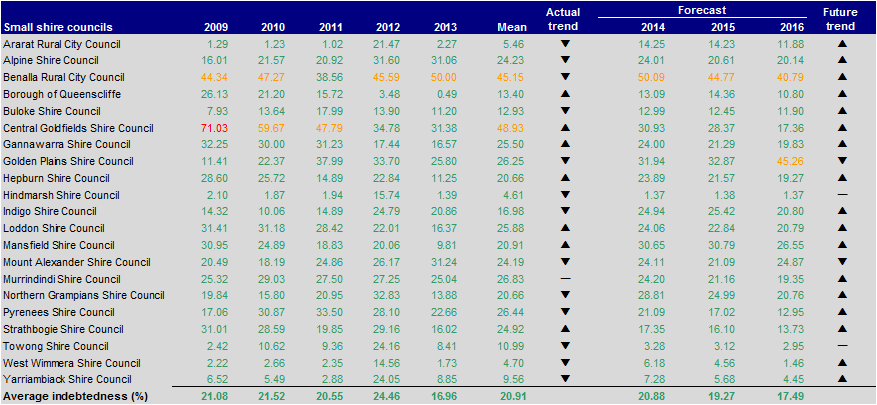
Source: Victorian Auditor-General’s Office.
Figure E37
Self-financing (per cent) 2009–2013
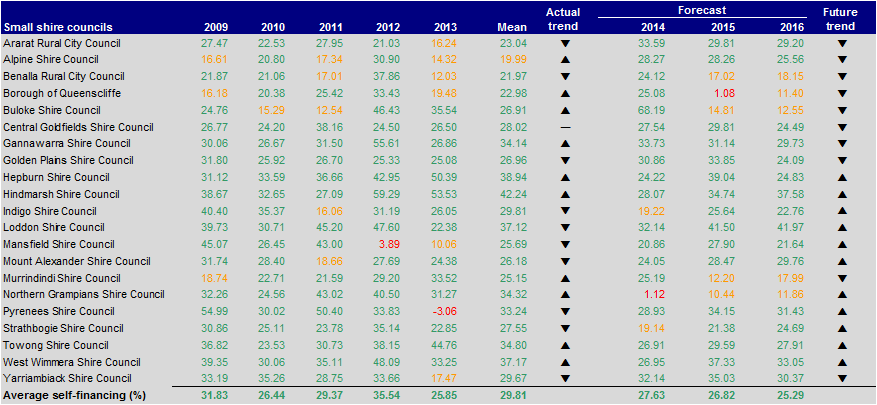
Source: Victorian Auditor-General’s Office.
Figure E38
Capital replacement (ratio) 2009–2013
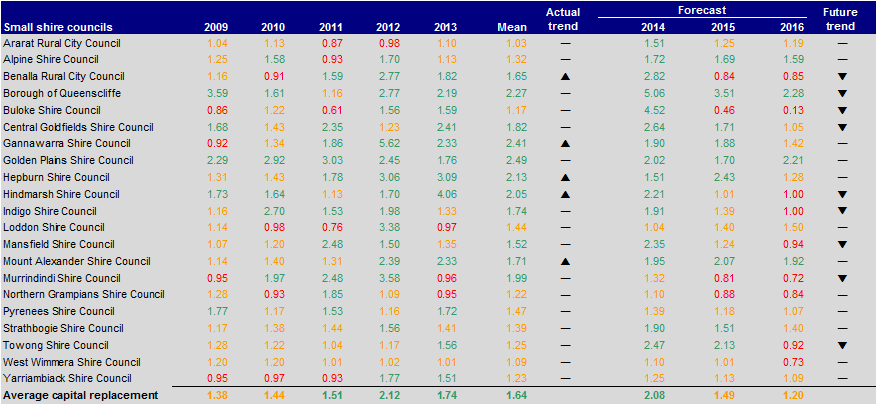
Source: Victorian Auditor-General’s Office.
Figure E39
Renewal gap (ratio) 2009–2013
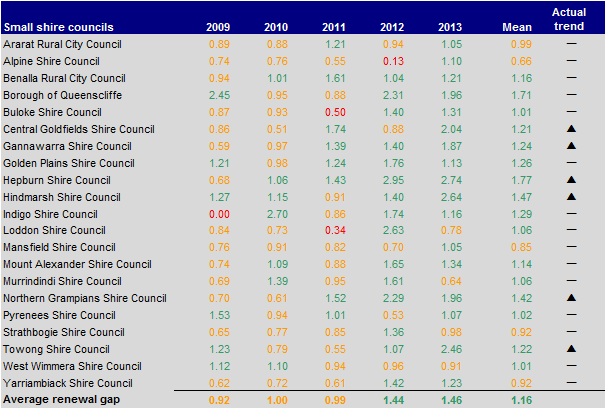
Source: Victorian Auditor-General’s Office.
Appendix F. Glossary
Glossary
Appropriate
Measures or indicators are appropriate if they provide users with sufficient information to assess the extent to which an entity has achieved a pre-determined target, goal or outcome.
Asset
A resource controlled by an entity as a result of past events, and from which future economic benefits are expected to flow to the entity.
Audit Act 1994
An Act of the State of Victoria that establishes the:
- operating powers and responsibilities of the Auditor-General
- the operation of his office - the Victorian Auditor-General's Office (VAGO)
- nature and scope of audits conducted by VAGO
- relationship of the Auditor-General with the Public Accounts and Estimates Committee as the representative body of Parliament
- Auditor-General's accountability to Parliament for discharge of the position's responsibilities.
Audit committee charter
The responsibilities and terms of reference of the audit committee should be clearly defined in its charter, formally approved by the Council and communicated to stakeholders.
Auditor's opinion
Written expression within a specified framework indicating the auditor's overall conclusion on the financial (and performance) reports based on audit evidence obtained.
Clear audit opinion – financial statement
A positive written expression indicating that the financial statement has been prepared in accordance with the requirements of the relevant legislation and Australian accounting standards.
A clear or unqualified audit opinion is provided when the financial statement presents fairly the transactions and balances for the reporting period in accordance with the relevant legislative framework.
Clear audit opinion – financial report
A positive written expression provided when the financial report has been prepared and presents fairly the transactions and balances for the reporting period in accordance with the requirements of the relevant legislation and Australian accounting standards.
Also referred to as an unqualified audit opinion.
Clear audit opinion – performance report
A positive written expression provided when the performance report has been prepared and presents fairly the performance indicators and results of performance for the reporting period in accordance with the requirements of the relevant legislation.
Also referred to as an unqualified audit opinion.
Clear audit opinion – standard statements
A positive written expression provided when the standard statements have been prepared for the reporting period in accordance with the requirements of the relevant legislation.
Also referred to as an unqualified audit opinion.
Corporations Act 2001
An Act of the Commonwealth of Australia that sets out the laws dealing with business entities in Australia at federal and interstate levels. It focuses primarily on companies, although it also covers some laws relating to other entities such as partnerships and managed investment schemes.
Council
A group of councillors, who are the elected representatives of people who are residents in the council's district or ratepayers of the council.
Deficit
Total expenditure exceeds total revenue resulting in a loss.
Depreciation
The systematic allocation of a fixed asset's capital value as an expense over its expected useful life to take account of normal usage, obsolescence, or the passage of time.
Emphasis of matter
An auditor's report can include an emphasis of matter paragraph that draws attention to a disclosure or item in the financial report that is relevant to the users of the auditor's report but is not of such nature that it affects the auditor's opinion (i.e. the auditor's opinion remains unmodified).
Equity or net assets
Residual interest in the assets of an entity after deduction of its liabilities.
Expense
Outflows or other depletions of economic benefits in the form of incurrence of liabilities or depletion of assets of the entity, other than those relating to contributions by owners, that results in a decrease in equity during the reporting period.
Financial report
Structured representation of the financial information, which usually includes accompanying notes, derived from accounting records and intended to communicate an entity's economic resources or obligations at a point in time or the changes therein for a period in accordance with a financial reporting framework.
Financial sustainability
An entity's ability to manage financial resources so it can meet its spending commitments, both at present and into the future.
Financial year
The period of 12 months for which a financial report (and performance report) is prepared.
General purpose financial statements
Statements that provide information about the financial position, performance and changes in financial position of an entity that is useful to a wide range of users.
Going concern
An entity which is expected to be able to pay its debts as and when they fall due, and continue in operation without any intention or necessity to liquidate or otherwise wind up its operations.
Governance
The control arrangements in place at an entity that are used to govern and monitor its activities, in order to achieve its strategic and operational goals.
Internal control
Processes affected by an entity's structure, work and authority flows, people and management information systems, designed to assist the entity accomplish specific goals and objectives. Internal controls are a means by which an entity's resources are directed, monitored and measured. It plays an important role in preventing and detecting error and fraud and protecting the entity's resources.
Joint venture
A contractual agreement joining together two or more parties for the purpose of executing a particular business undertaking. All parties agree to share in the profits and losses of the enterprise.
Liability
A present obligation of the entity arising from past events, the settlement of which is expected to result in an outflow of resources from the entity.
Local Government Act 1989
An Act of the State of Victoria that establishes the:
- purpose of councils
- powers that will enable councils to meet the needs of their communities
- accountable system of local government
- reform of law relating to local government in Victoria.
Performance report
A statement containing predetermined performance indicators and targets and actual results against these for that financial year, with an explanation for any significant variance between the results and the targets.
Qualified audit opinion – financial report
A qualification is issued when the auditor concludes that an unqualified opinion cannot be expressed due to one of the following reasons:
- disagreement with those charged with governance
- conflict between applicable financial reporting frameworks
- limitation of scope.
A qualified opinion shall be expressed as being except for the effects of the matter to which the qualification relates.
Qualified audit opinion – performance report
A qualification is issued when the auditor concludes that an unqualified opinion cannot be expressed due to the non-compliance with the Local Government Act 1989.
Rating strategy
A document that how and why and how rates are set and determined, as well as procedural and legislative requirements, assistance and payment options.
Relevant
Measures or indicators used by an entity are relevant if they have a logical and consistent relationship to an entity's objectives and are linked to the outcomes to be achieved.
Revaluation
Recognising a reassessment of values for non-current assets at a particular point in time.
Revenue
Inflows of funds or other enhancements or savings in outflows of service potential, or future economic benefits in the form of increases in assets or reductions in liabilities of the entity, other than those relating to contributions by owners which result in an increase in equity during the reporting period.
Risk
The chance of a negative impact on the objectives, outputs or outcomes of the entity.
Standard statements
Specific purpose financial statements that compare actual financial performance reported on in the principle financial statements with budget. Where there are significant variations between actual and budgeted performance the variance is explained.
Surplus
Total revenue exceeds total expenditure resulting in a profit.
Appendix G. Audit Act 1994 section 16—submissions and comments
In accordance with section 16A and 16(3) of the Audit Act 1994 a copy of this report, or relevant extracts from the report, was provided to all councils and the Department of Transport, Planning and Local Infrastructure with a request for submissions or comments.
The submissions and comments provided are not subject to audit nor the evidentiary standards required to reach an audit conclusion. Responsibility for the accuracy, fairness and balance of those comments rests solely with the agency head.
Responses were received as follows:
- Department of Transport, Planning and Local Infrastructure
- Rural City of Wangaratta
- City of Wodonga
- City of Yarra
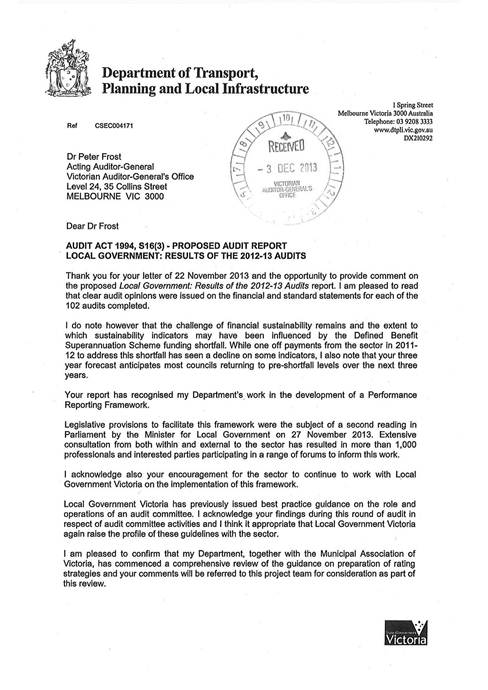
RESPONSE provided by the Acting Chief Executive Officer, Rural City of Wangaratta
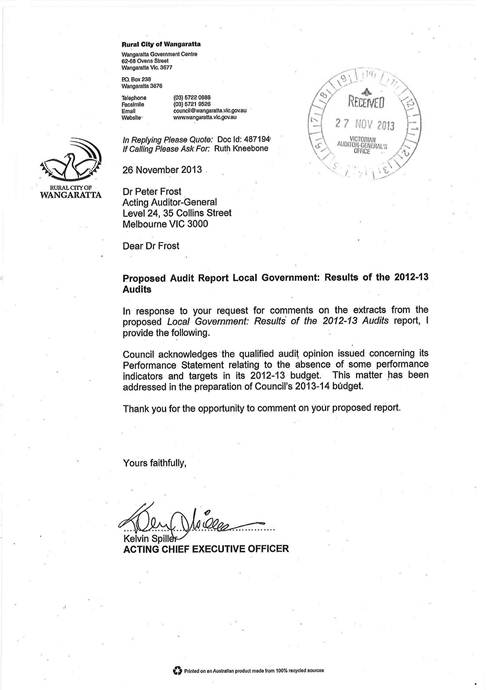
RESPONSE provided by the Chief Executive Officer, City of Wodonga
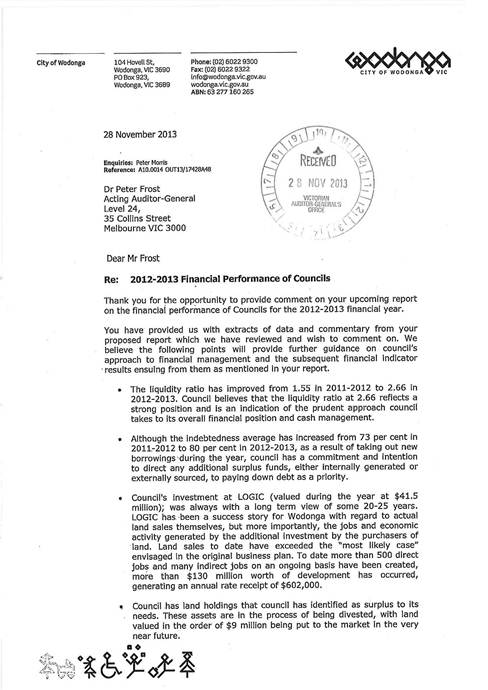
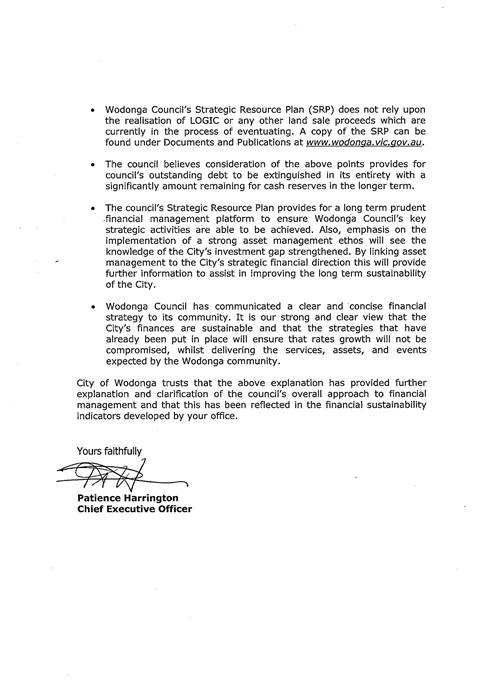
RESPONSE provided by the Chief Executive Officer, City of Yarra