Major Projects Performance Reporting 2022
Snapshot
Does the public sector transparently report the performance of major projects against cost, time, scope, and benefits?
Why this review is important
As of May 2022, Victoria had committed to investing $184 billion in capital projects. This is a net increase of $40 billion from the same time last year.
When the government spends public money on a major project, Parliament and the community deserve a clear explanation of the project’s progress and outcomes.
Who and what we examined
We examined the reporting of major project information by the Department of Treasury and Finance (DTF).
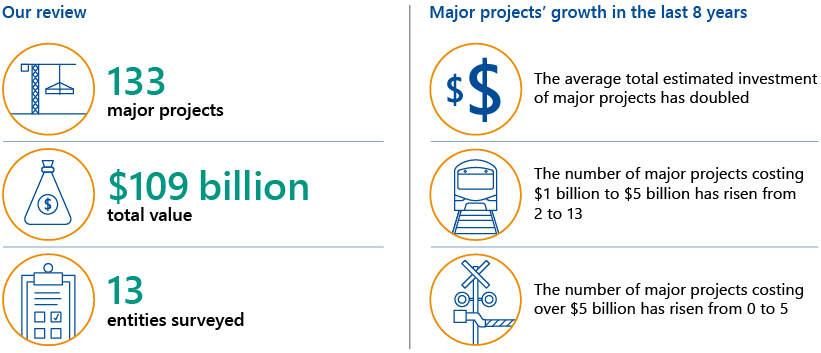
We also looked at the 13 public sector entities that are responsible for 133 major projects.
These projects are expected to cost more than $100 million each.
This is our second annual limited assurance review that reports on major projects’ cost, time, scope and benefits.
What we concluded
DTF and public sector entities do not consistently report on major projects’ performance in a transparent way.
Without this information, Parliament and the community cannot hold responsible entities accountable.
We published a data dashboard with this report. It shows how DTF could help Parliament and the community better understand how entities are managing Victoria's major projects.
What we recommended
We made one recommendation to DTF about making and maintaining a public-facing dashboard that shows how major projects are performing.
Video presentation
Key facts
Source: VAGO, based on Budget Paper 4: State Capital Program.
Recommendation
| We recommend that: | Response | |
|---|---|---|
|
Department of Treasury and Finance |
1. develops and maintains a public-facing major projects performance dashboard, which has similar information and functionality to the Victorian Government IT Dashboard or our Major Projects Performance dashboard, for capital projects worth $100 million or more. The data should include:
|
Accepted in principle |
1. How well the government reports on major projects
In this chapter, we discuss how much the government spends on major projects and how transparently the Department of Treasury and Finance (DTF) and responsible entities report this information to Parliament and the community.
1.1 Government spending on major projects
DTF reports on state capital projects in Budget Paper 4: State Capital Program in (BP4).
In the 2022–23 BP4, DTF reported that the Victorian Government plans to spend $184 billion on capital projects—$40 billion more than last year. This will include $13 billion on new projects and $171 billion on existing projects.
The government spends around 70 per cent of this money on transport projects.
In the last 8 years, the Victorian Government has increased its spending on major projects (worth over $100 million) from $16 billion to $106 billion. At the same time, the number of major projects worth over $1 billion has risen from 2 to 18 (including 5 projects worth over $5 billion).
Public-sector entities are also managing more major projects. In the 2014–15 BP4, there were 37 major projects (not including 6 that were discontinued) and now, in the 2022–23 BP4, there are 129 major projects.
Figure 1A shows the total estimated investment (TEI) and number of new and existing major projects reported in BP4 from 2014–15 to 2022–23.
FIGURE 1A: TEI and number of major projects in BP4 by year
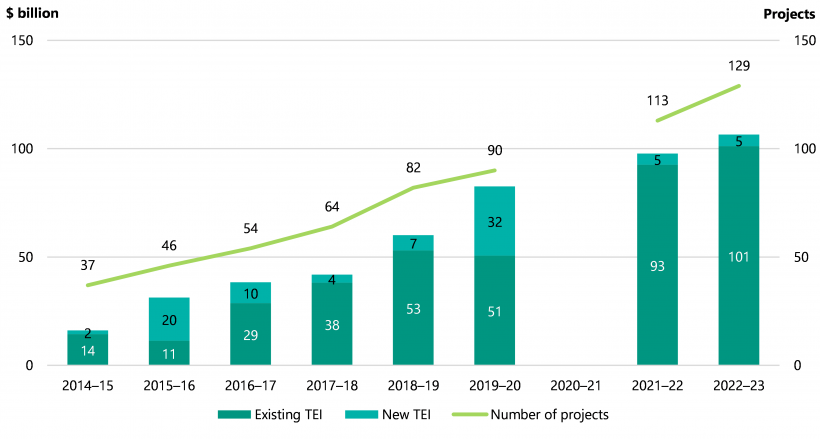
Note: DTF did not publish a BP4 in 2020–21. TEI and number of projects do not include 6 discontinued projects.
Source: VAGO analysis of BP4 from 2014–15 to 2022–23.
Of major projects with a confirmed TEI, the average TEI has doubled in the last 8 years. In 2014–15 the average TEI of a project was $435 million and in 2022–23 (of major projects with a confirmed TEI) it is $880 million.
The number of projects with a TEI of more than $1 billion has grown from 2 in 2014–15 to 18 in 2022–23.
The significant amount the government is investing in major projects means it is more important to thoroughly plan them and reduce the risk of time and cost overruns.
1.2 The need for transparency
A project’s timeframes, cost and (less often) scope can change over its life span, for many reasons (see Appendix D).
When the government spends public money on capital projects, Parliament and the community deserve to understand why. The government should give a clear explanation of:
- why the investment is needed, and how it will benefit Victorians
- what the responsible entity will deliver
- how much the project will cost
- where the project will be located
- when:
- the project will be procured
- construction will commence
- the entity estimates it will be complete
- things change
- who is responsible for delivering the project and who they have contracted to complete the work
- what risks are involved and how the responsible entity will manage them
- if the project delivers its intended benefits.
1.3 Current reporting on major projects
Our 2021 Major Projects Performance report found that DTF and entities’ reporting to Parliament and the community on major projects' performance is not timely, relevant or sufficient.
We summarised the limitations of their performance reporting and explained the limits to the current data systems and assurance processes. These limitations included:
- inconsistencies in how entities present data
- a lack of reporting about expected benefits
- entities not explaining changes.
These issues have continued. As a result, it is difficult for Parliament and the community to understand how each project has evolved over its life span.
Our 2021 report also explained the reporting and oversight roles and responsibilities of:
- Parliament
- the executive government
- DTF
- Office of Projects Victoria (OPV)
- the general government sector
- public non-financial corporations.
Reporting to Cabinet
DTF or the government can classify a project as high value and/or high risk. These projects are subject to more rigorous scrutiny and approval processes than other projects. Not all projects with a TEI of $100 million or more are HVHR.
DTF still gives quarterly major projects performance reports to Cabinet. However, these reports only discuss the status of high value high risk (HVHR) capital projects.
We give more information about DTF's major projects performance reports in https://www.audit.vic.gov.au/report/major-projects-performance.
Public reporting
Entities provide information about major projects in annual reports, departmental responses to the Public Accounts and Estimates Committee's questionnaire and public websites.
DTF also publishes BP4 to explain new capital investments, and to report on progress and spending on existing and completed projects.
As we noted last year, DTF has a single footnote for each project in BP4 that describes changes to a project’s TEI, timeline and cashflow since the previous year. If BP4 included separate fields for TEI change, scope change and completion date, users could sort the information to suit their needs.
The entity responsible for each project gives DTF information for the footnote. DTF reviews all information provided and, where possible, verifies the information provided.
In BP4, DTF explains that it does not report some time and cost information when:
- a project is in the planning or procurement stages (where revealing costs may affect the potential pricing of tenders or commercial arrangements)
- it has not yet considered the funding for future works packages
- cost estimates are preliminary and require final consideration before confirming.
TEI changes
In the 2022–23 BP4, we found 7 instances where the footnote did not explain a major project's TEI change between 2021–22 and 2022–23. The information was either:
- referring to a TEI change from the previous year, or
- incorrect.
DTF told us that it will check this information in next year's BP4.
Scope changes
Scope changes are provided in each project's BP4 footnote.
In the 2022–23 BP4, we found 15 footnotes that said a major project has had a scope change. However, BP4 did not provide the details of the scope changes.
Movements in the state's capital program
DTF has a section in BP4 that explains movements in the state's capital program.
In the 2022–23 BP4, DTF said:
'The 2022–23 State capital program includes 787 projects that are budget funded and have been classed as either existing or completed projects since they were last reported in the 2021–22 Budget.'
However, DTF did not define what a 'budget-funded' project is or explain which projects in the 2022–23 BP4 were not budget-funded.
DTF told us 'budget-funded' projects exclude Public Non-financial Corporation projects that are not initiated by a government spending decision (for example, water authority projects).
DTF also told us which 14 projects are 'non budget funded' in 2022–23.
We included 2 of these projects (‘Carlton Redevelopment—246 units/sites’ and ‘Heidelberg Redevelopment—600 units/sites’) in our survey because they cost more than $100 million.
Understanding project changes and delays
DTF gives a static report on each project in BP4. But this does not show the project’s changes and progress over time.
To understand why a project has changed or had delays, Parliament and the community still need to combine and cross reference information from BP4 and each responsible entity's strategic plans and annual reports.
This is a task that takes substantial time and effort. Further, information in annual reports is often limited to financially complete or practically completed projects (see our 2021 report for more information).
Parliament and the community need easy access to a single report, dataset or dashboard that shows a project’s changes over time.
1.4 Exploring performance data
Our dashboards
In the absence of a central location where users can see information about major projects' performance, we published 2 dashboards in 2021—a dashboard with historical BP4 data and our Major Projects Performance dashboard.
The purpose of the historical BP4 data dashboard was to give Parliament and the community access to information about projects in BP4 over time. We did not publish the BP4 historical data dashboard this year because DTF now publishes a similar product.
We have updated our Major Projects Performance dashboard this year. We analyse data from this dashboard in Chapter 2.
We intend to keep checking and annually reporting on changes in major projects’ TEI, completion dates, scope and red, amber, and green ratings until this information exists in another central location.
DTF’s capital investment dashboard
In our 2021 Major Projects Performance report, we recommended DTF and OPV develop and maintain a public-facing major projects performance dashboard that:
- has at least the same data fields and update frequency as the Victorian Government IT Dashboard
- analyses projects’ scope, cost and time variances against previously reported results
- identifies project delivery entities in addition to the agencies identified in BP4.
In June 2022, DTF published its Capital Investment Dashboard. This dashboard shows BP4 data and some aggregate data that is not available in BP4. Users can:
- download historical data, including project location data
- distinguish new projects from existing and completed projects
- filter projects by agency.
DTF's dashboard is not designed to show all information about a project in the same place. Users cannot see cost or time changes without doing their own analysis and still need to refer to the BP4 footnote for explanations.
DTF's dashboard also does not show each project’s status. If a user wants to know if a project is in the development, procurement, delivery or post-practical completion stage they need to go to another dashboard on OPV’s Major Projects Pipeline website.
The Victorian Government IT dashboard shows what improvements DTF could make to its Capital Investment Dashboard, including:
- updating data quarterly
- disaggregating data by:
- cost
- number of projects
- benefit and project categories
- government domains or agencies
- making it more interactive by allowing users to drill down to see all projects under a particular category
- saying if projects are classed active or inactive
- giving each project:
- a red, amber, or green rating
- comments that explain the ratings
- ratings for the previous 4 quarters
- on each project page, outlining the project’s:
- project management methodology
- stage
- intended benefits
- schedule of key dates
- planned and revised costs at different stages.
DTF told us that it is working on our previous recommendations to improve:
- the integrity and quality of data received from departments
- its capacity to analyse capital project trends by defining and introducing data quality assurance practices.
This will improve DTF’s ability to report historical data so that users can analyse trends and monitor projects' performance.
2. Exploring major project data
We surveyed 13 entities to get information on how 102 major projects (with a TEI of $100 million or more) are performing against their expected cost, timeframes and scope.
This includes 11 new projects, 82 existing projects and 9 completed projects that are collectively worth $99.8 billion.
This chapter explores changes to these projects' cost, time and scope to date.
We collected information on each project’s key documents, such as business cases and benefits management plans.
We also asked if entities had evaluated the 31 projects (collectively worth $8.8 billion) we identified as complete in our review last year.
In total, our survey sample includes 133 major projects worth $108.7 billion.
2.1 Changes in TEI
A project's TEI can go up or down from the first time DTF lists it in BP4 to when it is complete. Reasons may include:
- Materials get more expensive.
- The entity needs to buy more land or spend more money to address the project’s environmental or cultural impact.
- The project gets money in stages through different years’ state Budgets.
- The number of locations increases.
- There are unexpected administrative changes, such as when an entity reclassifies costs as operating expenditure instead of capital.
See Appendix D for more information about the reasons projects change.
As Figure 2A shows, the total TEI of 91 existing and complete major projects in our sample has increased by $11.2 billion, or 12 per cent, since they first appeared in BP4. This includes:
- the total TEI of 42 (or 46 per cent of) projects increasing by $13.6 billion
- the total TEI of 16 (18 per cent of) projects decreasing by $2.4 billion
- the TEI of 33 (or 36 per cent of) existing and complete projects not changing.
This is significantly larger than the TEI variance in our 2021 report when:
- the total TEI of 42 projects increased by $6.0 billion
- the total TEI of 27 projects decreased by $1.0 billion.
FIGURE 2A: The increase in total TEI of 91 existing and complete projects
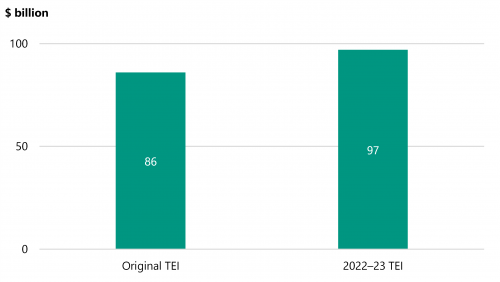
Source: VAGO.
TEI by sector
In our sample, 53 per cent of major projects are in the transport sector. These projects account for 79 per cent of the total TEI of major projects in our sample.
Figure 2B shows that transport major projects have the highest average TEI ($1.6 billion each) and the highest median TEI ($383.8 million each).
Transport projects also have the highest average increase in TEI ($187.3 million) since their original TEI.
FIGURE 2B: Average TEI, median TEI and average TEI variance by sector
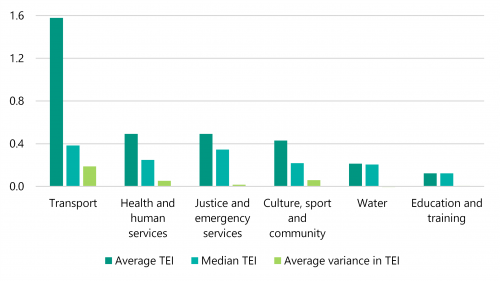
Note: Big projects distort the average TEI of projects. The average TEI of transport projects would be $599.6 million without the top 5 TEI transport projects and the average TEI variance would be $63.6 million. The Melbourne Arts Precinct Transformation project has a TEI of $1.6 billion, which distorts the average TEI of projects in the culture, sport and community sector. Without this project, the average TEI would be $200.3 million and the average increase in TEI would be $38.1 million.
Note: The average variance in TEI for water projects ($-5.6 million) and education and training projects ($4.0 million) are too small to show on the graph.
Source: VAGO.
Why TEI has changed
Of the 102 projects we reviewed:
- 30 had a TEI increase of more than 10 per cent since their original TEI
- 5 had a TEI decrease of more than 10 per cent since their original TEI.
These numbers are not significantly different to last year. In 2021, 34 projects had an increase, and 3 projects had a decrease, of more than 10 per cent since their original TEI.
In some cases, the BP4 footnote does not fully explain why a project’s TEI has changed.
Figure 2C lists the 14 projects that had a TEI increase of more than 50 per cent since their original TEI in BP4 together with the explanation given for this increase.
FIGURE 2C: Projects with a TEI increase of more than 50 per cent
| Agency | Project | Original TEI ($ million) | Current TEI ($ million) | Variance ($ million) | TEI variance | Reason for the variance* |
|---|---|---|---|---|---|---|
| DoT | Car Parks for Commuters | 150.0 | 618.1 | 468.1 | 312% | Increase in the number of car parks delivered |
| MTIA | City Loop fire and safety upgrade (stage 2) and intruder alarm | 132.9 | 468.9 | 336.1 | 253% | Additional funding following project development |
| MTIA | Regional Rail Revival—Warrnambool and Geelong Line Upgrade | 114.0 | 250.2 | 136.2 | 119% | Scope variations and market conditions |
| DJPR | Geelong City Deal—Geelong Convention and Exhibition Centre | 141.2 | 295.7 | 154.5 | 109% | Additional funding to meet forecast capital costs to deliver the convention and exhibition centre |
| MTIA | Western Port Highway | 54.3 | 113.6 | 59.3 | 109% | Received Australian Government funding |
| DH | Building a world class hospital for Frankston families | 562.0 | 1,118.1 | 556.1 | 99% | The project is a public–private partnership, where the upfront capital investment has resulted in additional scope and whole of life benefits while remaining within the project’s affordability benchmark |
| DH | Royal Victorian Eye and Ear Hospital redevelopment | 165.0 | 317.8 | 152.8 | 93% | Incremental additional funds each year since 2016–17. No reasons for variance in the BP4 footnote |
| MTIA | Regional Rail Revival—Bendigo/Echuca Line Upgrade | 91.0 | 175.3 | 84.3 | 93% | Scope variations and market conditions |
| MTIA | Urban Congestion Package—O’Herns Road upgrade | 77.8 | 149.2 | 71.5 | 92% | Incremental additional funds since 2017–18 due to market escalation, increased scope and utility relocation |
| MTIA | Murray Basin Rail Project | 440.0 | 794.4 | 354.4 | 81% | Received Australian Government funding and funds transferred from other rail projects |
| MTIA | Mordialloc Freeway | 300.0 | 519.9 | 219.9 | 73% | Additional scope and market escalation |
| MTIA | Hall Road Upgrade | 169.0 | 282.5 | 113.5 | 67% | No reasons for variance in the BP4 footnote |
| DJCS | Western Plains Correctional Centre | 689.5 | 1,118.5 | 429.1 | 62% | Second stage of planned funding provided in 2021–22 Budget |
|
MTIA |
West Gate Tunnel |
6,344.4 |
10,212.3 |
3,867.9 |
61% |
|
Note: *These reasons are either from DTF’s footnotes in BP4 or our survey of the responsible entities.
Note: DoT stands for the Department of Transport, MTIA stands for the Major Transport Infrastructure Authority, DH stands for the Department of Health, DJPR stands for the Department of Jobs, Precincts and Regions, and DJCS stands for the Department of Justice and Community Safety.
Source: VAGO.
2.2 Changes to estimated completion date
A project’s estimated completion date often changes. Reasons may include:
- There is supply chain disruption.
- There are labour shortages.
- Environmental approvals are required.
See Appendix D for more information about the reasons projects change.
In our sample, the completion date for 41 existing and complete projects, or 40 per cent, has changed compared to when they first appeared in BP4.
Over half of these are projects in the transport sector.
This year, there are fewer projects with time variance than there were last year. In 2021, 53 projects had a time variance since they first appeared in BP4.
Why completion date has changed
In some cases, the BP4 footnote does not fully explain why the estimated completion dates of a project changed.
Figure 2D shows the 24 projects that have had delays of more than a year and the reasons why.
FIGURE 2D: Estimated completion date variance (by quarter variance)
| Agency | Project | Original completion date | Revised completion date | Variance (quarters) | Reason for the variance* |
|---|---|---|---|---|---|
| MTIA | Western Highway duplication—Ballarat to Stawell | Qtr 3 2015–16 | TBC | Over 24 | Works on hold while a new Cultural Heritage Management Plan is prepared The estimated completion date is to be confirmed due to legal challenges |
| DFFH | Carlton Redevelopment—246 units/sites | Qtr 2 2018–19 | Qtr 2 2023–24 | 20 | The construction of social housing apartments was complete in 2014 The project will be complete when the balance of the private apartments are sold |
| MTIA | Murray Basin Rail Project | Qtr 2 2018–19 | Qtr 2 2023–24 | 20 | Alignment with another rail project and Australian Government funding |
| DH | Royal Victorian Eye and Ear Hospital redevelopment | Qtr 2 2017–18 | Qtr 4 2021–22 | 18 | No reasons for variance in the BP4 footnote |
| DoT | More Regional Trains—Regional Network Development Plan | Qtr 3 2018–19 | Qtr 4 2022–23 | 17 | No reasons for variance in the BP4 footnote |
| DoT | New VLocity carriages for the regional network | Qtr 1 2018–19 | Qtr 2 2022–23 | 17 | Revised scope |
| MTIA | City Loop fire and safety upgrade (stage 2) and intruder alarm | Qtr 4 2019–20 | Qtr 2 2023–24 | 14 | The main delivery contractor has been put into administration |
| DJPR | Geelong City Deal—Geelong Convention and Exhibition Centre | Qtr 2 2022–23 | Qtr 4 2025–26 | 14 | Negotiations with the Australian Government |
| MTIA | Cranbourne Line Duplication | Qtr 4 2019–20 | Qtr 1 2023–24 | 13 | No reasons for variance in the BP4 footnote |
|
DH |
Building a world class hospital for Frankston families |
Qtr 4 2024–25 |
Qtr 4 2027–28 |
12 |
|
| MTIA | Suburban Roads Upgrade—Northern Roads Upgrade and South Eastern Roads Upgrade | Qtr 2 2022–23 | Qtr 2 2025–26 | 12 | In line with public commitments |
| MTIA | West Gate Tunnel | Qtr 2 2022–23 | Qtr 2 2025–26 | 12 | No reasons for variance in the BP4 footnote |
| MTIA | Frankston Line stabling | Qtr 3 2019–20 | Qtr 2 2022–23 | 11 | No reasons for variance in the BP4 footnote |
| South East Water Corporation (SEW) | Boneo Water Recycling Plant Stage 4 upgrade | Qtr 2 2020–21 | Qtr 3 2022–23 | 9 | No reasons for variance in the BP4 footnote |
|
MTIA |
Urban Congestion Package—O'Herns Road upgrade |
Qtr 4 2018–19 |
Qtr 1 2021–22 |
9 |
|
| DH | Goulburn Valley Health redevelopment—planning and development | Qtr 4 2020–21 | Qtr 4 2022–23 | 8 | Inclusion of refurbishment and compliance works |
| MTIA | M80 Ring Road upgrade | Qtr 3 2020–21 | Qtr 3 2022–23 | 8 | Procurement timing (dates relate to Sydney Road to Edgars Road section) |
| DoT | New Trams | Qtr 4 2021–22 | Qtr 4 2023–24 | 8 | No reasons for variance in the BP4 footnote |
| MTIA | Regional Rail Revival—Bendigo/Echuca Line Upgrade | Qtr 3 2020–21 | Qtr 2 2022–23 | 7 | Change in scope |
| DH | Ballarat Base Hospital (Ballarat Health Services expansion and redevelopment and the new Central Energy Plant) | Qtr 4 2025–26 | Qtr 2 2027–28 | 6 |
|
| DoT | Car Parks for Commuters | Qtr 4 2022–23 | Qtr 2 2024–25 | 6 | Additional car parks at additional sites |
| State Toll Corporation | North East Link—Primary Package (Tunnels) and State Toll Co | Qtr 4 2026–27 | Qtr 2 2028–29 | 6 | Changes in scope from environmental requirements |
|
DH |
Northern Hospital inpatient expansion stage 2 |
Qtr 4 2020–21 |
Qtr 2 2022–23 |
6 |
|
| DJCS | New youth justice facility | Qtr 4 2020–21 | Qtr 1 2022–23 | 5 | Redesign of facility based on Armytage/ Ogloff (2017) recommendations |
Note: *These reasons are summarised either from DTF’s footnote in BP4 or our survey of the responsible entities. The full survey responses are provided in the major projects performance dashboard.
Note: Qtr stands for quarter, TBC stands for to be confirmed, and DFFH stands for the Department of Families, Fairness and Housing.
Source: VAGO.
2.3 Changes in scope
In our survey, entities reported 40 government-approved scope changes across 28 projects.
Figure 2E shows the number of scope changes by sector. The transport sector has the largest number of attested scope changes.
FIGURE 2E: Number of scope changes by sector
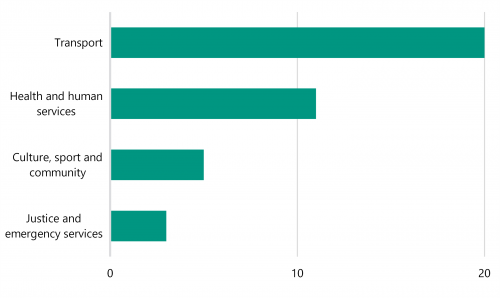
Source: VAGO.
Why scope has changed
As Appendix D explains, a project’s scope can change for many reasons.
For example, the TEI and completion dates for Car Parks for Commuters and the Level Crossing Removal Program have changed because the entity added locations to the project.
Some projects' scope changes are more difficult to explain.
For example, in its survey response, MTIA said the Murray Basin Rail Project scope changed due to 'optimising the capacity and performance of the current 2019 network'.
In the BP4 footnotes over the life of the project, DTF reported:
- the completion date was revised due to the delivery of the project aligning with the Ballarat Line Upgrade
- the completion date was revised following Australian Government funding
- funding was received from GrainCorp and reallocated from other projects.
However, DTF does not clearly explain why:
- the TEI of the project has almost doubled
- the agency has not delivered the project yet (its original completion date was 5 years ago).
DH’s Building a world class hospital for Frankston families project is another example. This project’s TEI has doubled from $562 million in the 2021–22 BP4 to $1.1 billion in the 2022–23 BP4.
The BP4 footnote does not explain what the additional investment will deliver. It only says:
‘This project is a PPP [public–private partnership] where the upfront capital investment has resulted in additional scope and whole of life benefits while remaining within the project's affordability benchmark. The estimated completion date has been revised to 2025–26 to reflect the completion date of the new hospital tower by the end of 2025, with the redevelopment operational in early 2026 and remaining refurbishment and other works completed by 2027–28’.
Other examples of DTF not clearly explaining scope changes in BP4 are:
|
The … |
The BP4 footnote says … |
|---|---|
|
Building a Better Hospital for Melbourne's Inner West |
‘The TEI component of the total project cost has increased by $503.605 million. This project is a PPP [public–private partnership] where the upfront capital investment has resulted in additional scope and whole of life benefits while remaining within the project’s affordability benchmark. The increased TEI also reflects the inclusion of the Victoria University project components which are to be reimbursed by Victoria University’. |
|
City Loop Fire and Safety Upgrade |
‘The TEI has increased by $317.199 million due to project scope changes and market conditions’. |
|
High Capacity Metro Trains |
‘The TEI has increased by $5.000 million due to project scope changes’. |
|
Men's Prison system capacity |
‘The TEI has decreased by $8.990 million due to a revised project scope’. |
|
Royal Victorian Eye and Ear Hospital redevelopment |
‘The TEI has increased by $11.100 million due to scope increases and market conditions’. |
Scope changes may be difficult to summarise in a footnote, but Parliament and the community deserve that information when millions of dollars are spent.
TEI absorbing scope changes
Entities sometimes change a project’s scope to complete it within budget.
Entities sometimes include different scope options in project plans. They do this so they can complete a project on time and within budget by not completing all its intended elements.
See our 2022 Melbourne Metro Tunnel Project Phase 2: Main Works report for more information.
In 2022 we audited the progress of the main tunnel and station works in Phase 2 of the Metro Tunnel project against scope, time, and cost.
We found that since at least June 2021, Rail Projects Victoria has consistently forecast an overall project overspend of $311 million on the Metro Tunnel project.
In May 2022 (after DTF published the 2022–23 BP4), the government approved several scope changes and budget reallocations for the project. This brought its TEI back in line with the approved budget.
However, the responsibility for the parts of the projects that were descoped (worth $327 million) now rests with other projects.
2.4 Red, amber and green ratings
We asked the entities we surveyed to assess their projects’ progress against their estimated timeframes, cost, and scope. We asked them to rate their progress using red, amber and green ratings.
Appendix E shows the rating definitions and all entities' self assessments for 2021–22 and 2022–23.
Overall, entities assessed 90 per cent of their major projects as on track for cost, time and scope. At the same time our analysis shows that:
- 41 per cent of projects have had a TEI increase
- 36 per cent have had a completion date increase.
Parliament and the community require information that explains the reasons TEI and completion date change and how entities are managing those changes and risks to keep projects on track.
Figure 2F shows agencies’ combined self assessment ratings for major projects’ time, cost, and scope in 2022.
FIGURE 2F: Agencies' 2022 self-assessment ratings for their projects' cost, time and scope
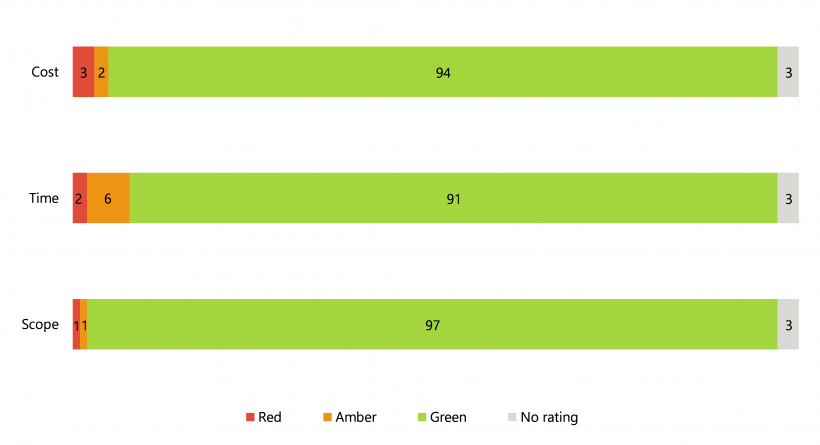
Note: The 3 projects with no self-assessed rating were in the development or procurement phase.
Source: VAGO.
Figure 2G shows all entities with an amber or red rating in 2022–23 and any project that had a change in red, amber and green ratings since 2021–22.
FIGURE 2G: Entity-assessed amber and red ratings and changes from 2021–22 to 2022–23
| 2022–23 entity-assessed rating | 2021–22 entity-assessed rating | ||||||
|---|---|---|---|---|---|---|---|
| Project | Entity | Scope | Cost | Time | Scope | Cost | Time |
| Additional VLocity trains | DoT | ⬤ | ⬤ | ⬤ | ⬤ | ⬤ | ⬤ |
| Boneo Water Recycling Plant Stage 4 upgrade | SEW | ⬤ | ⬤ | ⬤ | ⬤ | ⬤ | ⬤ |
| E-Class Tram Infrastructure Program | DoT | ⬤ | ⬤ | ⬤ | N/A | N/A | N/A |
| Expanding and improving bed-based forensic mental health services: Thomas Embling Hospital | DH | ⬤ | ⬤ | ⬤ | N/A | N/A | N/A |
| Frankston Line stabling | MTIA | ⬤ | ⬤ | ⬤ | ⬤ | ⬤ | ⬤ |
| Geelong City Deal—Geelong Convention and Exhibition Centre | DJPR | ⬤ | ⬤ | ⬤ | ⬤ | ⬤ | ⬤ |
| Heidelberg Redevelopment—600 units/sites (Heidelberg) | DFFH | ⬤ | ⬤ | ⬤ | ⬤ | ⬤ | ⬤ |
| High Capacity Metro Trains | DoT | ⬤ | ⬤ | ⬤ | ⬤ | ⬤ | ⬤ |
| Hurstbridge Line Upgrade Stage 2 | MTIA | ⬤ | ⬤ | ⬤ | ⬤ | ⬤ | ⬤ |
| Keeping Victorians Moving | DoT | ⬤ | ⬤ | ⬤ | ⬤ | ⬤ | ⬤ |
| New Trams | DoT | ⬤ | ⬤ | ⬤ | ⬤ | ⬤ | ⬤ |
| North East Link (State and Freeway Packages) | MTIA | ⬤ | ⬤ | ⬤ | N/A | N/A | N/A |
| Regional Rail Revival—Bendigo/Echuca Line Upgrade | MTIA | ⬤ | ⬤ | ⬤ | N/A | N/A | N/A |
| Regional Rail Revival—Gippsland Line Upgrade Stage 1 | MTIA | ⬤ | ⬤ | ⬤ | ⬤ | ⬤ | ⬤ |
| West Gate Tunnel | MTIA | ⬤ | ⬤ | ⬤ | ⬤ | ⬤ | ⬤ |
| Western Highway duplication—Ballarat to Stawell | MTIA | ⬤ | ⬤ | ⬤ | ⬤ | ⬤ | ⬤ |
Source: VAGO.
Entities also use red, amber and green ratings to self-assess their major projects’ performance for DTF’s quarterly Major Projects Performance report to Cabinet.
This data could also be used to explain the performance of major projects to Parliament and the community.
2.5 Key documents
See our 2022 Quality of Major Transport Infrastructure Project Business Cases report for information about the HVHR Guidelines and DTF's role in monitoring government investments.
DTF's 2019 Investment Lifecycle and High Value High Risk Guidelines (HVHR Guidelines) is a guide to help entities successfully deliver an investment’s intended benefits on time, within budget and with the maximum benefit for Victorians.
The HVHR Guidelines apply to all:
- government departments, corporations, authorities and other bodies under the Financial Management Act 1994
- investment proposals.
The HVHR Guidelines also support the development of business cases, which are mandatory for capital investments with a TEI of $10 million or more (whether they are HVHR or not).
Under the HVHR Guidelines, DTF requires responsible entities to have a business case, an investment logic map, and a benefits management plan for their major projects.
In this section we add 31 projects that entities completed recently to the 102 major projects in BP4 this year.
As Figure 2H shows, 119 major projects (or 89 per cent) of the 133 projects we reviewed, have a business case, 93 (or 70 per cent) have a benefits management plan and 108 (or 81 per cent) have an investment logic map.
FIGURE 2H: Number of major projects with a business case, benefits management plan and investment logic map
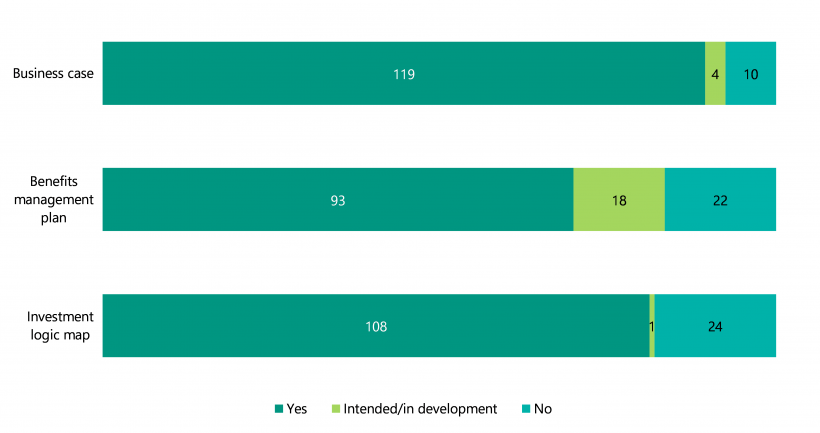
Note: Our survey sample included 31 projects that entities had completed in recent years. The data in this figure includes those 31 projects.
Source: VAGO.
Business cases
A business case is the first stage of the project cycle.
The HVHR Guidelines see business cases as an opportunity for entities to conceptualise and prove that a project is worth doing.
Entities that go ahead with major projects without a business case have not assured government, Parliament and the community that the project is worthy of public funds.
Figure 2I shows the 10 completed projects that did not have a business case and the explanation entities gave us in their survey response.
Only one of these projects (the 85 by 2025 Level Crossing Removal Program) had an investment logic map and a benefits management plan.
The other 9 completed projects had no investment logic map or benefits management plan.
FIGURE 2I: Completed projects without a business case
| Project with no business case | Entity | Entity's explanation |
|---|---|---|
| 85 by 2025 (Level Crossing Removal) | MTIA | 'Addition of value to the LXRP [Level Crossing Removal] Program Business Case consistent with the approach covered in the VAGO follow up audit on Managing the Level Crossing Program (2020).' |
| Additional X’Trapolis Metropolitan Trains | DoT | 'Not applicable as funding was a result of 2018–19 Budget announcement.' |
|
Caulfield to Dandenong conventional signalling and power infrastructure upgrade |
MTIA |
|
| Heidelberg Redevelopment—600 units/sites | DFFH | 'Approval was gained via the review of an options paper with corresponding recommendations which were provided to the Minister and subsequently approved.' |
| More Regional Trains—New VLocity trains | DoT | 'Cabinet decision to procure the VLocity 2017 and 2018 Rolling Stock.' |
| New VLocity carriages for the regional network | DoT | 'Cabinet decision to procure the VLocity Rolling Stock.' |
| Regional Rail Revival—Warrnambool and Geelong Line Upgrade | MTIA | 'Part of the Regional Network Development Plan approved in May 2016 and Regional Rollingstock Procurement Business Case.' |
| Caulfield Rationalisation Works | MTIA | 'Project funded in 2021–22 budget with the Remaining Dandenong Corridor Readiness Works funding submission.' |
| Network Transition Plan—Phase A | MTIA | 'Progressed as a funding submission outside the state budget cycle.' |
| Regional Rail Revival—Bendigo/Echuca Line Upgrade | MTIA | 'It did not have a high enough value to trigger the requirement for a business case.' |
Source: VAGO.
Since last year, the following 7 business cases have been provided to us:
- Big Housing Build
- Melbourne Airport Rail
- More regional trains—Regional Network Development Plan
- Regional Rail Revival—Shepparton Line Upgrade—Stage 3
- Regional Rail Revival—Warrnambool Line Upgrade—Stage 2
- Western Treatment Plant 55E ASP Upgrade
- Yan Yean to Bald Hill Pipeline and Pump Station.
2.6 Evaluating completed major projects
An entity should evaluate a completed major project to determine whether the expected benefits were delivered on time and within budget.
We surveyed entities about 40 completed major projects:
- 9 that DTF listed as complete in the 2022–23 BP4
- 31 that DTF listed as complete in recent years.
Of the 40 completed projects, we could only confirm that 2 had been evaluated. This is because only 2 responsible agencies could show us an evaluation document.
DTF listed the Ballarat Line Upgrade Stage 1 as completed in 2021–22 but MTIA told us this project will be complete in 2022–23. We did not include this project in our analysis of completed major projects.
Gateway reviews
DTF undertakes gateway reviews at 6 key decision points of a project. The 6 reviews, or 'gates' are:
1. concept and feasibility
2. business case
3. readiness for market
4. tender decision
5. readiness for service
6. benefits realisation.
DTF introduced the gateway review process in 2003. DTF requires entities responsible for HVHR projects to do gateway reviews.
Since our 2013 Planning, Delivery and Benefits Realisation of Major Asset Investment: The Gateway Review Process report, we have consistently found poor application of the gateway review process.
In the 2022–23 BP4, DTF list 66 capital projects they will monitor under the HVHR framework.
When a HVHR project is complete, the entity must complete a Gateway 6 review. DTF reports who has done a Gate 6 review to Cabinet. This means the community does not have access to the results.
Of the 39 completed major projects in our sample (excluding Ballarat Line Upgrade Stage 1), DTF classified 24 of them as HVHR. Only 2 of the projects have completed a Gate 6 review so far.
Some of the reasons entities gave us for not doing a Gateway 6 review yet were:
- ‘evaluation will not be undertaken as sufficient budget wasn't allocated to conduct Gate 6’
- ‘awaiting Gateway 5 assessment’
- this project 'is part of an annual Gateway Program review'.
Our survey responses from entities show that:
|
Of the 24 completed HVHR projects … |
Had done … |
|---|---|
|
1 project |
all 6 gateway reviews. |
|
7 projects |
5 gateway reviews. |
|
11 projects |
3 or 4 gateway reviews. |
|
3 projects |
1 or 2 gateway reviews. |
|
2 projects |
no gateway reviews. |
Appendix F shows the completed HVHR projects and the gateway reviews that entities told us they had completed in their survey response.
Appendix A. Submissions and comments
Click the link below to download a PDF copy of Appendix A. Submissions and comments.

Appendix B. Acronyms, abbreviations and glossary
Click the link below to download a PDF copy of Appendix B. Acronyms, abbreviations and glossary.
Click here to download Appendix B. Acronyms, abbreviations and glossary
Appendix C. About this limited assurance review
Click the link below to download a PDF copy of Appendix C. About this assurance review.
Click here to download Appendix C. About this assurance review
Appendix D. Reasons projects change
Click the link below to download a PDF copy of Appendix D. Reasons why projects change.
Click here to download Appendix D. Reasons why projects change
Appendix E. Entities’ self-assessments
Click the link below to download a PDF copy of Appendix E. Entities’ self-assessments.
Click here to download Appendix E. Entities’ self-assessments
Appendix F. Gateway reviews of completed HVHR major projects
Click the link below to download a PDF copy of Appendix F. Gateway reviews of completed HVHR major projects.
Click here to download Appendix F. Gateway reviews of completed HVHR major projects
Appendix G. Data sources used in this review
Click the link below to download a PDF copy of Appendix G. Data sources used in this review.
Click here to download Appendix G. Data sources used in this review