Major Projects Performance
Snapshot
Does public sector reporting of major capital projects contain relevant and sufficient information to enable Parliament to understand project performance against approved scope, cost, time and benefit expectations?
Why this review is important
As at 1 July 2021, Victoria has $144 billion invested in public sector capital works. This includes transport and water infrastructure, hospitals, schools and other community facilities.
Given the size and importance of this investment, Parliament and the community expect to know how projects are performing against their scope, time, cost and benefit expectations.
Who we examined
We examined the Department of Treasury and Finance (DTF), including the Office of Projects Victoria (OPV). We also surveyed 16 entities responsible for 110 major projects.
What we examined
We performed a limited assurance review engagement under section 20 of the Audit Act 1994 and assessed if:
- the major projects data that DTF and OPV collect and report is timely, relevant, sufficient and fairly presented
- DTF and public sector entities' reporting on major projects’ performance to the government and Parliament is clear and objective.
What we concluded
DTF and public sector entities’ reporting to Parliament and the public about major projects performance is not timely, relevant or sufficient.
DTF collects useful project data from entities and provides clear performance reports about some major projects to the government. DTF does not use this data to holistically report on major projects to the Parliament and the public.
Public data on major projects focuses on costs and expected completion dates. It does not usually report on a project’s expected scope and benefits or the impact a performance variance might have on project outcomes.
Our Major Projects Performance dashboard demonstrates how DTF could enable Parliament and the community to better understand how entities are managing Victoria's major projects.
Video presentation
Key facts
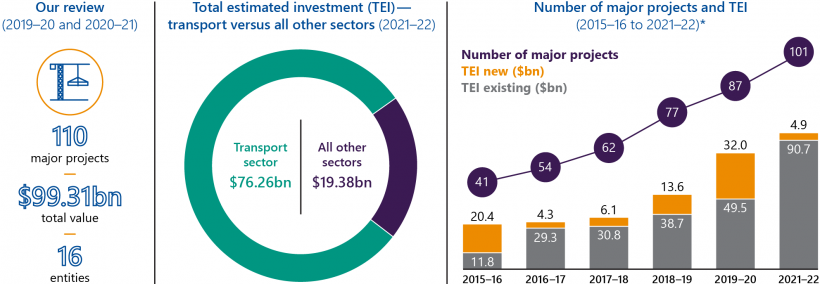
Note: * No major projects data is available for 2020–21 because Budget Paper No. 4: State Capital Program (BP4) was not published in 2020–21.
Source: VAGO; DTF's 2021–22 BP4.
Data dashboards
Major Projects Performance dashboard
This dashboard shows data relating to 110 major projects (with each worth $100 million or more) and shows how they are performing against expected scope, cost and time parameters. It also shows whether a project has a benefits management plan, and whether other key project processes have been followed.
The data for this dashboard was directly collected from 16 entities using a survey. The accuracy and completeness of this the data was formally attested to by the accountable officer (or their delegate) from the entity that filled in the survey.
The 110 projects were selected from the new or existing capital investments disclosed in the 2019–20 Budget Paper No. 4: State Capital Program (BP4) or the 2020–21 Budget Papers. Data in this dashboard is only valid at the attestation date recorded on individual project pages.
The data supporting this dashboard is available for download here or from within the data section of the dashboard.
Click here to view the dashboard full screen
Click here to download the raw data
BP4 historical data dashboard
This dashboard collates information on major projects (>$100 million) disclosed in published from 2014–15 to 2021–22. The BP4 is published at the discretion of the government and is tabled in the Victorian Parliament as part of the State Budget Papers.
This historical data dashboard gives an overview of major projects in Victoria that were reported as new or existing in BP4 from 2014–15 to 2021–22. It also shows information about total estimated investment (TEI) and time changes that have occurred over time.
For the purpose of this dashboard, we define a major project as a capital project or program of works with a TEI of $100 million or more.
Click here to view the dashboard full screen
Click here to download the raw data
What we found and recommend
The BP4 provides an overview of the new investments that general government sector entities and public non-financial corporations will deliver in the coming financial year. It also includes capital programs and projects currently in progress and lists existing projects that are, or are expected to be, completed in the current or coming financial year.
A capital project is practically complete when most or all of the construction of a project is finished. After practical completion, projects move into the financial completion phase which is when an asset may be operational before any disputes, warranties and defects have been resolved with construction contractors. After resolution, a project is financially complete.
Public reporting of major projects performance
DTF and public sector entities' reporting to Parliament and the public about major projects performance is not clear and objective. In particular, there is no easily accessible or timely public reporting that gives a holistic understanding of major projects performance across the public sector.
Budget Paper No. 4: State Capital Program
The only document that supplies public information about the performance of all major projects is the BP4.
DTF advised us that although the BP4 gives some information about capital projects' time and cost targets, they see its main purpose as an estimates document within the context of the wider state budget.
Up until 2018–19, DTF did not publish any data for completed projects, other than the project name, in the BP4. While the 2021–22 BP4 is more detailed than it was four years ago, it does not have enough information to provide Parliament or the public with an adequate understanding of major project performance.
Annual reports
Public sector entities include some project information in their annual reports.
However, entities do not report on this information until after a project is practically complete and also after it is financially complete.
As a result, users of this information can only see how a project performed months or years after a newly built or upgraded asset is finished.
Project performance reporting limitations
In summary, we found that:
|
Public reporting on major projects is limited by … |
because … |
|
data presentation inconsistencies |
DTF and entities inconsistently present project information, such as project names, in the BP4 from year to year. |
|
a lack of clarity about who is responsible for each project |
the BP4 lists a project against the entity that will ultimately 'own' the asset instead of the entity that is delivering it. For example, the Major Transport Infrastructure Authority (MTIA) or the Department of Transport (DoT) are delivering all the major projects that DTF lists against VicTrack. |
|
a lack of information about projects’ performance against their targets |
DTF and entities' reporting focuses on a project’s spending to date and not against budget or key deliverables. |
|
DTF and entities' reporting on completion dates does not highlight the size of any variance between the original and most recent estimated completion date if a change occurs. |
|
|
a lack of timely reporting |
the BP4 is released only once each year and entities’ annual reports only include projects that they have completed by 30 June of the relevant financial year. By the time an entity’s annual report raises historical issues around a project’s schedule or cost, Parliament is left with no time to review its progress and propose corrective actions. |
|
a lack of reporting about expected benefits |
DTF and entities' reporting has no meaningful data on what benefits entities expect their projects will achieve after completion. |
|
a lack of explanation of changes |
DTF and entities' reporting does not include reasons for variations, such as changes to a project’s:
The BP4 includes some variance explanations in footnotes. However, this information:
|
|
data errors |
in our review of the BP4s from 2014–15 to 2021–22 we found:
|
|
lack of sufficient disclosure or explanation of project details |
in our review of the BP4s from 2014–15 to 2021–22 we found:
|
|
a lack of clarity about the type of investments |
it is unclear from information in the BP4 whether an investment is:
|
|
missing major project investments |
the BP4 does not fully disclose:
|
Reporting of major projects performance to the government
In contrast to public sector entities' reporting to Parliament and the public about major projects' performance, DTF and OPV's reporting to the government is timely and sufficient to allow Cabinet ministers to understand how projects are performing.
The Major Projects Performance Report
DTF collates project data that public sector entities upload to a central computer system every quarter. OPV uses this data to produce the Major Projects Performance Report (MPPR) for the Cabinet each quarter. However, this data and documentation is not publicly available.
Before submitting the MPPR to the Cabinet, OPV coordinates and finalises it with DTF and the Department of Premier and Cabinet (DPC). This quarterly reporting gives the government more opportunities to identify a risk or variance to a project and take timely corrective actions.
Information in the MPPR
HVHR projects are identified as high value and/or high risk by DTF or by the government. They are subject to more rigorous scrutiny and approval processes than other projects. HVHR projects undergo extra assurance checks and the full Gateway Review process to increase the likelihood that they will meet their timelines and budgets and deliver intended benefits, unless specifically exempted. Not all projects with a TEI of $100 million or more are designated as HVHR.
The MPPR provides frank information to the government about all High Value High Risk (HVHR) projects that are underway. It contains:
- information on time and cost performance over the last quarter
- known or emerging delivery risks
- an overall status assessment for each project using a red, amber or green 'traffic light' rating. The overall rating is a joint judgement by DPC, DTF and OPV, which is informed by the delivery entity's self-assessment of a project's scope, time and cost performance.
- historical ratings and trends over time
- commentary and analysis that gives more information about the context for major projects, such as size of construction industry contractors' exposure to public sector projects and impact of the coronavirus (COVID-19) pandemic on construction productivity.
Opportunities to improve the MPPR
While the MPPR provides timely and sufficient information about major projects’ performance, we identified some areas for improvement:
- It tracks a project’s overall rating over time, but it does not track material scope changes and monitor the impact they might have on cost, time and expected benefits.
- It shows the costs of some larger capital programs at a highly aggregated level. While it reports on the status of some sub-projects, it does not specifically assess targeted versus actual expenditure for sub-projects or project packages.
- It analyses a project’s cost estimates to date and how much was spent during each project phase. However, there is little focus on what 'earned value' has been achieved to date, or by key project milestones.
- There is a lack of detailed cost variance analysis for sub-projects within large capital programs.
- Its cost analysis does not focus on the materiality of overspending or variances. For example, it does not quantify a variance’s impact on an entity's capital project list, a sector’s overall capital projects portfolio and the wider state budget. Focusing on materiality would mean that a 20 per cent variance for a billion-dollar project should receive more scrutiny and analytical focus than a 20 per cent variance for a $100 million project.
- It provides some information on how many post-delivery benefit assessments are scheduled or have been done by entities. However, it does not summarise any key themes or learnings from them.
- It does not systematically analyse the underlying causes of scope changes and the impact these have on a project’s originally expected benefits.
Earned value is the estimated monetary value of the work done, compared against the amount spent on the work.
Data systems, quality and disclosure
DTF performs limited quality assurance checks of the quarterly project data that entities upload. Its assurance processes primarily focus on procedural sign-offs.
DTF has limited resources to verify data sources, and because entities upload their own data, DTF relies on them to be candid about project issues as they arise. There is also a risk that entities’ data and self-assessment ratings are not free from bias.
State Resource Information Management System
DTF uses the State Resource Information Management System (SRIMS) database to record the state's financial performance data, including capital projects data.
SRIMS was designed 10 years ago to accommodate DTF’s processes at the time. Previous limitations within the SRIMS’s asset management module (known as ASSAM) meant that the system's logged-on sessions could generate a 'time out' interruption for users, who then needed to re-type or re-upload any unsaved data.
To address various system instabilities, DTF turned off SRIMS’s ability to show historical data to users. This means that after an entity uploads and finalises its capital expenditure information, their previous quarter's data in ASSAM is no longer visible.
DTF analysts also lose visibility of the previous quarter’s data, and there is no reporting function to extract and analyse the archived data.
To work around this issue, DTF analysts rely on manual offline methods, such as exporting data to spreadsheets on a regular basis, so they can compare project data between quarters or perform retrospective analysis.
DTF told us that it is working with its technology contractor to move SRIMS to a cloud-based system. This should allow DTF to back up and store historical information in ASSAM. However, DTF also told us that it may not be possible to report this data in a meaningful way because it is difficult to link data in the system archive.
Cloud based systems use a network of remote servers hosted on the internet to store, manage, and process data, rather than a local server or personal computer.
Progress against our previous recommendations about the reporting of project performance
2016 Managing and Reporting on the Performance and Cost of Capital Projects audit
In our 2016 audit Managing and Reporting on the Performance and Cost of Capital Projects, we found that there was:
… limited transparency on the status of major capital projects across the Victorian public sector, which means that Parliament and the public are restricted in their ability to access information on the progress of each project against cost and time targets.
Recommendation
In 2016, we recommended:
That DTF and DPC advise government on how best to establish a public reporting mechanism that provides relevant project status information on capital projects costing $10 million or more, planned and actual costs, timelines, governance arrangements and the extent to which benefits are realised.
At the time of the report, DPC noted the recommendation and DTF accepted it in principle. During this review, we confirmed that DTF briefed the Treasurer on options for a project performance reporting system in August 2018.
Action taken by DTF
DTF offered the Treasurer two options to implement our recommendation, which were:
- a 'basic' reporting tool with limited or no interactivity that would compile data that is already in the public domain
- a 'detailed' option that would replicate the transparency and reporting functionality available in the Victorian Government Information Technology (IT) Dashboard and collect data from entities on a monthly or quarterly basis. DTF noted the difficulty of collecting data and identified a need to build direct links into public entities’ finance systems, which it estimated would cost $800 000 to $1.5 million at the time.
The Treasurer chose the basic option and referred the matter to a Cabinet subcommittee to confirm how it would be implemented. DTF and OPV told us that that this Cabinet process led to OPV publishing the Victorian Major Projects Pipeline on its website in 2020.
We analysed the data in OPV’s pipeline and found that it does not meet the intent of our original recommendation. This is because the pipeline only has 69 of the 101 major capital projects we identified in the current BP4 data and does not provide specific cost and time information.
Apart from the 2021–22 BP4, we are not aware of any other publicly available report or tool that collates data about major public sector (non-IT) projects. We are also not aware of any public document or data source that meets the 'basic' option that DTF recommended to the Treasurer.
Collecting and sharing lessons learnt about major projects
In previous audits, we have noted that entities do not usually collect and share meaningful 'lessons learnt' data about major projects across the public sector. Our previous audits have also noted that the Gateway Review processes' Gate 6 Benefits Realisation reviews have not been conducted as often as the other stages.
DTF undertakes Gateway Reviews at six key decision points of a project. The six reviews, or ‘gates’, are: 1. concept and feasibility 2. business case 3. readiness for market 4. tender decision 5. readiness for service 6. benefits realisation. Gateway Reviews provide confidential advice to senior responsible officers about a project's progress and likelihood of delivery success. All HVHR projects are required to undergo the Gateway Review process.
Since 2017, a Gate 6 review has been a compulsory requirement for all HVHR projects. However, DTF and OPV told us that they do not systematically collate or analyse lessons from these reviews for recurring themes and learnings to inform the broader public sector.
The MPPR does track if entities have performed Gate 6 reviews and Project Assurance Reviews (PARs). However, we did not see evidence that DTF or OPV have collated, analysed or shared project learnings across the public sector. OPV has recently scoped a project to collect lessons and themes from PARs to help address this gap.
Interactive dashboards developed for this review
As part of the work for this review, we developed an interactive dashboard showing historical BP4 data, which collates seven years of published BP4 data from 2014–15 to 2021–22 for major projects worth $100 million or more.
We also created another interactive dashboard that shows various aspects of selected major projects’ performance and analyses sectors and entities’ performance against scope, cost and time parameters. We developed this performance dashboard from a survey we sent to 16 entities with 110 projects worth $100 million or more in 2019–20 and 2020–21.
Chapter 2 provides more information about these dashboards. It also discusses our key observations from the performance dashboard.
Recommendations
| We recommend that: | Response | |
|---|---|---|
|
Department of Treasury and Finance and Office of Projects Victoria |
1. develop and maintain a public-facing major projects performance dashboard that:
|
Partially accepted |
| 2. support implementation of recommendation 1, amend applicable guidance, including the Resource Management Framework (RMF), to collect a more comprehensive dataset from all entities that gives a more holistic view of project performance (see Section 1.3) | Accepted | |
| 3. develop a repository of lessons learnt from major capital projects, including analyses of key themes from Gateway reviews, benefits realisation studies and Project Assurance Reviews, and make this resource available to project teams across the public sector (See What we found and recommend, and Section 1.2) | Accepted | |
|
4. improve the consistency of disclosure of public sector entities' major projects by requiring:
|
Not accepted | |
|
5. improve data quality and their capacity to analyse capital project trends by:
|
Accepted |
1. Context
This chapter provides essential background information about:
1.1 Major projects in Victoria
Major projects deliver important community assets and services and contribute to the state’s economic prosperity.
For this assurance review, we defined a major project as any project:
- with a TEI of $100 million or more
- that has been announced, in progress, or completed from 2014–15 to 2020–21.
We excluded IT projects from this review because we have examined and reported on these types of projects in detail over the last decade. DPC also publishes and maintains the Victorian Government IT Dashboard and discloses many aspects of these projects’ performance each quarter.
Project disclosures in the state Budget papers
Since 1998 (except for 2020), the Victorian Government has published a BP4 (or equivalent) as part of the state Budget papers.
Different BP4s over the years have included different contextual information and case studies covering topics such as public–private partnerships, the HVHR project assurance model, and in the most recent 2021–22 BP4, an outline of cost and time variances for a selection of major projects.
Infrastructure investment in the 2021–22 BP4
The most recent BP4 shows that $7.10 billion was added to the state's existing public infrastructure investment program in the 2021–22 financial year. As at 1 July 2021, the government has committed a total capital expenditure of $144.24 billion for 1 589 new and existing projects.
As Figure 1A shows, the average government annual infrastructure investment is estimated at $15.45 billion a year between 2015–16 and 2023–24. This is approximately four times more than what it was in the nine years prior to 2015–16, when the average investment was $4.05 billion a year.
FIGURE 1A: Average government infrastructure investment (GII) from 2005–06 to 2024–25
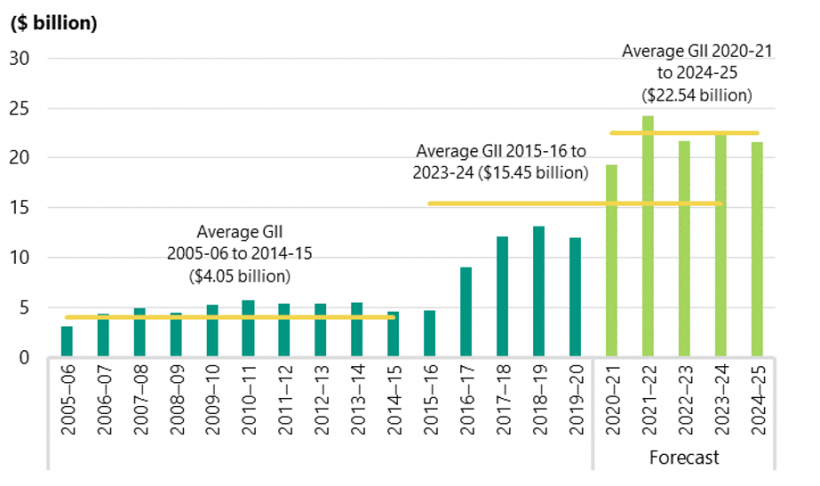
Source: 2021–22 BP4.
Of the 1 589 capital investments announced or in progress in Victoria, 101 of them meet our major project definition. The TEI for these major projects in 2021–22 is $95.64 billion, or 66 per cent of the total capital expenditure allocated in the 2021–22 Budget.
Some of the major projects listed in the BP4 are aggregated. While some appear to be one project, they can contain multiple smaller value projects.
See Appendix E for a list of 59 aggregated projects we identified from the 2019–20 and 2020–21 Budget papers.
Figure 1B shows the TEI of major projects in the 2021–22 state Budget by sector.
FIGURE 1B: TEI of major projects in 2021–22 state Budget by sector
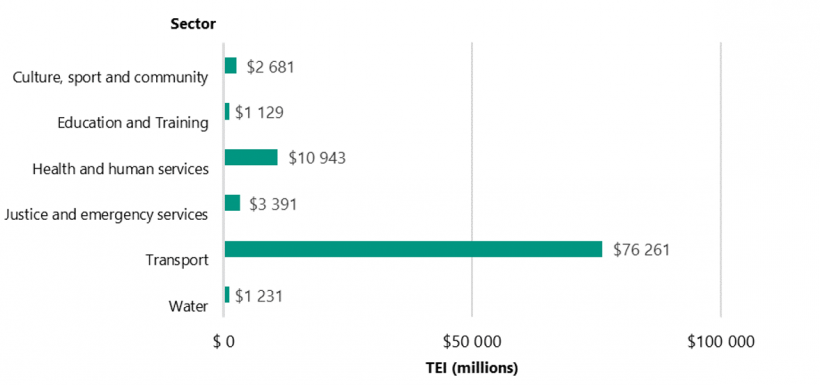
Note: Sector labels align with the Victorian Infrastructure Plan, published in October 2017.
Source: VAGO analysis of the 2021–22 BP4.
1.2 Reporting and oversight roles and responsibilities
This section describes the roles and responsibilities of various public sector bodies in overseeing and reporting on major project performance.
Parliament and the executive government
The Victorian Constitution and other key legislation, such as the Financial Management Act 1994, define the executive government's spending powers. They also describe the roles of Parliament, the Auditor-General and the Governor to authorise, check and formalise public sector spending respectively.
The executive government is the government of the day. It is made up of the Premier, ministers and the Governor.
Authorising spending
Under the Constitution, Parliament authorises public sector spending. The executive government confirms this spending through its budget processes. It formalises this by submitting annual appropriation bills to Parliament for voting and approval.
Figure 1C shows Parliament and the executive government’s process for authorising capital spending.
FIGURE 1C: Process for authorising capital spending

Source: VAGO based on information from DTF’s RMF.
Reviewing spending and performance
In addition to authorising spending, Parliament and its committees, particularly the Public Accounts and Estimates Committee (PAEC), have a key role in reviewing the performance of budget items, including capital investments.
PAEC can examine ministers and public sector officials at budget estimates hearings and seek data from entities. In the past, PAEC has specifically focused on major projects and their performance, including a substantive report it published in 2012 called Inquiry into Effective Decision Making for the Successful Delivery of Significant Infrastructure Projects.
In recent years, other parliamentary committees have taken an interest in major infrastructure projects. For example, the Legislative Council's Economy and Infrastructure Committee published a series of reports on infrastructure projects between 2015 and 2018.
Department of Treasury and Finance
DTF manages Victoria’s budget and finance processes. It also advises the government about economic policy and strategy.
DTF's roles that are relevant to this review include:
- preparing the state budget papers, including the BP4
- giving assurance and advice to the government on the delivery of major capital projects
- advising the government about major transactions and contracts, such as public–private partnerships
- coordinating the Gateway Review process.
Office of Projects Victoria
OPV is an administrative office within DTF. It was established in 2016 to support the effective delivery of major projects and improve the skills and delivery capability of the public sector, industry and the infrastructure workforce.
OPV's roles relevant to this review include:
- preparing a quarterly MPPR for the Cabinet about HVHR projects
- maintaining the Victorian Major Projects Pipeline portal on its website
- conducting PARs for selected projects or programs either before a key decision point or milestone or at the request of the Treasurer, or a department or entity’s responsible minister.
PARs complement Gateway Reviews. They provide advice to the government, responsible department and/or agency and DTF on a project or program's objectives, governance and readiness.
General government sector
General government sector entities make up the bulk of the public sector. Under the government's financial reporting framework, they must report specified cost and time data about all their capital projects to DTF.
For HVHR projects, general government sector entities also report qualitative data to DTF and OPV on emerging delivery risks and conduct self-assessments about their projects' statuses.
Public non-financial corporations
Public non-financial corporations include water corporations, VicTrack and various trusts and bodies in the events, culture, housing and sporting sectors. These entities usually get their funding from selling goods and services.
A public non-financial corporation routinely reports on its capital projects to its relevant minister, portfolio department and DTF.
1.3 DTF and OPV’s authority to collect data
DTF and OPV do not have an explicit legislative mandate to collect and inspect entities' project performance data.
However, they can collect this data if it is specified within the compulsory financial management instructions that DTF issue to entities under ministerial and legislative authority.
DTF and OPV collate entities’ data to report quarterly asset investment to the Cabinet. They also use this information each financial year to draft the BP4 for the Treasurer who then confirms it for tabling in the Parliament.
Resource Management Framework
DTF’s RMF includes mandatory requirements and guidance for entities on a range of financial management topics. It specifically describes the expenditure data that DTF collects from entities about their capital projects.
All Victorian Government departments must follow the RMF as required by the Standing Directions 2018 under the Financial Management Act 1994.
According to the latest version of the RMF (applicable from 1 July 2021) an entity's accountable officer must submit the following information to DTF each quarter for each project that their entity is responsible for:
- asset project name
- funding source
- phasing of quarterly expenditure
- key milestone dates
- any other relevant information, such as the type of work underway.
Under the RMF, the accountable officer must also provide information on:
- any issues relating to the overall progress of specific major asset projects in terms of project delivery and spending
- the progress and delivery of all projects in their entity (as listed in the BP4), as well as any projects being delivered by a department on behalf of its portfolio entities
- the source of money used for the asset investment, including a description of internal and external funding.
Other capital investment reporting requirements
DTF also requires government business enterprises (such as water entities) to provide data on their capital programs and seek the Treasurer's endorsement for capital project business cases.
This requirement is defined by cost thresholds specified in the Corporate Planning and Performance Reporting Requirements: Government Business Enterprises, which DTF published in August 2020.
1.4 Major projects reporting
BP4
The BP4 is the most comprehensive source of publicly available information about the state's overall capital investment program.
The BP4 provides the following information for each project:
- title
- responsible entity
- location
- TEI
- estimated expenditure for the financial year covered by the BP4
- total remaining expenditure
- footnotes about changes to its scope, funding or timing since the previous financial year.
The BP4 also outlines:
- estimated completion dates for projects underway or newly funded
- financial completion dates for projects that have achieved practical completion.
The impact of COVID-19 on the BP4
In 2020, the government did not publish a BP4 due to the impact of the COVID-19 pandemic on public sector entities. The pandemic also delayed the 2020–21 Budget by six months.
In 2020–21, collated public reporting on the state's capital investment program was limited to a single chapter in the 2020–21 Budget Paper No. 2: Strategy and Outlook (BP2). In previous years, the BP4 outlined expenditure for all projects funded by the state. However, the 2020–21 BP2 chapter only gave aggregated cost outcomes for new and existing projects.
The 2021–22 BP4 did not disclose project-specific performance data for any projects funded in the 2020–21 financial year, except for a footnote that stated they were funded in the previous budget year.
Major Projects Performance Report
In addition to the major projects data that is publicly available in the BP4, the Cabinet receives detailed quarterly assessments of HVHR projects through the MPPR.
The MPPR shows entities’ self-assessment ratings and commentary on issues relating to their projects’ costs, time and scopes. The report also covers any emerging risks and the general progress of each project.
Using this information, OPV, DTF and DPC work with delivery entities to determine each project’s overall risk rating using a traffic light system.
Figure 1D shows the assessment guide that OPV, DTF and DPC use to decide a project's overall risk rating.
FIGURE 1D: The MPPR project risk rating assessment legend (December 2021)
| Rating | Definition |
|---|---|
|
Red |
Issues and risks will significantly affect the current approved project scope, timing and/or budget. Further government action may be needed to manage the identified risks. |
|
Amber |
Risks emerging that may affect project delivery. Identified risks and issues are being managed and/or strategies being developed to address these issues without significantly affecting the current approved project scope, timing or budget. Effectiveness of risk mitigation strategies should be closely monitored, but no further government action recommended at this time. |
|
Green |
Project on track for delivery on schedule and within the current approved budget. Identified risks and issues are being managed appropriately, with no further government action recommended at this time. |
Source: OPV and the MPPR.
OPV highlights in the MPPR any projects that are rated as 'red' and gives qualitative details about their progress. If necessary, OPV makes suggestions to the Cabinet on how to mitigate the key issues that are contributing to the red rating.
OPV also uses the HVHR project data that it routinely collects to visualise:
- trends in project risk ratings over time
- the timeliness of entities in confirming and conducting PARs
- the amount of state investment committed to a project compared to a project’s phases
- exposure of key contractors to state projects
- project ratings from different procurement models.
For this review, we adapted the MPPR risk rating model and applied it to the 110 projects we selected for our survey.
Appendix D contains the full list of projects in this review and their self-assessment ratings, using our adapted traffic light rating model.
Public sector entity annual reporting on projects
Entity annual reports supply some information about project time and cost, including variances for capital projects that were completed within the relevant financial year. These annual reports do not give details on any new and existing projects and instead refer to the BP4 for this type of information.
According to DTF's guidance on the expected content of annual reports, for projects worth more than $10 million, entities should report the information shown in Figure 1E.
FIGURE 1E: Project data expected in entities’ annual reports
| Data type | Projects that reached practical completion in the reporting year | Projects that reached financial completion in the reporting year* |
|---|---|---|
|
Original estimated completion date |
✓ |
|
|
Latest approved completion date |
✓ |
|
|
Practical completion date |
✓ |
✓ |
|
Financial estimated completion date |
|
✓ |
|
Explanations for any date changes (showing the root cause/s for each change) |
✓ |
|
|
Original approved TEI |
✓ |
✓ |
|
Latest approved TEI |
✓ |
✓ |
|
Actual total investment |
✓ |
✓ |
|
Variance between the latest approved TEI and the actual cost |
✓ |
✓ |
|
Explanations for changes in total investment (showing the root cause/s for each change) |
✓ |
✓ |
Note: *Projects that reached financial completion after practical completion and after all warranties, defects and liabilities have been finalised.
Source: DTF’s 2020–21 Model Report for Victorian Government Departments.
Annual reports must be tabled in Parliament no later than four months after the end of the financial year. Entities must report any variances (increase or decrease) greater than 5 per cent or more than $50 million for projects that have been reported as practically complete in a previous reporting period.
2. Dashboards and analysis
This chapter discusses:
- Our interactive dashboard showing BP4 data
- Our major projects performance dashboard (2019–20 and 2020–21)
- Material scope changes
- Overall cost (TEI) variances
- Time (estimated completion date) variances
- Business cases, investment logic maps and benefits management plans
- Impact of the COVID-19 on major projects
- Procurement models used by major projects
2.1 Our interactive dashboard showing BP4 data
Given the lack of easily accessible historical information about major projects, we collated publicly available data and developed an interactive dashboard. We published it on our website in April 2021 and refreshed it in July 2021 using data from the most recent 2021–22 state Budget.
The dashboard collates seven years of published BP4 data from 2014–15 to 2021–22 for major projects worth $100 million or more. It does not include data from 2020–21 because there was no BP4 published in that year. Any projects funded in that budget year are included in the 2021–22 dataset.
We sorted and cleansed the BP4 data to account for year-to-year changes in project and entity names. We also removed other reporting inconsistencies to present projects more clearly.
Figure 2A shows the entry page for our searchable and interactive dashboard of historical BP4 data.
FIGURE 2A: Entry screen for our BP4 dashboard
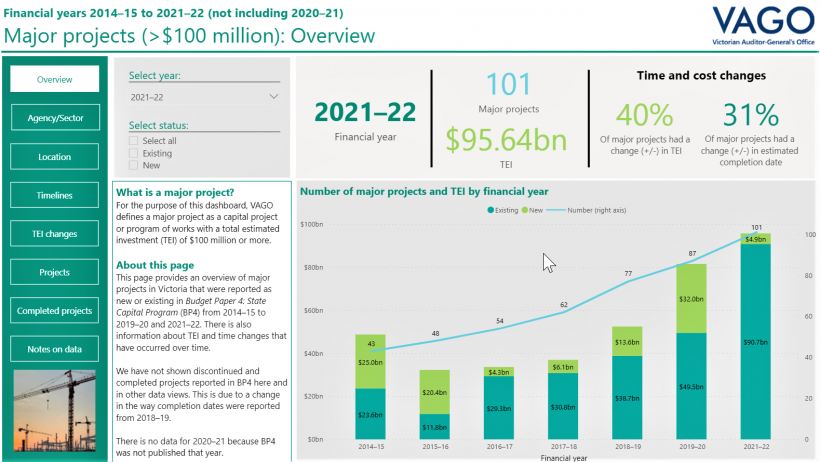
Source: VAGO, published at https://www.audit.vic.gov.au/dashboards/major-projects-performance.
2.2 Our major projects performance dashboard (2019–20 and 2020–21)
Due to the limited amount of project data in the public domain, we could not rely on the BP4 to assess major projects’ actual performance.
To address this gap, we sent a detailed questionnaire about project performance to 16 public sector entities with capital projects worth $100 million or more.
Seven of the 16 entities we surveyed only had one major project. They are listed in Appendix C.
We required an accountable officer such as the Secretary of a Department or their delegate, such as the Chief Financial Officer, to formally attest that the data provided to us within the survey is accurate and approved.
We identified capital projects costing $100 million or more in the 2019–20 BP4 and the 2020–21 Budget Paper No.3: Service Delivery before confirming with entities whether the investments we identified were stand-alone projects or programs of smaller valued projects. Appendix C details how we selected the major projects.
We used the attested survey data to develop an interactive and searchable dashboard. We included 110 major projects that are collectively worth $99.31 billion. All relevant data from the surveys that we used in this review and the projects' performance dashboard is at Appendix G.
The dashboard shows various aspects of performance for the selected major projects. It also presents sectors' and entities’ performance against scope, cost and time parameters. It does not specifically analyse the reasons or causes for time and cost variance.
Figure 2B shows the dashboard's entry page.
FIGURE 2B: Entry screen for our major projects' performance dashboard
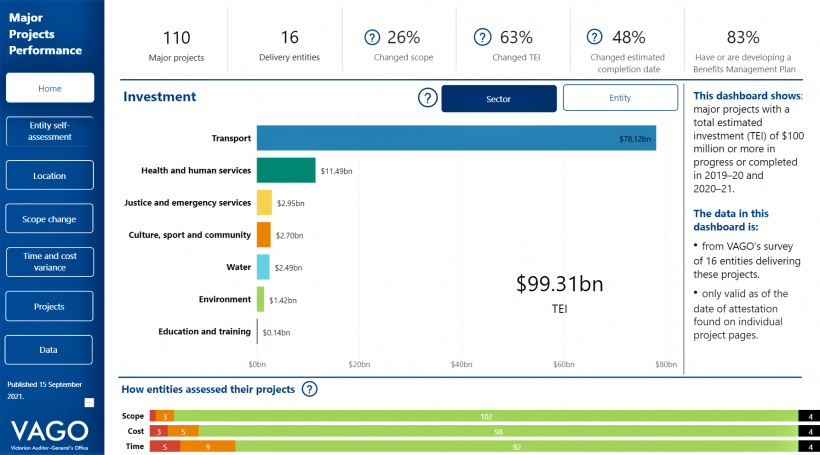
Source: VAGO, published at https://www.audit.vic.gov.au/report/major-projects-performance.
The total value of the projects included in this dashboard is equivalent to 69 per cent of the state's total capital budget, as reported in the 2021–22 BP4.
Figure 2C shows that investment in transport sector major projects ($78.12 billion) is seven times higher than the health and human services sector ($11.49 billion) and 26 times higher than the justice and emergency services sector ($2.95 billion).
FIGURE 2C: TEI and number of the surveyed major projects by sector
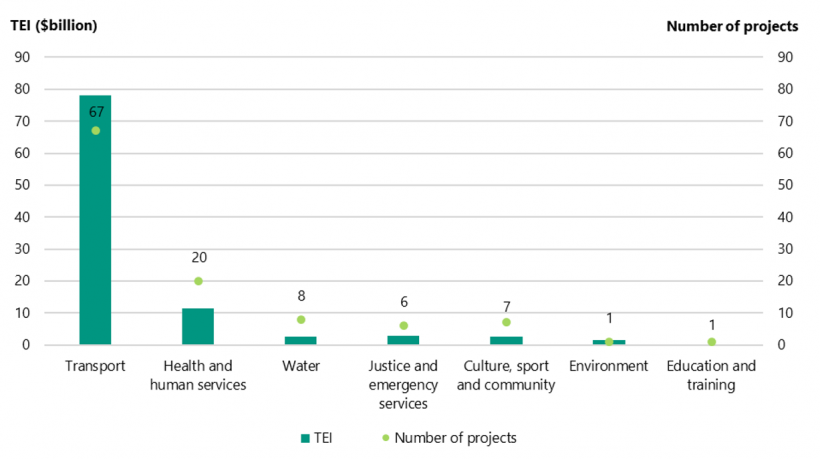
Note: This shows a sector-level overview of the major projects (disclosed in the 2019–20 or 2020–21 Budget papers) that we surveyed.
Source: VAGO.
Overview of major projects performance against scope, cost, time and benefits management plan expectations
We analysed scope, cost, and time changes for the projects we selected for the dashboard, using entities’ responses to our survey. We also assessed which projects had described their expected benefits by developing a Benefits Management Plan. Figure 2D shows an overall snapshot of our findings.
FIGURE 2D: Changes to selected major projects scopes, costs, time and benefits
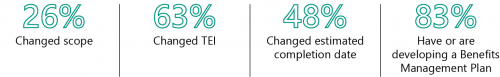
Source: VAGO.
Entities' self-assessments
Our survey requested entities to self-assess their projects’ performance against their scope, time and cost expectations at the time they submitted their data to us.
The assessment criteria we used is similar to the self-assessments that DTF requires in the HVHR process. The full assessment criteria we used is in Appendix D.
Overall, most entities self-assessed their projects as within scope, on budget and on time, which Figure 2E shows. The biggest project challenge faced by entities is time (estimated completion date), followed by cost (TEI). We saw very few concerns about scope in the survey responses.
FIGURE 2E: Agencies’ self-assessment ratings for their projects’ scope, cost and time
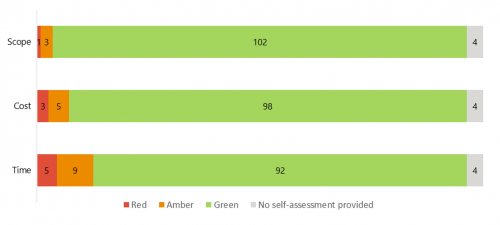
Note: The full rating definitions we used are in Appendix D. The four grey results are for projects where MTIA advised it was unable to provide ratings due to the relevant projects being in the development stage.
Source: VAGO.
Appendix D contains a full list of the projects in our survey and dashboard and the relevant entities’ self-assessment ratings.
2.3 Material scope changes
For this review, a material scope change is a major change to a project's scope, time or cost that requires approval by a minister or the government.
Of the major projects in this review, 29 projects, or 26.4 per cent, have had a material scope change. The total TEI for these 29 projects is $44.83 billion. Based on the survey data, the value of disclosed scope changes is $2.8 billion. We discuss the TEI increases for all projects later in this section.
Our analysis does not include any data on cost or time changes for two of DoT's major projects that reported material scope changes. DoT did not provide information on the impact to time and/or cost for to the following projects:
- Bayside Rail Improvement Project (Frankston – Werribee Line)
- Keeping Victorians Moving (a $174.63 million traffic congestion package).
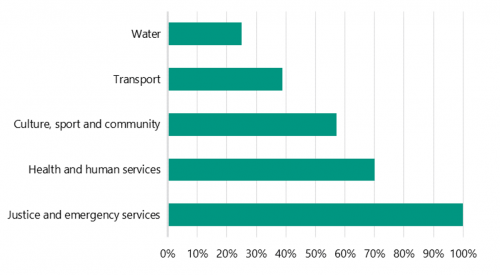
Figure 2F shows the number of material scope changes in each sector.
FIGURE 2F: Number of material scope changes by sector
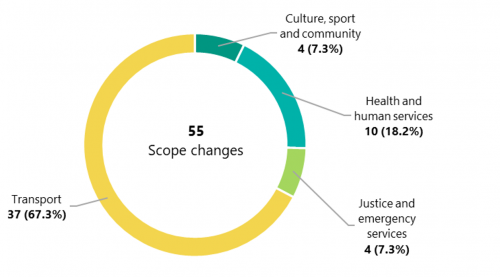
Note: There were no material scope changes for the education and training or environment sectors. Due to a rounding error, percentages do not sum to 100 per cent.
Source: VAGO.
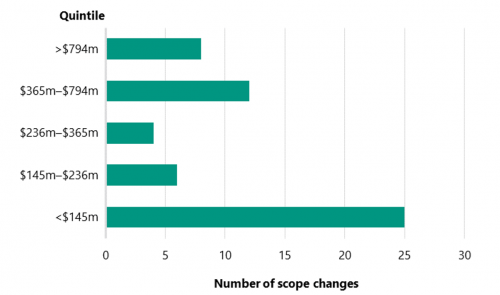
A quintile is one of five values that divides a range of data into five equal parts. Each part is worth 20 per cent of the population.
We also analysed the distribution of scope changes against five project value bands (defined by quintiles of the total number of projects), which is shown in Figure 2G.
The scope changes are mostly concentrated in the two lower value quintiles ($100 million to $236 million) with 31 changes. The two higher value quintiles ($365 million and above) have 20 scope changes.
FIGURE 2G: Number of material scope changes within project value bands
Source: VAGO.
Figure 2H shows the eight projects from the dashboard that had two or more material scope changes impacting their time and/or cost estimates. Only two projects disclosed more than two material scope changes.
FIGURE 2H: Major projects with two or more material scope changes
| Scope changes | Sector | Entity | Project | TEI (millions) | Estimated completion date |
|---|---|---|---|---|---|
| 16 | Transport | DoT | Bayside Rail Improvement Project (Frankston – Werribee Line) | $115.00 | Qtr* 2 2019–20 |
| 7 | Transport | DoT | Flinders Street Station Redevelopment | $100.00 | Qtr 1 2020–21 |
| 2 | Transport | MTIA | North East Link | $15 441.00 | Qtr 4 2026–27 |
| 2 | Transport | MTIA | Metro Tunnel Project | $12 255.14 | Qtr 2 2025–26 |
| 2 | Justice and emergency services | DJCS** | Men’s Prison System Capacity – Prison Infill Expansion Program | $798.19 | Qtr 4 2022–23 |
| 2 | Transport | MTIA | Mernda rail extension project (Mernda) | $575.00 | Qtr 1 2018–19 |
| 2 | Health and human services | DH** | Ballarat Base Hospital Redevelopment | $541.60 | Qtr 2 2027–28 |
| 2 | Culture, sport and community | DJPR** | Melbourne Exhibition Centre Stage 2 Development (Southbank) | $205.00 | Qtr 1 2018–19 |
* Quarter (Qtr)
** Department of Jobs, Precincts and Regions (DJPR), Department of Health (DH), Department of Justice and Community Safety (DJCS).
Source: VAGO.
Figure 2I shows the 11 projects that showed scope changes leading to significant variances to estimated completion dates, and therefore increases in elapsed time.
FIGURE 2I: Projects with time increases due to scope changes
| Sector | Delivery agency | Project | Current estimated completion date | Number of scope changes | TEI (millions) | Time added (quarters) |
|---|---|---|---|---|---|---|
| Transport | DoT | Murray Basin Rail Project | Qtr 2 2023–24 | 1 | $794.41 | 20 (5 yrs*) |
| Health and human services | DH | Joan Kirner Women's & Children's Hospital Sunshine | Qtr 4 2020–21 | 1 | $280.17 | 9 (2 yrs 1 qtr) |
| Transport | DoT | Car Parks for Commuters Program | Qtr 2 2024–25 | 1 | $485.62 | 6 (1 yr 2 qtrs) |
| Transport | DoT | Flinders Street Station Redevelopment | Qtr 1 2020–21 | 7 | $100.00 | 5 (1 yr 1 qtr) |
| Health and human services | DH | Ballarat Base Hospital Redevelopment | Qtr 2 2027–28 | 2 | $541.60 | 5 (1 yr 1 qtr) |
| Health and human services | DFFH** | Carlton redevelopment – 246 units/sites | Qtr 4 2022–23 | 1 | $146.57 | 4 (1 yr) |
| Health and human services | DH | Goulburn Valley Health Redevelopment Stage 1 | Qtr 1 2022–23 | 1 | $229.30 | 4 (1 yr) |
| Health and human services | DFFH | Public Housing Renewal Program (PHRP) – North Melbourne, Northcote and Preston sites | Qtr 4 2026–27 | 1 | $173.00 | 3 |
| Justice and emergency services | DJCS | Cherry Creek Youth Justice Project | Qtr 1 2022–23 | 1 | $419.65 | 3 |
| Health and human services | DH | Northern Hospital Inpatient Expansion Stage 2 | Qtr 1 2021–22 | 1 | $162.67 | 2 |
| Justice and emergency services | DJCS | Chisholm Road Prison Project | Qtr 4 2021–22 | 1 | $1 118.53 | 2 |
* Yr(s) = Year(s)
** Department of Families, Fairness and Housing (DFFH).
Source: VAGO.
The projects in Figure 2I account for 63 extra quarters (15 yrs 3 qtrs), or 28.8 per cent, of the overall 219 quarters (54 yrs 3 qtrs) of added elapsed time recorded for all projects. We discuss overall project time additions later in this section.
Figure 2I also shows that three projects in the transport sector added 31 quarters (7 yrs 3 qtrs) to their estimated completion date, due to nine material scope changes. The health and human services sector has a further six projects that added 27 quarters (6 yrs 3 qtrs) of elapsed time, due to seven scope changes.
The most significant time addition to a specific project due to scope change was for the Murray Basin Rail Project in the transport sector, which added 20 quarters (5 yrs) to its estimated completion date, due to one scope change.
2.4 Overall cost (TEI) variances
We found that the TEI for 69 of the 110 projects, or 62.7 per cent, has varied (increased or decreased) compared to their first publicly announced estimated budget.
Figure 2J shows the size of net project TEI variances, which is the sum of TEI increases less the sum of TEI decreases, by sector.
FIGURE 2J: Size of projects' net TEI variances (TEI increases less decreases) by sector ($ millions)
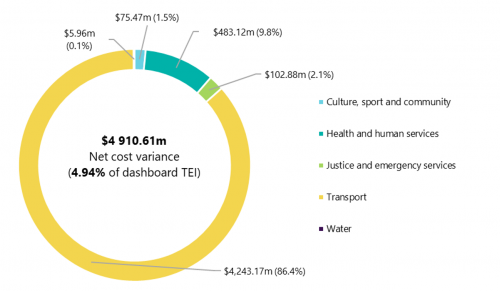
Note: Due to a rounding error, percentages don't sum to 100 per cent.
Source: VAGO.
Within the dashboard, 42 projects, or 38.2 per cent, had a TEI increase compared to their initial disclosed TEI. There are 27 projects, or 24.6 per cent, that show a TEI decrease.
Overall, the total value of all TEI increases within the 110 projects was $5.95 billion, which is six times more than the value of TEI decreases ($1.04 million).
Figure 2K shows the projects with a TEI variance of more than +/-10 per cent. Only three of the 25 projects with a TEI decrease show more than 10 per cent.
FIGURE 2K: Projects with a TEI variance of more than +/-10 per cent
| Agency | Project | Original TEI (millions) | Current TEI (millions) | Variance (millions) | TEI variance (%) |
|---|---|---|---|---|---|
| DoT | Car Parks for Commuters Program^ | $150.00 | $485.62 | $335.62 | 223.8 |
| MTIA | Warrnambool Line Upgrade (regional various) Stage 1 | $114.00 | $348.00 | $234.00 | 205.3 |
| DoT | City Loop Fire and Safety Upgrade Stage 2 and Intruder Alarm | $132.86 | $382.09 | $249.23 | 187.6 |
| MTIA | Streamlining Hoddle Street (Richmond) | $56.21 | $112.53 | $56.32 | 100.2 |
| DH | Royal Victorian Eye & Ear Hospital Planning & Redevelopment | $165.00 | $317.81 | $152.81 | 92.6 |
| DoT | Murray Basin Rail Project | $426.50 | $794.41 | $367.91 | 86.3 |
| MTIA | Mordialloc Freeway Upgrade (Braeside) | $300.00 | $522.25 | $222.25 | 74.1 |
| DoT | Hall Road Upgrade Skye | $169.00 | $282.50 | $113.50 | 67.2 |
| DJCS | Chisholm Road Prison Project^^ | $689.45 | $1 118.53 | $429.08 | 62.2 |
| MTIA | Monash Freeway Upgrade – Stage 2 | $684.42 | $1 037.85 | $353.43 | 51.6 |
| MTIA | Princes Highway East – Traralgon to Sale Duplication (regional various) | $175.00 | $259.07 | $84.07 | 48 |
| MTIA | O’Herns Road Upgrade (Epping) | $77.75 | $113.72 | $35.97 | 46.3 |
| DJCS | Cherry Creek Youth Justice Project | $288.70 | $419.65 | $130.95 | 45.4 |
| DH | Joan Kirner Women's & Children's Hospital Sunshine | $200.00 | $280.17 | $80.17 | 40.1 |
| DH | Goulburn Valley Health Redevelopment Stage 1 | $168.53 | $229.30 | $60.76 | 36.1 |
| DH | Casey Hospital Expansion | $106.30 | $139.78 | $33.48 | 31.5 |
| MTIA | Western Highway duplication – Ballarat to Stawell (regional various) | $505.00 | $656.36 | $151.36 | 30 |
| MTIA | Echuca-Moama Bridge (Echuca) | $134.90 | $173.25 | $38.35 | 28.4 |
| MTIA | Frankston Line stabling (Kananook) | $187.40 | $239.98 | $52.58 | 28.1 |
| DH | Geelong Hospital – Major Upgrade | $93.27 | $118.17 | $24.90 | 26.7 |
| MTIA | Plenty Road Upgrade Stage 2 | $114.21 | $144.19 | $29.98 | 26.3 |
| MTIA | Gippsland Line Upgrade Stage 1 (regional various) | $435.00 | $531.36 | $96.36 | 22.2 |
| MTIA | Ballarat Line Upgrade Stage 1 | $516.72 | $631.12 | $114.40 | 22.1 |
| DJPR | Melbourne Exhibition Centre Stage 2 Development (Southbank) | $168.70 | $205.00 | $36.30 | 21.5 |
| DH | Ballarat Base Hospital Redevelopment | $461.60 | $541.60 | $80.00 | 17.3 |
| DoT | Bayside Rail Improvement Project (Frankston – Werribee Line) | $100.00 | $115.00 | $15.00 | |
| MTIA | Barwon Heads Road upgrade (Barwon Heads) | $318.30 | $365.00 | $46.70 | 14.7 |
| MTIA | Drysdale Bypass (Drysdale) | $102.56 | $117.38 | $14.82 | 14.5 |
| MTIA | Chandler Highway Upgrade (Alphington, Kew) | $110.00 | $125.42 | $15.42 | 14 |
| MTIA | Level Crossing Removal Program (metropolitan various) | $6 000.00 | $6 759.02 | $759.02 | 12.7 |
| MTIA | Metro Tunnel Project | $10 900.00 | $12 255.14 | $1 355.14 | 12.4 |
| MTIA | Thompsons Road duplication (Lyndhurst) | $148.30 | $123.24 | $25.06 | -16.9 |
| DoT | More Regional Trains Regional Network Development Plan | $287.89 | $224.15 | $63.74 | -22.1 |
| DJCS | Men’s Prison System Capacity – Prison Infill Expansion Program^^^ | $1 255.37 | $798.19 | $457.18 | -36.4 |
^Note from the BP4 2021–22: The Car Parks for Commuter and Train station car parking programs have been consolidated into one initiative as this will be managed as a single car parking program to streamline reporting and maximise program efficiencies.
^^Note from the BP4 2021–22: TEI has increased compared with the 2019–20 Budget due to $429.08 million being provided from the Men's Prison System Capacity (statewide) to deliver a further 548 beds.
^^^Note from the BP4 2021–22: TEI has reduced by $450.70 million compared with the 2019–20 Budget due to $429.08 million provided to the Chisholm Road prison project (non-metro various) and $21.62 million for a revised scope of works.
Source: VAGO.
Cost (TEI) decreases
According to the BP4 data, many TEI decreases were due to new accounting standards, which have been intermittently applied to various projects in different financial years. These new standards have required some entities to reclassify various capital amounts to operating expenditure, which is not included in a project's publicly disclosed TEI.
Other projects have had funds reallocated to a different project. For example, in 2021–22, DJCS’s Men's Prison System Capacity – Prison Infill Expansion Program, had $429.08 million moved to the Chisholm Road Prison Project.
Cost (TEI) increases
The median is the middle point in a sorted, ascending or descending, list of numbers.
Forty-two projects, or 38.2 per cent, contributed to $5.95 billion in total TEI increases, which is equivalent to 6 per cent of the dashboard's TEI of $99.31 billion.
Across all projects with a TEI variance, either positive or negative, on average there was a TEI increase of $71.17 million, with a median increase of $15 million.
Figure 2L shows the average and median value of TEI additions and reductions by sector.
FIGURE 2L: Average and median variance for projects with cost (TEI) additions and reductions by sector
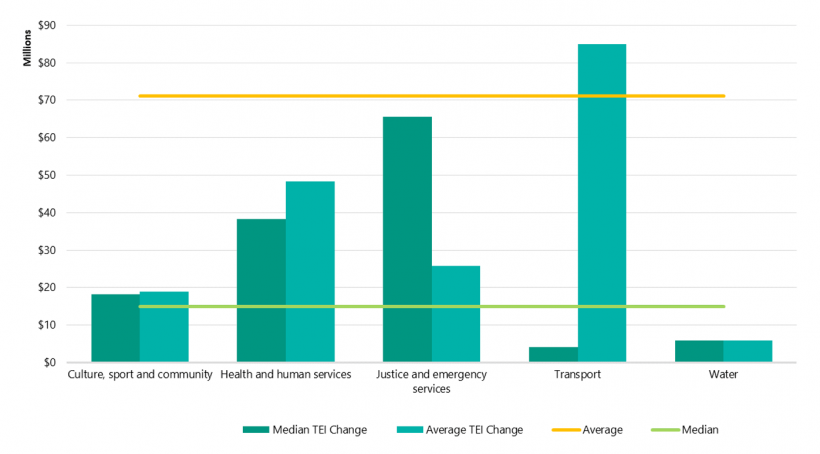
Note: As the water sector has only one project with a variance there is no difference between average and median.
Source: VAGO.
Notably, the $5.95 billion in overall TEI increases is much larger than the $2.80 billion in added cost that entities said were due to material scope changes. This indicates that factors other than material scope changes are driving budget amendments across all sectors from when a project’s initial cost is announced to its most recently disclosed TEI.
2.5 Time (estimated completion date) variances
The dashboard shows that 53 major projects, or 48.2 per cent, have had a time variance (increase or decrease) compared to their first announced estimated completion date.
There were 37 (33.6 per cent) major projects that added at least one quarter to their original estimated completion dates. The average extra elapsed time was 7.14 quarters. The smallest time addition we saw was one quarter, and the largest was 23 quarters (5 yrs 3 qtrs).
Sixteen projects have brought forward their estimated completion dates. On average, these projects estimate they will finish 2.81 quarters ahead of their original estimate.
Figure 2M shows the net added time (estimated completion date) variances. That is, the sum of the completion date additions less the sum of completion date reductions, by sector.
When taken together, the projects in the culture, sport and community sector finished two quarters before their estimated completion dates, which means we cannot show this sector in the figure.
FIGURE 2M: Time (estimated completion date) variances by sector, in quarters
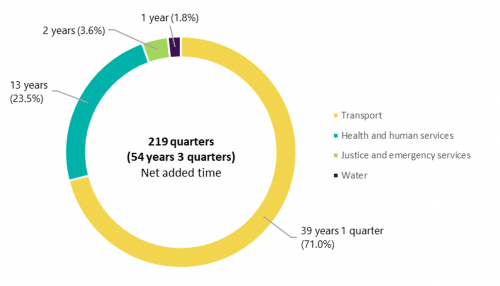
Note: Culture, sport and community sector projects have a net variance of 2 quarters of reduced elapsed time, which cannot display here. Due to rounding error, percentages do not sum to 100%
Source: VAGO.
Figure 2N shows the data for the five projects with the most added time. Figure 2O shows the eight projects that estimate they will finish the furthest ahead of their first disclosed estimated completion date.
FIGURE 2N: The five projects with the most added elapsed time
| Sector | Delivery agency | Project | Original estimated completion date | Current estimated completion date | Quarters added |
|---|---|---|---|---|---|
| Transport | MTIA | Western Highway duplication – Ballarat to Stawell (regional various) | Qtr 3 2015–16 | Qtr 2 2021–22 | 23 (5 yrs 3 qtrs) |
| Transport | DoT | Murray Basin Rail Project | Qtr 2 2018–19 | Qtr 2 2023–24 | 20 (5 yrs) |
| Health and human services | DH | Royal Victorian Eye & Ear Hospital Planning & Redevelopment | Qtr 2 2017–18 | Qtr 4 2021–22 | 18 (4 yrs 2 qtrs) |
| Health and human services | DFFH | Carlton redevelopment - 246 units/sites | Qtr 2 2018–19 | Qtr 4 2022–23 | 18 (4 yrs 2 qtrs) |
| Transport | DoT | Tram Procurement & Supporting Infrastructure | Qtr 4 2017–18 | Qtr 4 2021–22 | 16 (4 yrs) |
Source: VAGO.
FIGURE 2O: The eight projects estimating most reduced elapsed time
| Sector | Delivery agency | Project | Original estimated completion date | Current estimated completion date | Quarters reduced |
|---|---|---|---|---|---|
| Health and human services | DFFH | Public Housing Renewal Program (PHRP) – North Melbourne, Northcote and Preston sites | Qtr 4 2028–29 | Qtr 4 2026–27 | 8 (2 yrs) |
| Transport | MTIA | Mordialloc Freeway Upgrade (Braeside) | Qtr 4 2022–23 | Qtr 2 2021–22 | 6 (1 yr 2 qtrs) |
| Transport | MTIA | New Trains for Sunbury | Qtr 2 2024–25 | Qtr 1 2023–24 | 5 (1 yr 1 qtr) |
| Transport | MTIA | Monash Freeway Upgrade – Stage 2 | Qtr 4 2022–23 | Qtr 4 2021–22 | 4 (1 yr) |
| Transport | MTIA | Yan Yean Road duplication – Stage 1 (Plenty) | Qtr 4 2019–20 | Qtr 1 2019–20 | 3 |
| Culture, sport and community | DV | Melbourne Park redevelopment stage two (Melbourne) | Qtr 4 2019–20 | Qtr 1 2019–20 | 3 |
| Culture, sport and community | DJPR | Melbourne Exhibition Centre Stage 2 Development (Southbank) | Qtr 4 2018–19 | Qtr 1 2018–19 | 3 |
| Transport | MTIA | Hurstbridge rail line upgrade (metropolitan various) | Qtr 4 2018–19 | Qtr 1 2018–19 | 3 |
2.6 Business cases, investment logic maps and benefits management plans
DTF requires that any project worth more than $10 million (which therefore includes all major projects) develop a business case, as well as an investment logic map and a benefits management plan.
We asked the surveyed entities if they had developed these key documents for their projects. Figures 2P, 2Q, and 2R show the results.
FIGURE 2P: Does the project have a business case?
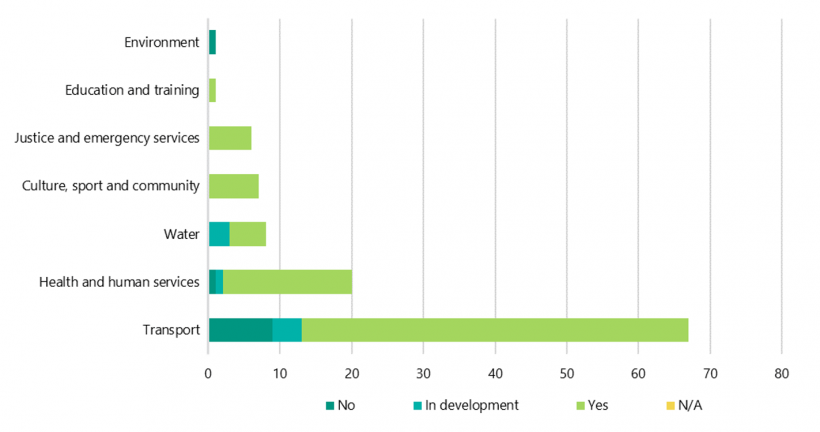
Source: VAGO.
FIGURE 2Q: Does the project have an investment logic map?
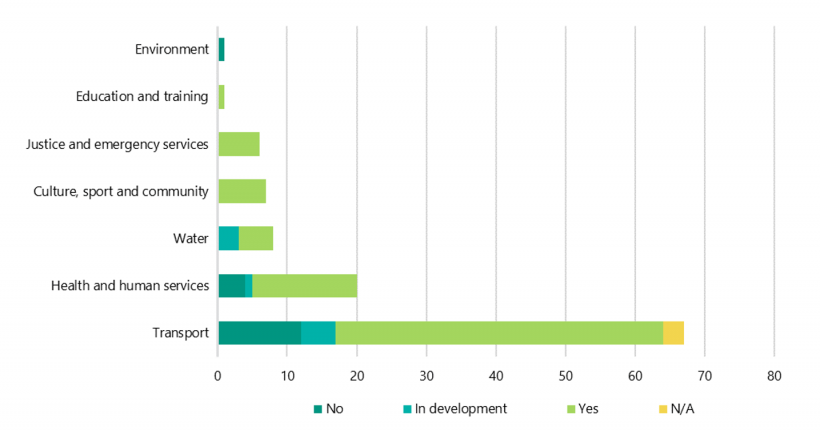
Source: VAGO.
FIGURE 2R: Does the project have a benefits management plan?
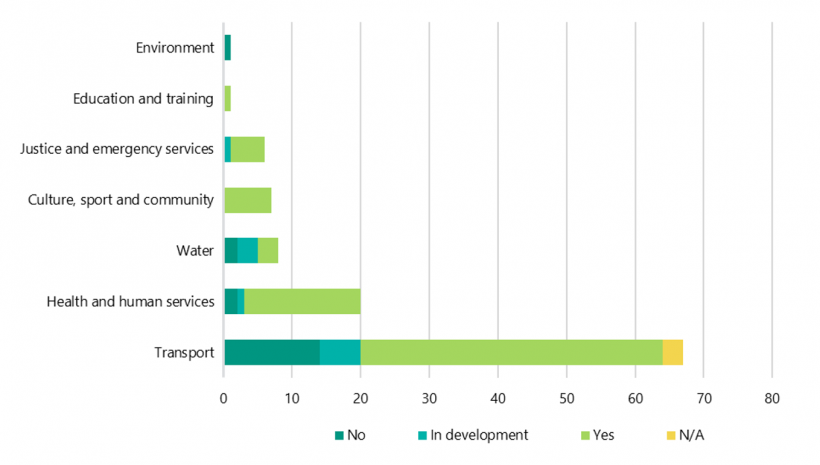
Source: VAGO.
The transport sector has the highest number of projects without a business case, with 13 projects or 19.4 per cent. Also in this sector, 26.6 per cent of major projects do not have an investment logic map and 31 per cent do not have a benefits management plan.
The absence of an investment logic map highly correlates with a missing benefits management plan. This is because DTF expects entities to use the investment logic mapping process to identify a project’s benefits and the measures they will use to assess a project’s success, which is then formalised in a benefits management plan.
According to the survey responses, the underlying reasons for the transport sector’s high rate of non-compliance with DTF’s requirements were:
- the information that a business case would have contained was presented to decision-makers in another format, such as:
- approval granted through a Cabinet decision
- approval granted through an annual works plan submission
- the funding came from a budget announcement or the submission progressed outside the state Budget cycle
- the project was included in the scope of another project's business case.
In other cases, respondents simply did not give a reason, or stated that they could not determine the reason as they could not locate relevant documents.
2.7 Impact of the COVID-19 pandemic on major projects
We asked the surveyed entities if the COVID-19 pandemic had affected their major projects.
Figure 2S shows the percentage of projects, by sector, where agencies reported that the pandemic has impacted the project.
FIGURE 2S: Percentage of major projects impacted by the COVID-19 pandemic by sector
Source: VAGO.
For the 110 projects we surveyed, entities disclosed that 52, or 47.3 per cent, were affected by the pandemic. The pandemic mainly impacted projects’ time and cost. In some cases, the impact was positive because works could be accelerated due to public facilities being closed.
Our major projects performance dashboard provides more specific details about the pandemic’s impact for each project.
2.8 Procurement models used by major projects
Our survey collected information about the main procurement models used in the major projects. A description of these procurement models is at Appendix B.
Figure 2T shows the percentage of projects using each procurement model, by sector.
FIGURE 2T: Percentage of projects by procurement model by sector
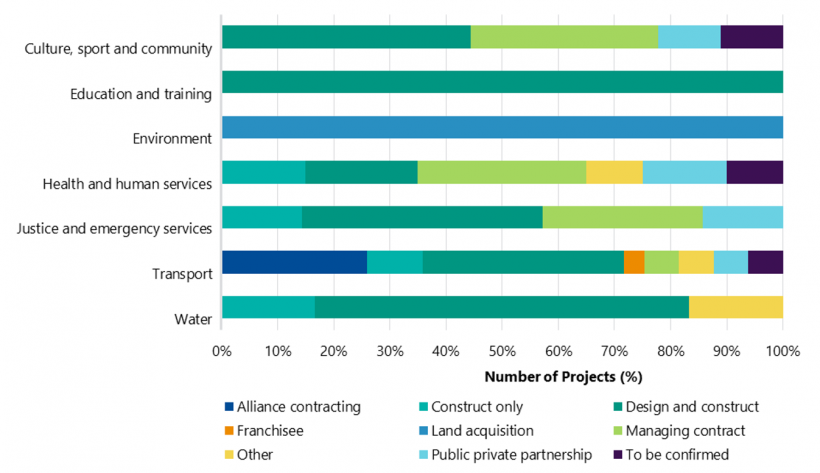
Source: VAGO.
Figure 2T shows that all sectors with multiple projects in our dashboard extensively use the design and construct procurement model.
The managing contract model is widely used in the culture, sport and community, justice and emergency services, and health and human services sectors.
The alliance and franchisee procurement models are only used in transport sector projects included in our dashboard. Public private partnerships are used by the justice and emergency, health and human services, culture sport and community and transport sector projects.
The environment sector only had one major project in the dashboard, so the land acquisition model is only relevant for the Melbourne Strategic Assessment program. Likewise, the education sector only had one project in our dashboard, the Shepparton Education Plan, which used the design and construct model.
Appendix A. Submissions and comments
Click the link below to download a PDF copy of Appendix A. Submissions and comments.

Appendix B. Acronyms and abbreviations
| Acronyms | |
|---|---|
| ASSAM | SRIMS asset management module |
| DFFH | Department of Families, Fairness and Housing |
| DH | Department of Health |
| DJCS | Department of Justice and Community Safety |
| DJPR | Department of Jobs, Precincts and Regions |
| DoT | Department of Transport |
| DPC | Department of Premier and Cabinet |
| DTF | Department of Treasury and Finance |
| DV | Development Victoria |
| GII | government infrastructure investment |
| HVHR | High Value High Risk |
| IT | information technology |
| MPPR | Major Projects Performance Report |
| MTIA | Major Transport Infrastructure Authority |
| OPV | Office of Projects Victoria |
| PAEC | Public Accounts and Estimates Committee |
| PHRP | Public Housing Renewal Program |
| RMF | Resource Management Framework |
| SRIMS | State Resource Information Management System |
| TEI | total estimated investment |
| VAGO | Victorian Auditor-General’s Office |
| Procurement model | Explanation |
|---|---|
| Alliance | A risk sharing contract that binds all parties to work for the best of the project and cooperatively identify and resolve project risks. The project costs are cooperatively developed using an open book approach, with a gain-share/pain-share mechanism available to parties, offering a potential bonus if the project is delivered early or under expected cost. |
| Construct only | State engages builders to construct a design it has already developed and approved. |
| Design and construct | State engages firms to help design an asset to meet project needs and requirements as well as construct the approved design. |
| Franchisee | Under the public transport outsourcing arrangements (known as a franchise) the state can direct a Franchisee to undertake certain state-nominated works or projects. The Franchisee is compensated on a project cost plus regulated overhead basis. The Franchisee oversights and delivers all relevant project works. |
| Land acquisition | State purchases future project land on the property market or by using its compulsory acquisition powers. |
| Managing Contract | State procures a Managing Contractor to oversight and sub-contract out specific works to deliver an asset. The Managing Contractor oversights and delivers all relevant project works. |
| Public private partnership | A long-term agreement between the State and a private sector consortium to design, build, finance, and maintain (and sometimes operate) public infrastructure. These projects can range from economic infrastructure (such as toll roads or railways) to social infrastructure (such as hospitals, prisons and schools). |
| Abbreviations | |
|---|---|
| BP2 | 2020–21 Budget Paper No. 2: Strategy and Outlook |
| BP4 | Budget Paper No. 4: State Capital Program |
| COVID-19 | Coronavirus |
| PARs | Project/Program Assurance Reviews |
| Qtr | Quarter |
| Yr(s) | Year(s) |
Appendix C. About this assurance review
| Who we reviewed | What we assessed | What the review cost |
|---|---|---|
|
We assessed if:
|
The cost of this review was $850 000. |
Our methods
We conducted this limited assurance review in accordance with the Audit Act 1994 and ASAE 3500 Performance Engagements. We complied with the independence and other relevant ethical requirements related to assurance engagements.
As part of this review we:
- held discussions with experts and other stakeholders on project performance matters
- collected and collated data on major capital projects (such as current and historical BP4s) from DTF, OPV and other public sources
- inspected and analysed original data sources and complementary data source documents to understand data quality and the type of data being collected and used by entities
- interviewed relevant officers from some reviewed entities
- inspected and analysed project ratings made by DTF and OPV as well as relevant self-assessments by reviewed entities
- surveyed 16 public sector entities responsible for or delivering 110 major projects to collect relevant data for a public-facing dashboard. We also required each entity's accountable officer to attest to the data’s accuracy and correctness on the date that they provided it
- analysed the collected data using data analytics software and visualisation tools.
We also provided a copy of the report to DPC, as required by the Audit Act 1994.
Our method and approach for collecting data
A number of project delivery entities assisted the responsible entities (listed in the BP4) to collate specific types of project data for this review. There were seven entities with only one major project in 2019–20 or 2020–21:
- Department of Education and Training
- Department of Environment, Land, Water and Planning
- Greater Western Water Corporation
- Goulburn-Murray Rural Water Corporation
- Kardinia Park Stadium Trust
- South East Water Corporation
- Suburban Rail Loop Authority.
For entities listed in the BP4 with projects, these responsible entities' accountable officer (or delegate) was asked to formally attest to the accuracy and completeness of the data collected within the survey.
For projects where an entity is delivering a project on behalf of another entity listed in the BP4, we asked the delivery entity's accountable officer (or delegate) to formally attest to the accuracy and completeness of the data.
We cross-checked some surveyed data with data published in the BP4. We performed some data analytics on these results and imported these into Python and Microsoft Power BI to produce an interactive dashboard.
Selecting major projects to survey
We initially identified major projects to survey using the 2019–20 BP4 and the 2020–21 Budget Paper No. 3: Service Delivery. After discussing our initial selection with the entities, we removed some projects that appeared in the budget papers as a single capital item if they were an ongoing program of capital works or an aggregation of minor projects.
We added some projects that were not explicitly disclosed as separate major projects in the budget papers. Appendix D lists these projects.
Appendix E lists the projects that we did not include in the survey and dashboard.
Appendix D. Entities’ project self-assessments
Appendix D summarises the projects we included in this review and shows the relevant entities’ self-assessments ratings. Click the link below to download a PDF copy.
Appendix E. Major BP4 capital investments not included in this review
This appendix lists the major capital investments from the 2019–20 BP4 and 2020–21 Budget Paper No.3: Service Delivery that we did not include in this review. Click the link below to download a PDF copy.
Appendix F. Water entities’ major project disclosures in the BP4
This appendix provides more information about water entities' major project disclosures in the BP4. Click the link below to download a PDF copy.
Appendix G. Data sources used in this review
The files below contain all the responses for our survey of entities in relation to their major projects. For the purposes of space, we have abbreviated the questions asked in the survey.
The table also uses abbreviations for the questions we have asked, which Figure G1 lists.
FIGURE G1: Acronyms and abbreviations
| Appendix G acronyms and abbreviations | |
|---|---|
| BMP | Benefits Management Plan |
| BP4 | Budget Paper No. 4: State Capital Program |
| Est. | Estimate |
| ETE | Estimated total expenditure |
| FY | Financial year |
| HVHR | High Value High Risk |
| ILM | Investment Logic Map |
| Metro | Metropolitan |
| N/A | Not applicable |
| PAR | Project Assurance Review |
| PMM | Project Management Method |
| Qtr | Financial quarter |
| Reg | Regional |
| SA | Self-assessment |
Click the links below to download a PDF or CSV copy of the full dataset, including the full questions.