Enrolment Processes at Technical and Further Education Institutes
Overview
In this audit, we examined the efficiency of enrolment processes for government-subsidised training at four Technical and Further Education Institutes (TAFEs) and one dual sector university: Box Hill Institute; Melbourne Polytechnic; Sunraysia Institute of TAFE; William Angliss Institute of TAFE; and Swinburne University of Technology. We also considered the Department of Education and Training’s oversight of and support provided to TAFEs to meet their contractual requirements.
This audit used process mining software to examine prospective students' pathways through the enrolment process at four of the five audit TAFEs. This video shows process mining's potential to illuminate key attrition points in the enrolment process.
Transmittal Letter
Independent assurance report to Parliament
Ordered to be published
VICTORIAN GOVERNMENT PRINTER September 2019
PP No 67, Session 2018–19
President
Legislative Council
Parliament House
Melbourne
Speaker
Legislative Assembly
Parliament House
Melbourne
Dear Presiding Officers
Under the provisions of the Audit Act 1994, I transmit my report Enrolment Processes at Technical and Further Education Institutes.

Yours faithfully
Andrew Greaves
Auditor-General
11 September 2019
Acronyms and Abbreviations
Acronyms
| ACSF | Australian Core Skills Framework |
| ASQA | Australian Skills Quality Authority |
| CRM | customer relationship management |
| RTO | registered training organisation |
| SMS | student management system |
| SVTS | Skills Victoria Training System |
| TAFE | technical and further education |
| VAGO | Victorian Auditor-General's Office |
| VCAL | Victorian Certificate of Applied Learning |
| VCE | Victorian Certificate of Education |
| VET | vocational education and training |
| VTG | Victorian Training Guarantee |
Abbreviations
| Box Hill | Box Hill Institute |
| SuniTAFE | Sunraysia Institute of TAFE |
| Swinburne | Swinburne University of Technology |
| the contract | VET funding contract |
| the department | Department of Education and Training |
| William Angliss | William Angliss Institute of TAFE |
Audit overview
The vocational education and training (VET) sector helps individuals develop skills and knowledge across a broad range of industries. These skills prepare graduates for employment or further education.
Victorians may study VET through technical and further education (TAFE) institutes and universities, or through other government and non-government providers, such as secondary schools, community organisations and industry skills centres. There are 12 publicly owned TAFEs across Victoria, and four dual‑sector universities that deliver VET.
The Education and Training Reform Act 2006 states that TAFEs must provide efficient and effective training programs that meet the needs of their local communities. Dual‑sector universities have a similar mandate and deliver significant amounts of both VET and higher education. In contrast, TAFEs deliver mostly VET. For this audit, 'TAFE' refers to both standalone TAFEs and dual‑sector universities.
Following years of significant policy and regulatory change, the Victorian Government has prioritised the development of a strong and stable VET sector that protects students' rights and interests. It aims to achieve this through Skills First, a government-subsidised training program that targets industry needs while maximising students' employment prospects.
The Department of Education and Training (the department) engages providers, such as TAFEs, to deliver the Skills First program using the VET funding contract (the contract). Due to past occurrences of corrupt conduct, the contract has strengthened requirements regarding the enrolment process. These requirements aim to prevent fraud by determining how TAFEs assess prospective students' eligibility and suitability for government‑subsidised training.
In this audit, we examined the efficiency of enrolment processes for Skills First training at five institutions:
- Box Hill Institute (Box Hill)
- Melbourne Polytechnic
- Sunraysia Institute of TAFE (SuniTAFE)
- Swinburne University of Technology (Swinburne)
- William Angliss Institute of TAFE (William Angliss).
We also assessed whether the department helps TAFEs comply with the contract.
Conclusion
In Victoria, prospective TAFE students do not consistently experience an efficient enrolment process for government-subsidised training.
Depending on the institution they seek to enrol with, some will engage with an online enrolment process with the flexibility and support needed to complete key steps based on individual needs. More commonly, individuals will experience a rigid enrolment process that relies on manual processing and in‑person visits. Manual processing is inefficient for TAFEs and increases their costs. It also hinders their ability to track people through the enrolment process and use that information to improve their efficiency and effectiveness. And while in-person visits may benefit some prospective students, they inconvenience others.
The open-ended requirements in the department's contract with TAFEs for considering a prospective student's literacy and numeracy skills add to inconsistency and inefficiency in TAFEs' enrolment practices. By prioritising compliance in this area, most TAFEs impose onerous testing requirements that disregard an individual's educational background. If the department clarifies when and how testing should occur, TAFEs could implement more streamlined methods that maintain compliance.
Despite these inefficiencies, a significant proportion of prospective students find it easy to enrol at the five audited TAFEs. These TAFEs are working to improve their enrolment systems and move more processes online, but this work is uncoordinated. Greater sector-wide efficiency can be gained if the department leads and works with TAFEs to develop a shared solution, rather than TAFEs duplicating effort using their own limited resources.
Findings
Efficiency of enrolment processes at TAFEs
We focused on how TAFEs support prospective students through the key phases of enquiry, and applying, assessing, and finalising their enrolment. We also considered whether TAFEs collect information or perform processes that are unnecessary or duplicative.
TAFEs' information management systems
Most TAFEs use different versions of the same third-party software programs to capture information about prospective students during the enrolment process. However, they have configured these information management systems to their own preferences.
Two TAFEs—Swinburne and Box Hill—have integrated their information management systems with their enrolment processes. This allows prospective students to mostly enrol online and enables staff to access high-quality enrolment data promptly. Three TAFEs—Melbourne Polytechnic, SuniTAFE, and William Angliss—have not done so. Consequently, they rely on manual processes to enrol prospective students. This results in double-handling of information, which affects the quality of enrolment data.
Minimising manual enrolment processes will help TAFEs reduce their administrative burden and improve the quality and accessibility of their enrolment data.
Options for completing enrolment steps
|
We surveyed prospective students at the five audited TAFEs about their experiences with TAFEs' enrolment processes. We further detail our survey methodology in Appendix D. |
TAFEs should minimise burdensome enrolment processes for prospective students. Our online survey results show that prospective students at each TAFE most commonly found their enrolment experience to be easy. However, a smaller proportion of respondents found it difficult. Prospective students reported that they prefer to enrol in ways that suit their personal circumstances.
Swinburne and Box Hill allow prospective students to complete the enrolment process either online or in person. This enables these TAFEs to better meet an individual's needs and save time and resources. The remaining three TAFEs require individuals to complete key enrolment steps in person. This leads to significant variability in the time and effort it takes prospective students to finalise their enrolment. Despite these limited options, only a small proportion of individuals reported not finalising their enrolment because the process was too difficult.
All TAFEs are improving their enrolment processes and information management systems to enable efficient online integration. For example, William Angliss and SuniTAFE have recently improved their enquiry management systems. Melbourne Polytechnic has begun to move towards an online enrolment system, while Box Hill and Swinburne are further streamlining their existing online systems.
Literacy and numeracy testing
The department's contract requires TAFEs to consider whether a prospective student has the appropriate literacy and numeracy skills to enrol in a course. The department has not clearly explained how TAFEs can use senior secondary education certificates or post‑school qualifications to consider this. Consequently, four audited TAFEs—Box Hill, Melbourne Polytechnic, SuniTAFE, and William Angliss—require prospective students to complete a formal literacy and numeracy test, regardless of their educational backgrounds.
Conducting literacy and numeracy tests is resource intensive for TAFEs and can be an unnecessary use of prospective students' time, especially those with previously demonstrated capabilities. The tests can take individuals up to an hour to complete, and TAFEs that supervise it on campus must supply computers and supervisors.
Aside from literacy and numeracy testing, we found only minor instances of TAFEs collecting unnecessary or duplicative information.
Monitoring enrolments at TAFEs
TAFEs should routinely monitor the efficiency and effectiveness of their enrolment processes to understand their strengths and weaknesses and improve the experience for prospective students. This includes assessing:
- conversion rates—the proportion of prospective students who progress between key points in the enrolment process
- customer service levels—the extent to which prospective students receive timely and efficient support from TAFEs
- prospective students' feedback—the systematic collection and analysis of individuals' experiences and observations.
Monitoring conversion rates
|
End-to-end conversion rates measure the proportion of individuals who express interest in studying who later finalise their enrolment. Not all prospective students will finalise their enrolment—some will withdraw their interest, while others will not receive an offer. This reduction in a TAFE's pool of prospective students is known as attrition. |
All audited TAFEs measure their end-to-end conversion rates, from initial interest to finalised enrolment. This provides TAFEs with valuable insight into their operational effectiveness. Three TAFEs—Box Hill, William Angliss, and Swinburne—also measure conversion rates between key touchpoints in their enrolment processes. Melbourne Polytechnic and SuniTAFE do not perform this analysis, which affects their ability to identify attrition points.
Swinburne analyses its conversion rates during peak enrolment periods to monitor improvement initiatives, highlighting its commitment to continuous improvement. The other four TAFEs do not strategically assess conversion rates.
Monitoring customer service
Box Hill, Swinburne, and William Angliss assess key aspects of service delivery, such as wait times for prospective students, from a customer service perspective. This analysis helps these TAFEs to understand whether any downward trends in their conversion rates are due to internal or external factors, which should enable them to target their improvement initiatives. Melbourne Polytechnic and SuniTAFE do not perform this type of assessment.
Collecting prospective students' feedback
Four of the five audited TAFEs collect feedback from prospective students on the enrolment experience. They do this using methods such as survey tools and focus groups. SuniTAFE does not collect this information, meaning it lacks critical information about the barriers to enrolment, which may hinder its ability to identify inefficiencies and undertake corrective action.
The department's minimum service standards for Free TAFE
|
In 2018, the Victorian Government committed $172 million over four years to the Free TAFE for Priority Courses initiative. Through this initiative, the government fully covers the tuition fees for 50 courses to reduce students' financial burden. |
In late 2018, the department developed minimum service standards in consultation with TAFEs to encourage consistency in how staff manage prospective students enrolling in a Free TAFE qualification. To date, TAFEs have not embedded these standards into their performance monitoring frameworks for Free TAFE courses. Some TAFEs may need support from the department to develop their capability to report against these standards. The department is also yet to apply system-wide monitoring requirements using these standards.
Limitations of TAFEs' enrolment data
As Melbourne Polytechnic, SuniTAFE, and William Angliss use manual processes to collect critical enrolment‑related information, they do not capture real‑time data that corresponds to their key touchpoints. This limitation hinders their ability to systematically assess key aspects of performance, such as timeliness. TAFEs that lack real‑time information have limited oversight of each prospective student's journey through the enrolment pipeline, which may also affect the department's ability to monitor sector‑wide trends using the minimum service standards for Free TAFE.
Time taken to process enrolments
Despite these issues, we were able to compare the time taken to enrol at three of the five TAFEs—Swinburne, Melbourne Polytechnic, and William Angliss—using process mining software. As SuniTAFE had data quality issues and Box Hill has recently adopted a new information management system, we were unable to extract enrolment data for time periods comparable to the other TAFEs.
|
The 50th percentile is the value below which 50 per cent of observations may be found. |
Our results show—at the 50th percentile—that it took Swinburne the least time to process an individual's enrolment (six days), followed by Melbourne Polytechnic (10 days), then William Angliss (61 days). Swinburne enables prospective students to complete the enrolment process online, while Melbourne Polytechnic requires one in-person visit, and William Angliss requires two in-person visits.
TAFEs' compliance with the VET funding contract
Documenting TAFEs' enrolment processes
TAFEs must comply with contract requirements to be eligible for government funding. Under the contract, TAFEs must have a clear and documented business process for:
- assessing a prospective student's eligibility for enrolment in a subsidised course or qualification under Skills First
- conducting a pre-training review to determine the most suitable and appropriate training for the prospective student.
All five TAFEs have documented business processes for these two aspects. However, they often lack necessary detail and up‑to‑date content to ensure that staff enrol prospective students in a consistent and compliant manner.
Departmental monitoring and support
To help TAFEs comply with the contract, the department needs to make it as easy to understand as possible. It should also have oversight mechanisms to drive TAFEs' compliance.
The department provides wide-ranging support and monitoring that helps clarify TAFEs' enrolment obligations. This includes delivering workshops, publishing guidance, responding to TAFEs' enquiries, and commissioning audits of compliance with the contract. The department has also made a range of recent contract improvements that either clarify requirements or make compliance less burdensome, based on TAFEs' feedback.
However, the department's compliance monitoring of TAFEs is sometimes inconsistent with the contract's enrolment‑related clauses. This included two instances where department‑commissioned audits identified pre‑training reviews as non‑compliant based on criteria that are not explicit in the contract.
TAFEs' internal auditing of compliance
Under the contract, TAFEs must annually conduct an internal audit of their compliance with enrolment requirements. They must notify the department of any non-compliance and develop a rectification plan within a reasonable time. The department also provides TAFEs with an optional internal audit checklist to help them assess their contractual compliance.
All five audited TAFEs conducted their own internal compliance audits during 2018 and developed rectification plans to address identified issues. All TAFEs except SuniTAFE also assessed their compliance separately during 2018 using the department's checklist.
However, comparisons between TAFEs' internal compliance audits and their completed checklists show inconsistent results. The checklist's focus on eliciting detail about TAFEs' enrolment processes—rather than checking whether their completed enrolments comply with the contract—is driving this inconsistency.
Recommendations
We recommend that the Department of Education and Training:
1. clarifies compliance requirements for considering an individual's literacy and numeracy skills as part of the pre-training review, so that all TAFEs apply consistent requirements (see Section 2.4)
2. applies the Free TAFE Student Experience Key Minimum Service Standards to all Skills First enrolments at TAFEs and requires all TAFEs to consistently measure and report performance against these standards (see Section 3.2)
3. reviews and updates internal and external audit checklists and prescribed audit questions so that criteria and enrolment requirements are consistent and reflect the vocational education and training funding contract (see Sections 4.3 and 4.4).
We recommend that the Department of Education and Training, in conjunction with TAFEs:
4. investigates options to develop standardised TAFE online enrolment systems or a centralised online enrolment system that integrates with each TAFE's own student management system, and enables consistent:
- enrolment application processes for all students
- real-time recording of standard enrolment steps
- tracking and reporting against the Free TAFE Student Experience Key Minimum Service Standards (see Section 2.5).
We recommend that TAFEs:
5. review and update their documented business processes for assessing student eligibility and conducting pre-training reviews so that they:
- provide sufficient detail about how to conduct assessments
- are consistent with the current vocational education and training funding contract (see Section 4.2)
6. promptly report all non-compliances with the vocational education and training funding contract identified in internal audits to the Department of Education and Training (see Section 4.4).
Responses to recommendations
We have consulted with the department, Box Hill, Melbourne Polytechnic, SuniTAFE, Swinburne and William Angliss, and we considered their views when reaching our audit conclusions. As required by the Audit Act 1994, we gave a draft copy of this report to those agencies and asked for their submissions or comments. We also provided a copy of the report to the Department of Premier and Cabinet.
The following is a summary of those responses. The full responses are included in Appendix A:
- The department accepts all recommendations and notes that it is already working to respond to opportunities for improvement identified in the report. It also states that it is committed to improving the efficiency of TAFE enrolment processes.
- Box Hill supports all six recommendations and accepts the three recommendations aimed at TAFEs.
- Melbourne Polytechnic accepts the three TAFE recommendations and notes its desire to provide a streamlined enrolment process that meets the department's contractual requirements.
- SuniTAFE supports the report's conclusions and notes its ongoing efforts to improve enrolment systems and achieve contractual compliance.
- Swinburne accepts recommendations 5 and 6 and notes recommendation 4, advising that it has a well-developed enrolment platform.
- William Angliss did not comment on the draft report.
1 Audit context
1.1 Vocational education and training
VET helps students develop technical skills and knowledge through practical, hands‑on learning. It provides them with pathways into a diverse range of industries, including nursing, hospitality, and traditional trades. According to the National Centre for Vocational Education Research, VET also plays a critical role in improving the opportunities of disadvantaged learners, as it helps individuals overcome key employment barriers, such as low literacy or numeracy levels.
Victorians may study VET in a broad range of contexts, including secondary schools, TAFEs, community organisations, industry skills centres, and universities. VET providers—also known as registered training organisations (RTO)—deliver various qualification types, including Certificates I to IV, diplomas, and advanced diplomas. In 2018, the Victorian VET sector had approximately 693 000 enrolments from both new and continuing students.
1.2 Delivery of VET in Victoria
Regulation of VET providers
The Australian Skills Quality Authority (ASQA) registers Victoria's TAFEs in accordance with the National Vocational Education and Training Regulator Act 2011. These TAFEs deliver nationally recognised VET courses and can apply for Commonwealth and state funding.
|
According to the National Vocational Education and Training Regulator Act 2011, ASQA can audit any RTO at any time. In practice, ASQA audits RTOs when they submit their initial application and again within the first 12 months of operation. ASQA also audits RTOs every five years as part of their ongoing registration cycle and in response to persistent or serious complaints. |
ASQA audits Victorian TAFEs to ensure they follow nationally approved quality standards. This regulation mitigates the risk that VET providers will certify students for unacquired competencies.
Victorian TAFEs and dual-sector universities
The Education and Training Reform Act 2006 establishes Victorian TAFEs as public providers of VET. TAFEs help individuals enter the workforce, upskill, transition to new industries, increase their earning potential, or prepare for higher education.
Victoria's TAFE model differs significantly from that used by other jurisdictions. Over the past decade, most states and territories have streamlined, either wholly or in part, their TAFE systems through amalgamation or centralisation. For example, in 2017, the New South Wales Government dissolved its 10 previously autonomous TAFEs into five regions supported by a central structure. This reform aimed to reduce duplicative back‑of‑house tasks, including administration and marketing. In contrast, Victorian TAFEs operate as autonomous entities in a competitive, market‑driven environment. Each TAFE has its own board of directors, for which the Minister for Training and Skills appoints half the members.
Dual‑sector universities are also an important part of Victoria's VET system. Victoria is home to four of Australia's six dual-sector universities. These autonomous institutions have evolved from various former technical colleges to deliver a broad spectrum of courses, including significant amounts of both VET and higher education. In contrast, TAFEs deliver mostly VET.
For this audit, we use 'TAFE' to refer to both standalone TAFEs and dual-sector universities. Figure 1A shows their locations across Victoria.
Figure 1A
Victoria's TAFEs and dual-sector universities
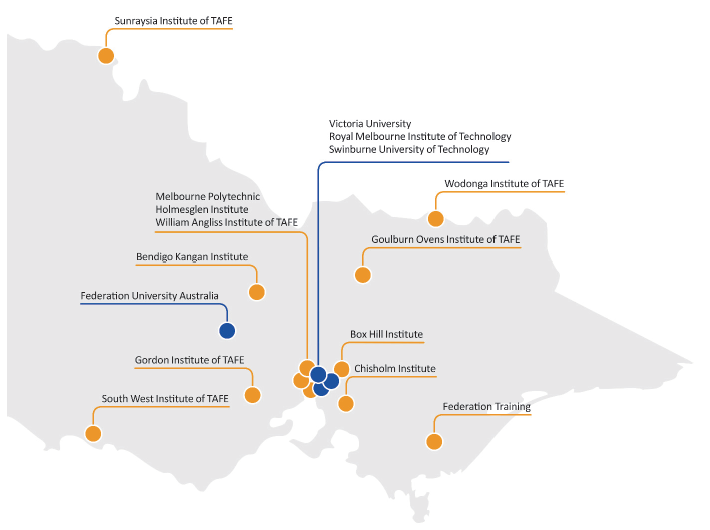
Note: The orange dots represent TAFEs, while the blue dots represent dual-sector universities.
Source: VAGO.
1.3 Skills First
|
The VTG uncapped VET enrolments and introduced full contestability for places, and therefore funding, between public and private providers. This reform aimed to create a student-driven, competitive culture focused on high‑quality services. Previously, the Victorian Government allocated a set number of subsidised VET places to certain providers. |
Launched on 1 January 2017, Skills First aims to strengthen the sustainability of TAFEs while protecting the rights and interests of students. It forms part of the Victorian Government's commitment to enhancing educational equity.
Through Skills First, the government contracts TAFEs and other RTOs to deliver subsidised courses to eligible individuals. Skills First builds on the government's previous entitlement scheme—the Victorian Training Guarantee (VTG)—and aims to:
- maintain a contestable funding system in which TAFEs and other RTOs deliver high-quality training by following specific contractual standards
- prioritise courses that target industry needs while maximising students' employment prospects
- financially support TAFEs to deliver vital community services that support students.
In 2019, the Skills First program includes 929 subsidised courses.
VET funding contract
The department engages RTOs to deliver subsidised training programs such as Skills First through the contract. The contract includes standard Skills First provisions and is valid for one to two years.
The contract outlines the conditions that RTOs must fulfil to receive Skills First funding. It states that these conditions impose 'significantly more onerous obligations on the training provider than apply by virtue of its status as a registered training organisation', and cover a broad range of topics, including:
- the appropriateness of marketing and advertising
- the provision of enrolment-related information to prospective students, such as course advice
- the procedure for testing an individual's eligibility for subsidised training, and their entitlement to concession prices or fee waivers
- the conduct of key enrolment-related processes, such as the pre‑training review, which helps TAFEs determine whether a prospective student's chosen course meets their needs and aspirations
- the development of a student's training plan, which provides clear information about their course and its requirements
- the delivery of training and assessment activities
- levying fees.
|
The two-course rule prevents individuals from beginning more than two subsidised courses in a year, enrolling in more than two subsidised courses concurrently, and puts lifetime limits on courses at the same level. |
We provide further information about these points in Appendix B.
According to the contract, individuals are eligible for subsidised training if they are under 20 years of age, or over 20 years of age and 'upskilling,' provided that:
- their preferred course of study is on the Skills First list and they fulfil its entry requirements
- they are either an Australian citizen, holder of a permanent Australian visa, or a New Zealand citizen who meets the two-course rule.
The contract also includes funding for high-needs learners who may otherwise be ineligible for subsidised training, through the:
- Latrobe Valley Initiative
- Back to Work Scheme
- Asylum Seeker VET Program.
1.4 Policy and regulatory changes
Over the past decade, changes to the VET sector's policy and regulatory environment have influenced TAFEs' enrolment levels, which declined from 2012 to 2018.
Figure 1B outlines the major policy and regulatory changes, and Figure 1C shows the number of new government-subsidised enrolments at TAFEs between 2010 and 2018.
Figure 1B
Changes to the TAFE policy and regulatory environment
|
Year |
Policy and regulatory changes |
|---|---|
|
2009 |
The Australian Government introduced the VET FEE-HELP student loans program to remove the up-front costs to education for eligible individuals. The Victorian Government introduced the VTG for individuals enrolling in diplomas and advanced diplomas, with fully contestable funding between public and private providers. |
|
2011 |
The Victorian Government expanded the VTG and contestable market to cover all VET qualification levels. This led to a significant increase in the number of private VET providers. |
|
2012 |
All Australian governments committed to the National Partnership Agreement on Skills Reform. This included the $1.7 billion National Training Entitlement, almost 75 per cent of which went to students enrolled with private providers. The Australian Government fully deregulated higher education places for domestic students from 2012 to 2017, which led to an increase in university enrolments. The Victorian Government removed special, community funding for TAFEs and tightened course subsidy levels, eligibility requirements, and oversight arrangements. This included the introduction of the two‑course rule. |
|
2014 |
The Victorian Government further tightened the two-course rule by restricting the number of subsidised courses that individuals can begin at the same level within their lifetime. |
|
2015 |
The Victorian Government:
|
|
2017 |
The Australian Government replaced the VET FEE-HELP program with the VET Student Loans scheme. This change set a higher bar for providers wishing to participate in the scheme. The Victorian Government replaced the VTG with the Skills First initiative and associated contract. The department sought to strengthen TAFE governance in response to dishonest conduct identified by the Independent Broad-based Anti-corruption Commission's Operation Lansdowne report, which found that some TAFEs misappropriated public funds through insufficient enrolment controls. |
|
2018 |
The Victorian Government committed $172 million to cover individuals' tuition fees for 50 courses under the Free TAFE. The department introduced minimum service standards for institutions delivering Free TAFE courses. |
Source: VAGO.
Figure 1C
New government-subsidised enrolments at Victorian TAFEs
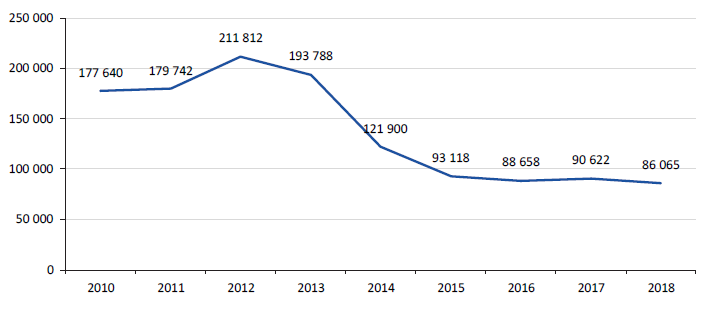
Source: VAGO, based on TAFE enrolment data from the department.
1.5 Enrolment processes
In this audit, we examined how prospective students enrol in Skills First programs. Figure 1D shows the standard process for enrolling in these courses. This process has four broad phases, comprising:
- enquiry―the prospective student contacts the TAFE to ask about training opportunities (as shown by the green boxes in Figure 1D)
- application―the prospective student formally registers their interest in completing a particular course (as shown by the purple boxes in Figure 1D)
- assessment—the TAFE assesses the prospective student's eligibility and suitability for their preferred course and may make them an offer (as shown by the orange boxes in Figure 1D)
- enrolment―both the prospective student and the TAFE complete the necessary steps to finalise the student's enrolment into their desired course (as shown by the blue boxes in Figure 1D).
In this report, we use the term 'enrolment process' to cover these four phases.
Figure 1D
The standard process for enrolling in a Skills First course
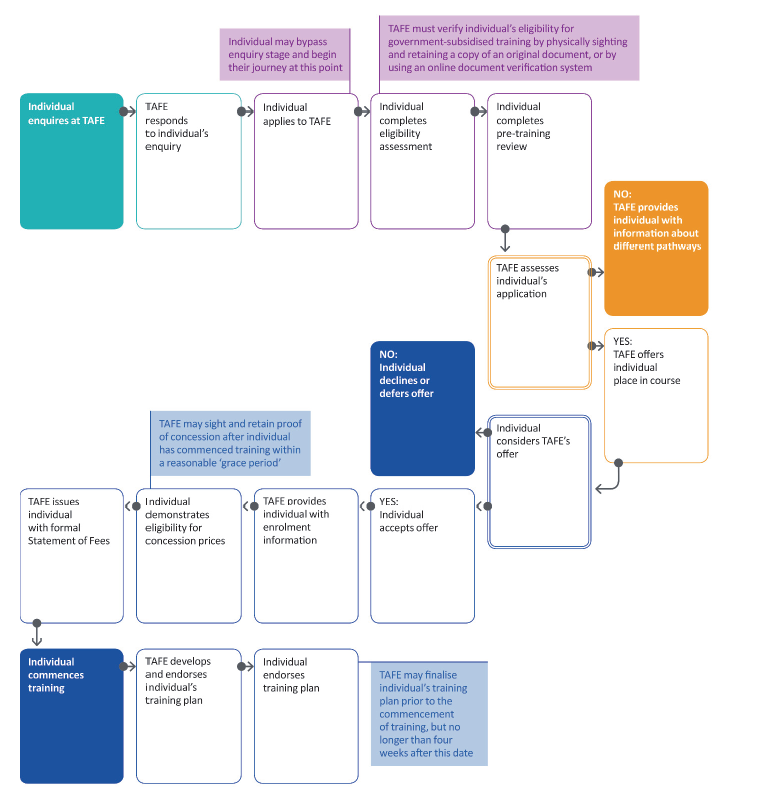
Note: Some study areas, such as nursing, design, and music, have additional entry requirements and more complex pathways.
Note: The coloured shapes designate enrolment start and end points for the prospective student; the clear shapes designate key touchpoints; and the double-lined shapes designate a decision point.
Source: VAGO.
1.6 Why this audit is important
The VET sector receives significant funding from the Victorian Government each year. In 2018–19, the government invested $644 million in high-quality training through the TAFE and training sector, including $172 million over four years to the Free TAFE initiative. By minimising or removing the cost of education for the student, Skills First aims to make VET more accessible to Victorians without post‑school qualifications, including those who face additional barriers, such as learning difficulties.
It is a government priority to increase VET participation among disadvantaged learners, or individuals who want to change careers. It is important, therefore, for TAFEs to have efficient and effective enrolment processes.
The findings of the Independent Broad-based Anti-corruption Commission's 2017 Operation Lansdowne report also highlight the significant role of the department's contract with TAFEs in protecting the rights and interests of students, and the importance of ensuring VET providers use public funds for their intended purpose.
1.7 What this audit examined and how
We examined the efficiency of enrolment processes for individuals seeking to undertake Skills First training at five TAFEs:
- Box Hill
- Melbourne Polytechnic
- SuniTAFE
- Swinburne
- William Angliss.
We assessed whether TAFEs' enrolment processes are:
- compliant with the department's contract
- free from unnecessary and burdensome actions
- completed in a timely manner
- regularly reviewed to identify potential improvements.
We also considered the department's oversight of and support provided to TAFEs to meet their contractual requirements.
We examined the standard pathway of a domestic applicant seeking to enrol in a Skills First course. We did not investigate the enrolment process for:
- international students
- full-fee-paying students
- apprentices or trainees
- cohorts who require special assistance, such as non‑English‑speaking migrants.
Methods
Our audit methods included:
- mapping each TAFE's enrolment process, based on walkthroughs with staff and supporting documentation
- process mining TAFEs' information management systems to understand applicants' pathways from enquiry to finalising enrolment
- assessing the department's oversight and support role based on documentary evidence and agency discussions
- surveying prospective students about their experiences with TAFEs' enrolment processes.
We distributed our survey to 24 154 people who initiated the enrolment process at any of the five audited TAFEs between October 2018 and February 2019. We report the results of this survey in Appendix D.
We conducted our audit in accordance with the Audit Act 1994 and ASAE 3500 Performance Engagements. We complied with the independence and other relevant ethical requirements related to assurance engagements. The cost of this audit was $740 000.
1.8 Report structure
The remainder of this report is structured as follows:
- Part 2 examines the efficiency of TAFEs' enrolment processes.
- Part 3 examines monitoring of TAFEs' enrolment processes.
- Part 4 examines how TAFEs' enrolment processes meet the contract's requirements.
2 Efficiency of enrolment processes at TAFEs
TAFEs should have efficient processes that support prospective students to finalise their enrolment. These processes should be free of unnecessary steps, duplicative information collection, and manual processing where possible.
In this Part, we examine the efficiency of TAFEs' enrolment processes.
2.1 Conclusion
Melbourne Polytechnic, SuniTAFE and William Angliss rely on manual processes to enrol students, which are inefficient and costly. In some cases, these TAFEs require prospective students to visit campus on one or more occasions to finalise their enrolment, which can be inconvenient for students and burdensome for staff.
In contrast, Box Hill and Swinburne have an online enrolment process, while providing on-campus help to those who need it. This flexibility benefits both the TAFE and the prospective student, as the former can use its resources more efficiently, while the latter can enrol in a way that suits their personal needs.
The department's open-ended contractual requirements for considering a prospective student's literacy and numeracy skills further drives inefficiency in TAFEs' enrolment processes. Until the department clarifies when and how testing should occur, most TAFEs will continue using burdensome methods that do not consider an individual's educational background.
All TAFEs face similar challenges to integrate their information management systems and move more enrolment steps online. Rather than working in isolation to address the same issues, there could be significant sector‑wide efficiency gains if the department and TAFEs work together on system development.
2.2 TAFEs' information management systems
To efficiently capture information about prospective students and avoid unnecessary and burdensome actions, TAFEs' information management systems should integrate with their enrolment processes. Swinburne and Box Hill's enrolment process is entirely online, although prospective students applying for concession prices still need to verify their eligibility in person. The other three TAFEs instead rely on manual processes to collect information, which increases the risk of human error and inefficiencies. These TAFEs have introduced additional quality assurance processes to mitigate this risk.
Efficient online system integration
All TAFEs use a combination of third-party software programs to capture information about prospective students. TAFEs use a customer relationship management (CRM) system to communicate with individuals when they enquire about training, and a student management system (SMS) to collect and administer information about key enrolment steps. Some TAFEs also employ a separate finance system to process tuition fees. Most TAFEs use different versions of the same CRM and SMS products, which they configure differently.
|
Manual intervention increases the risk of human error as staff must physically transpose important enrolment‑related information from one medium to another. This double handling may lead to inaccurate or incomplete data entry, or misplaced documents. |
At Swinburne, prospective students must register for an account prior to accessing the online applications portal. These accounts, like the portal itself, form part of Swinburne's SMS, which allows easy transfer of information from one repository to another. Swinburne's data integration mitigates the risk of human error, as it eliminates manual intervention.
In addition, Swinburne has embedded links to third-party programs, such as a literacy and numeracy assessment platform, into its online applications portal. The results of the literacy and numeracy test flow automatically into prospective students' accounts, further reducing the risk of error from manual data entry. Overall, Swinburne's data integration methods ensure staff can promptly access information, enabling them to effectively plan and timetable classes.
In March 2019, Box Hill began to implement a similar online system, where prospective students register an account prior to starting their application. As with Swinburne, this procedure has led to efficiencies. Box Hill is progressively phasing out its older process, which collects enrolment-related information using paper forms and takes an admissions officer up to 30 minutes to finalise a single application. Its new system uses minimal paper forms and needs less manual intervention. Currently, Box Hill accepts online applications for nearly 200 domestic courses.
|
'Remote' describes processes that prospective students can complete offsite using electronic documents, an online account, or email, and do not require visiting a TAFE's campus. |
Prospective students at Box Hill and Swinburne have greater flexibility, as they can finalise their enrolment without making an in-person visit to campus. Box Hill, however, requires prospective students to have remote interactions with an admissions officer at two stages, which may lengthen the process. Both Box Hill and Swinburne still accept paper‑based applications and offer various support services to individuals who have difficulties self‑managing their enrolment. We outline Swinburne's support services in Figure 2A.
Figure 2A
Enrolling at Swinburne with optional assistance
|
In late 2016, Swinburne introduced a drop-in help centre—known as the 'enrolment hub'—for prospective students struggling to self-manage the admissions process. The enrolment hub operates full-time in the three weeks preceding the start of each semester and aims to resolve issues without onwards referral. Swinburne surveys visitors so it can track the reasons for their attendance, which helps staff to identify recurrent issues. In addition, to help individuals manage the enrolment process remotely, Swinburne has a range of online guidance, including fact sheets and videos. Prospective students can also book a phone appointment with a course adviser, and chat online to an admissions officer. Swinburne also encourages individuals to book one-on-one help sessions for more targeted, on-campus support. |
Source: VAGO, based on Swinburne's documents.
Reliance on manual processes
Melbourne Polytechnic, SuniTAFE and William Angliss mostly use paper‑based and some electronic forms to capture critical enrolment-related information. In contrast with Swinburne and Box Hill, these electronic forms do not automatically feed into the TAFEs' information management systems. Admissions staff must manually copy the information into the relevant SMS field. This double handling often occurs after the individual has finalised their enrolment, which may delay TAFEs' access to consolidated data.
SuniTAFE and Melbourne Polytechnic use additional staff resources to manage the manual activity in their processes. SuniTAFE has previously hired a temporary admissions officer to scan enrolment-related documents for storage, while Melbourne Polytechnic contracts a third-party records management company for the same purpose. These resources put a financial burden on SuniTAFE and Melbourne Polytechnic, which may divert funds from other initiatives.
|
A document verification service is an online service that verifies an individual's identity. |
Although Box Hill has enhanced its efficiency over the past four months, some elements of its new system still rely on manual processing. For example, unlike Swinburne, Box Hill has not embedded a link to a document verification service within its online application. Instead, it requires prospective students to upload a copy of their evidence of eligibility, which staff then independently check using the document verification service. Box Hill intends to embed a direct link as its new system matures.
Its current procedure, however, is less burdensome than that employed by Melbourne Polytechnic and William Angliss, which require individuals to physically attend campus so that staff can sight and retain evidence of their identifying documents.
Figure 2B shows whether the enrolment steps at each audited TAFE are automatically recorded in their information management systems.
Figure 2B
TAFE enrolment steps automatically recorded in their information management systems
|
Enrolment step |
Box Hill |
Melbourne Polytechnic |
SuniTAFE |
Swinburne |
William Angliss |
|---|---|---|---|---|---|
|
Processing the Skills First declaration form |
✔ |
✘ |
✘ |
✔ |
✘ |
|
Assessing and retaining evidence of eligibility |
✘ |
✘ |
✔ |
✔ |
✘ |
|
Processing the pre-training review questions |
✔ |
✘ |
✘ |
✔ |
✘ |
|
Processing the standard enrolment questions in the Victorian VET Student Statistical Collection Guidelines |
✔ |
✔ |
✘ |
✔ |
✘ |
|
Generating the Statement of Fees |
✘ |
✔ |
✘ |
✔ |
✘ |
|
Finalising enrolment into individual course units |
✘ |
✘(a) |
✘ |
✔ |
✘ |
|
Generating the training plan |
n/a(b) |
✘(c) |
n/a(b) |
✔ |
✘ |
|
Assessing and retaining evidence of concession |
✘ |
✘ |
✘ |
✘ |
✘ |
Note: This figure tests Box Hill's new enrolment process, including its online applications system. Box Hill's older process (which is being phased out) can be seen in Appendix C.
Note: '✔' indicates an enrolment step that is automatically recorded in the TAFE's information management systems. '✘' indicates an enrolment step involving manual processes.
(a) Melbourne Polytechnic advises that it plans to make this step electronic, but the expected timing is not yet confirmed.
(b) TAFE completes the training plan outside of the enrolment process.
(c) Melbourne Polytechnic advises that it will implement electronic training plans for all courses by December 2020.
Source: VAGO.
Checking manual processes
To mitigate the risk of human error, admissions officers at three audited TAFEs use hard-copy checklists to ensure that each prospective student's data is complete and accurate. Box Hill uses one audit checklist as part of its older process. Melbourne Polytechnic and SuniTAFE use two audit checklists, which staff utilise at different steps.
While it is positive that these TAFEs have implemented quality assurance processes to improve the integrity of their data, these checklists do not address the root cause of errors—manual processing.
2.3 Options for completing enrolment steps
TAFEs should offer prospective students the option to enrol online, in-person, or by a combination of these methods. By providing greater choice, TAFEs can limit their one-on-one interactions to individuals who specifically request them, which should improve efficiency through optimised resourcing.
Swinburne and Box Hill allow individuals to choose the enrolment method that suits their needs—online or in-person—while the other three audited TAFEs require individuals to complete some enrolment steps in person. Despite these differences, our survey results show that prospective students at each audited TAFE most commonly found their enrolment experience to be easy.
Prospective students' preferences
|
To use Centrelink Confirmation eServices, TAFEs need to apply for a contract with the Australian Department of Human Services. The system is free to use, but there are set-up and testing fees, as well as privacy considerations. Only students who identify as Aboriginal and/or Torres Strait Islander are eligible for concession prices at all qualification levels. Concession ordinarily applies to students enrolled in courses at the Certificate IV level and below. |
The highest proportion of survey respondents across all TAFEs used a mix of online and in-person processes. However, SuniTAFE had the smallest proportion of individuals who reported enrolling online. When given the choice, respondents from Box Hill, Swinburne, and William Angliss mostly preferred online enrolment, while respondents from Melbourne Polytechnic and SuniTAFE equally preferred online and in-person processes. These results emphasise the importance of options, as respondents did not show an overwhelming preference for either choice.
Enrolment options at each TAFE
As highlighted in Section 2.2, while Box Hill and Swinburne enable most of their prospective students to enrol entirely online, individuals applying for concession prices still need to verify their eligibility in person. To further reduce manual in‑person steps, Box Hill and Swinburne could use the Centrelink Confirmation eServices system, which would enable staff to verify an individual's concession card status remotely and instantaneously, saving valuable time and resources. None of the audited TAFEs use this service, but Box Hill plans to implement it.
Figure 2C summarises the enrolment processes that each TAFE allows prospective students to complete remotely—either online or over the phone.
Figure 2C
Enrolment steps that prospective students can complete remotely
|
Enrolment step |
Box Hill |
Melbourne Polytechnic |
SuniTAFE |
Swinburne |
William Angliss |
|---|---|---|---|---|---|
|
Submitting an enquiry |
✔ |
✔ |
✔ |
✔ |
✔ |
|
Completing the Skills First declaration form |
✔ |
✔ |
✘ |
✔ |
✘ |
|
Providing evidence of eligibility |
✔ |
✘ |
✔ |
✔ |
✘ |
|
Completing the pre-training review questions |
✔ |
✘ |
✘ |
✔ |
✔ |
|
Completing the literacy and numeracy assessment |
✔ |
✔ |
✘ |
✔ |
✘ |
|
Completing the standard enrolment questions in the Victorian VET Student Statistical Collection Guidelines |
✔ |
✔ |
✘ |
✔ |
✔ |
|
Receiving the Statement of Fees |
✔ |
✔ |
✘ |
✔ |
✔ |
|
Enrolling into course units |
✔(a) |
✘(b) |
✘ |
✔ |
✘ (c) |
|
Paying fees |
✔ |
✔ |
✘ |
✔ |
✘ |
|
Endorsing the training plan |
n/a(d) |
✘(e) |
n/a(d) |
✔ |
✘ |
|
Providing evidence of concession |
✘ |
✘ |
✘ |
✘ |
✘ |
Note: This figure is based on Box Hill's new enrolment process, including its online applications system. Box Hill's older process (which it is phasing out) can be seen in Appendix C.
Note: '✔' indicates a step prospective students can complete remotely. '✘' indicates they cannot.
(a) Staff at Box Hill retroactively complete this step.
(b) Melbourne Polytechnic advises that remotely enrolling into units will be available for all courses, but the expected timing is yet to be confirmed.
(c) Individuals receive a hard-copy enrolment summary during an in-person appointment and then enrol into course units online during their appointment.
(d) TAFE completes the training plan outside of the enrolment process.
(e) Melbourne Polytechnic advises that it will implement electronic training plans for all courses by December 2020.
Source: VAGO.
In contrast to Swinburne and Box Hill, the other TAFEs require individuals to complete several key enrolment steps in person. For example, Melbourne Polytechnic requires prospective students to attend at least one on‑campus appointment. At this appointment, staff assess an individual's eligibility and suitability for training, then finalise their enrolment. SuniTAFE and William Angliss, in contrast, separate these activities into two discrete sessions.
While these appointments help TAFEs to effectively roster their staff, individuals must schedule visits within certain time frames. TAFEs also use third‑party booking applications to manage these appointments, which do not fully integrate with their CRM systems. The limited availability of appointments, coupled with the lack of alternate pathways, may disproportionately burden prospective students who have physical accessibility issues or other obligations, such as caring duties or employment commitments.
Melbourne Polytechnic and William Angliss rely on physically sighting an individual's proof of identity, which requires in‑person visits. In contrast, Box Hill, SuniTAFE, and Swinburne use online document verification services. While Melbourne Polytechnic and William Angliss have purchased licences to use a document verification service, they have not integrated it into their everyday processes. By using these systems, TAFEs could offer prospective students greater flexibility, while also saving time and resources.
This inefficiency may also stem from the department's unclear requirements and guidelines. While the department has advised TAFEs that the enrolment process can occur entirely online, the Guidelines about Determining Student Eligibility and Supporting Evidence state that 'eligibility assessment processes must involve informative discussions with applicants'. The department has advised us that these discussions could be in-person, online or by telephone.
Despite their reliance on in-person processes, Melbourne Polytechnic and William Angliss provide individuals with the ability to complete some tasks remotely. For example, Melbourne Polytechnic allows prospective students to pay fees online, and William Angliss allows prospective students to complete part of their pre‑training review at home.
It is important to note that some prospective students will benefit from physically attending campus and receiving one-on-one help. For example, William Angliss organises its pre-enrolment appointments by course type. This allows prospective students to attend a presentation and interview with two faculty members, which may provide them with more personal insight into the content and learning outcomes of their preferred course. The second visit at William Angliss, however, is purely administrative.
Prospective students' experience
While respondents to our survey most commonly reported that their overall experience was easy, there was considerable variability in the time and effort reported by individuals to finalise their enrolment. To accurately compare survey responses across the audited TAFEs, we use confidence intervals to estimate the range within which we can be confident the true value lies for all individuals who may have enquired or enrolled. At a 90 per cent confidence level:
- 54 to 72 per cent of respondents at Swinburne did not make any in‑person visits
- the highest proportion of respondents at Box Hill (61 to 69 per cent), Melbourne Polytechnic (68 to 76 per cent), and William Angliss (43 to 61 per cent) made between one or two visits (however, all Box Hill respondents experienced the TAFE's older process)
- in-person visits at SuniTAFE varied, as respondents made between one or two (36 to 54 per cent) to three or more (23 to 41 per cent) in-person visits.
Our survey found that only a small proportion of individuals did not finalise their enrolment because the process was too difficult. At a 90 per cent confidence level, we estimate up to six per cent at Box Hill and Melbourne Polytechnic did so, and up to 10 per cent at SuniTAFE, Swinburne and William Angliss. We report the margin of error for each TAFE in Appendix D, which can be used to calculate the precise confidence interval for each TAFE.
2.4 Duplicative or unnecessary information collection
We found only minor instances of TAFEs collecting information that is duplicative or not required by the contract. For example:
- SuniTAFE and William Angliss collect similar information across their application forms and pre-training reviews, such as personal details, education and employment history, and reason for study.
- Melbourne Polytechnic collects an individual's Skills First declaration twice, using online and paper forms.
- SuniTAFE requires individuals to provide a physical signature for the pre‑training review form, though this is not a contractual requirement.
Literacy and numeracy testing
According to the contract, TAFEs must conduct a pre-training review for each prospective student. This helps TAFEs determine whether an individual's chosen course aligns with their competencies and interests. As part of this requirement, TAFEs must 'consider' whether each prospective student has appropriate literacy and numeracy skills, to determine whether they need further support from teaching staff to participate in the course.
Completing this step can be time-consuming and onerous for both the TAFE and the prospective student.
Burdensome for the TAFE
The contract does not prescribe how TAFEs should evaluate a prospective student's literacy and numeracy skills. Likewise, the department's optional pre‑training review template for 2019 only briefly suggests that TAFEs consider testing results, secondary school results, course requirements or previous qualifications. It does not further explain how TAFEs might implement these methods, either solely or in combination.
In the absence of detailed requirements, all TAFEs use third-party assessment platforms to administer literacy and numeracy tests to prospective students. Staff then use the results of these tests—which often differ in length—to establish whether individuals are suitable for enrolment in their chosen course. As highlighted in Figure 2C, some TAFEs supervise their literacy and numeracy tests on campus. This approach is resource intensive for the TAFEs, as it requires both a computer lab and supervisor.
Box Hill, Melbourne Polytechnic, SuniTAFE and William Angliss require all prospective students—regardless of their educational backgrounds—to complete the literacy and numeracy test. Only Swinburne allows individuals who have successfully completed Year 12 English and Mathematics in the past seven years to bypass the assessment. This interpretation of the contract alleviates some of Swinburne's administrative burden, as there are fewer components for staff to assess in an individual's pre‑training review. The other four TAFEs advise that they are wary of implementing a similar approach, as they lack assurance that the department's external auditors will accept other forms of evidence, such as the Victorian Certificate of Education (VCE) or the Victorian Certificate of Applied Learning (VCAL).
Despite being aware of TAFEs' uncertainty, the department has not sufficiently clarified this part of the contract. For example, the department's internal documents state that they have received 'a number of enquiries about whether certain tests or processes are acceptable', and there 'may be a need to clarify further with auditors to ensure a shared understanding of the requirements'. While the department advises that its current stance promotes 'flexibility', four of the five TAFEs apply a narrow approach to literacy and numeracy testing in the absence of further information.
|
The ACSF is a tool that helps English language, literacy and numeracy practitioners to describe an individual's performance in the five core skills of learning, reading, writing, oral communication, and numeracy. |
In contrast, the Australian Government's VET Student Loans scheme provides much clearer requirements regarding prospective students' literacy and numeracy skills. VET Student Loans Rules 2016 states that a provider may deem a student as academically suited to undertake a course if:
- the provider obtains a copy of a senior secondary certificate of education for the student's completion of Year 12, or
- the provider assesses the student as displaying competence at or above Exit Level 3 under the Australian Core Skills Framework (ACSF) for reading and numeracy—using an approved assessment tool—and the provider believes that the student displays that competence, or
- the provider obtains a copy of a certificate awarded to the student for a qualification that is either at or comparable to Level 4 (Certificate IV) or above in the Australian Qualifications Framework.
Burdensome for the prospective student
|
The Australian Qualifications Framework is the national policy for regulated qualifications in Australian education and training. |
For most individuals who have obtained other qualifications at the VET level or beyond, undertaking a formal test to prove their literacy and numeracy capabilities is likely unnecessary. This extends to people with VCE and VCAL qualifications, as the former's key outcome—an Australian Tertiary Admission Rank—is the primary criterion for entry into most undergraduate programs.
In addition, the blanket requirement for literacy and numeracy tests means that individuals with proven capabilities must spend additional time enrolling, sometimes up to an hour. Prospective students must also resit the test if they apply to different institutions or enrol in additional qualifications, as TAFEs do not share results. As shown in Figure 2C, SuniTAFE and William Angliss require prospective students to sit the test on campus, which may add to their burden.
2.5 Future plans
All audited TAFEs are working to improve their enrolment processes and develop more integrated information management systems that enable online enrolment:
- Box Hill launched its new online applications system in March 2019 and aims to receive 90 per cent of its applications through this system by 2020.
- Melbourne Polytechnic recently began a Student Experience Improvement Program, to move towards a more integrated online enrolment system.
- SuniTAFE and William Angliss began separate projects in 2018 that focus on reforming the enquiry and application stages.
- Swinburne is improving the readability of its pre-training review questions for prospective students. It is also developing an assessment matrix to help staff make more informed and consistent decisions on prospective students' suitability for government-subsidised training.
These initiatives should lead to efficiency gains and an improved enrolment experience. However, the sector could significantly improve its efficiency if TAFEs worked together, as they face similar challenges, and—in most cases—use similar underlying software. By sharing their knowledge and resources, TAFEs could collaborate on system development, without duplicating effort.
Potential shared solutions could include the development of:
- a standardised enrolment system, where TAFEs retain full control over their end-to-end processes, but use consistent business rules and the same information management systems
- a centralised enrolment system, where prospective students apply using a single portal. This would standardise the first part of the enrolment process by enabling prospective students to express interest at multiple TAFEs through a single application. The system could then direct prospective students to the relevant TAFE, ideally using a data-sharing mechanism that integrates with each TAFE's SMS.
3 Monitoring enrolments at TAFEs
In this Part, we examine whether TAFEs routinely monitor the efficiency and effectiveness of their enrolment processes. This oversight is important, as understanding the strengths and weaknesses of their practices will help TAFEs improve the enrolment experience for prospective students.
3.1 Conclusion
Some TAFEs cannot comprehensively assess the timeliness and effectiveness of their enrolment processes, which affects their ability to improve efficiency. Melbourne Polytechnic, SuniTAFE and William Angliss rely on manual processes, meaning they cannot scrutinise the time taken for prospective students to complete critical enrolment-related tasks.
Despite this limitation, William Angliss—like Box Hill and Swinburne—does track conversion between key steps in their enrolment processes. This analysis is important, as high conversion rates suggest that TAFEs adequately support prospective students through the enrolment process.
By better understanding their enrolment processes, TAFEs can optimise their limited resources, which will enable them to operate more efficiently.
3.2 TAFEs' monitoring methods
TAFEs collect data to assess their:
- Conversion rates—the proportion of prospective students who progress between key points in the enrolment process. Box Hill, Swinburne and William Angliss track this data.
- Customer service levels—the extent to which prospective students receive timely and efficient support from TAFEs. Box Hill, Swinburne, and William Angliss monitor and report against these.
- Prospective students' feedback—the systematic collection and analysis of individuals' experiences and observations. All TAFEs—except SuniTAFE—systematically collect feedback from prospective students.
Monitoring progression through the enrolment process
As shown in Figure 3A, a TAFE's pool of prospective students will diminish throughout the enrolment process. Both TAFEs and prospective students drive this attrition. For example, staff may conclude that an individual's chosen course does not align with their career aspirations, or successful candidates may reject, defer, or lapse their offer. Examining the underlying reasons for this attrition would help TAFEs to identify and address issues, such as process bottlenecks, that might deter prospective students. TAFEs can then maximise the number of prospective students who progress, therefore increasing their conversion rates.
Figure 3A
The enrolment funnel
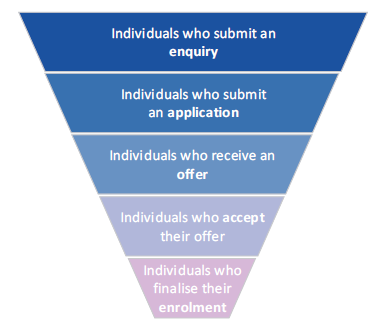
Note: While this funnel does not capture all key steps in each TAFE's unique process, it conceptualises enrolment trends in educational institutions.
Source: VAGO.
Measuring conversion rates
By measuring conversion, TAFEs can provide a good foundation for internal benchmarking and implement targeted improvement initiatives. To measure conversion, TAFEs must collect data on the basic outputs of their enrolment processes. All TAFEs collect and report on these outputs with varying degrees of frequency and formality. Box Hill and William Angliss also have dashboards that provide real-time access to enquiry and application data.
As shown in Figure 3B, all five TAFEs measure their end-to-end conversion—the proportion of individuals who initially expressed interest that later finalised their enrolment.
Figure 3B
End-to-end conversion measures used
|
Measure |
Box Hill |
Melbourne Polytechnic |
SuniTAFE |
Swinburne |
William Angliss |
|---|---|---|---|---|---|
|
Enquiry to enrolment |
✔ |
✔ |
✔ |
✘ |
✔ |
|
Application to enrolment |
✔ |
✔ |
✘ |
✔ |
✘ |
Note: TAFEs' end-to-end points differ due to their unique enrolment processes—see Appendix C.
Source: VAGO, based on TAFEs' documents.
Figure 3C shows the key touchpoints in each TAFE's enrolment process. TAFEs currently measure the conversion rates between points marked by the blue arrows, but do not measure those marked by the orange arrows. Without conducting this more granular analysis, TAFEs may struggle to identify specific points of attrition, impairing their ability to identify and address issues.
Figure 3C
Current and potential measures of conversion
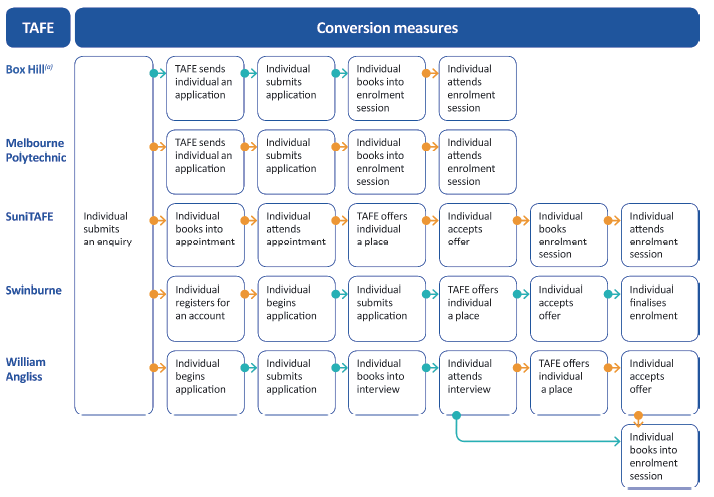
(a) We have analysed Box Hill's reporting against its old process (as shown in Figure C2 of Appendix C).
Note: Blue arrows represent points of transition that a TAFE currently measures in terms of conversion. Orange arrows represent transition points that are not measured. William Angliss also measures transition rates between two non-sequential touchpoints.
Note: These points are critical actions in each TAFE's enrolment process—refer to Appendix C for more comprehensive process maps. This chart also assumes that prospective students successfully finalise their enrolment with minimal issues.
Source: VAGO.
In contrast to Melbourne Polytechnic and SuniTAFE, Box Hill, William Angliss, and Swinburne have the capability to assess the rates of transition between several of their key touchpoints. This analysis should provide TAFEs with further insight into the behaviour of their prospective students, which may help staff to improve their processes. Box Hill also attempts to contact disengaged individuals to understand why they withdrew from the enrolment process, and records their reasons using a standardised list. Capturing this information helps Box Hill to identify and address enrolment issues from the user's perspective.
The example in Figure 3D highlights the benefits of routinely collecting and analysing this information.
Figure 3D
Swinburne's VET Onboarding Taskforce
|
In March 2017, Swinburne created the VET Onboarding Taskforce—a multidisciplinary team focused on removing organisational barriers to an efficient and effective enrolment process. To achieve this goal, Swinburne enhanced its oversight of prospective students' key transition points, including the proportion of applicants who receive an offer, accept their offer, and finalise their enrolment. In early 2018, Swinburne used this information to deliver specialised support to individuals with incomplete applications and unaccepted offers through targeted email and phone campaigns, as well as drop-in sessions. This resulted in:
The taskforce also assessed the efficacy of Swinburne's enrolment processes, systems, and documentation to identify further opportunities for improvement. As part of this analysis, Swinburne conducted usability testing with students to ensure that any changes to its enrolment process would yield the intended results. |
(a) 'Admitted' individuals are those who have received an offer to study at Swinburne.
Source: VAGO.
While all TAFEs measure their basic enrolment outputs, most do not assess this information in a strategic manner. Swinburne, however, produces biannual reports that break down the critical six-week period prior to the start of each semester. These reports analyse the barriers and enablers to Swinburne's success, and highlight their commitment to continuous improvement.
In these reports, Swinburne analyses the volume and subject of its enquiries, as well as their originating channels. Evaluating this information allows Swinburne to more efficiently allocate its resources during peak enrolment periods. For example, it identified that Monday is typically the busiest day of the week for enquiries. It has also observed that prospective students tend to apply 'at the last minute', causing a spike in activity towards the end of the enrolment period. This behavioural analysis helps Swinburne ensure that staff are in the right place at the right time.
Monitoring customer service
To thoroughly assess the efficacy of their enrolment practices, TAFEs need performance measures that assess how staff interact with prospective students. Customer-focused performance measures, such as timeliness, provide valuable insight into the prospective students' journey from enquiry to enrolment, as they assess the implementation of a service as opposed to its outcome. These measures help staff isolate the cause of any downward trends in their conversion rates, as inefficient internal decision-making may exacerbate attrition. Box Hill, Swinburne and William Angliss report against enrolment‑related customer service standards, to varying extents.
Swinburne assesses its performance biannually against various service standards, including:
|
Individuals can call or attend studentHQ to receive advice from Swinburne staff. |
- the average wait time and handle time per in-person enquiry at each studentHQ location
- the average wait time and handle time per phone enquiry
- the proportion of phone calls that prospective students abandon.
Swinburne encourages staff to focus on prospective students' enrolment experience. By prioritising the delivery of prompt information to prospective students, Swinburne may gain a competitive edge in the demand-driven environment.
Reporting against these service standards also helps Swinburne understand whether changes in their conversion rates are due to internal or external factors. For example, in early 2016, Swinburne identified that wait and handle times for both phone and in-person enquiries had significantly increased over the previous year. Swinburne attributed these longer times to improved staff training, which allowed admissions officers to resolve complex issues on‑the‑spot without the need for onwards referral. To mitigate this issue and its impact on prospective students, Swinburne opened a third studentHQ location at its Hawthorn campus in January 2017. This resulted in reduced wait and handle times at the TAFE's other studentHQ locations.
Box Hill and William Angliss also assess their performance from a customer service perspective. Box Hill monitors the number of phone calls received, the number of phone calls that each admissions officer handles, as well as prospective students' hold times. This information informs Box Hill's resourcing decisions. William Angliss' customer service standards form part of its admissions officers' performance and development cycles, and include:
- the proportion of phone calls that prospective students abandon
- the average wait time for each phone enquiry
- the number of online enquiries and applications cleared daily
- the number of voicemails cleared daily
- the number of emails cleared daily.
While Box Hill and William Angliss encourage high-quality customer service by monitoring this aspect of performance, they do not use their findings to inform their improvement initiatives.
Melbourne Polytechnic and SuniTAFE do not perform similar customer‑focused reporting. This hinders their ability to understand changes in their conversion rates and their prospective students' enrolment experience.
Prospective students' feedback
Traditionally, educational institutions have focused on students' satisfaction with training and assessment as opposed to the effectiveness of support services, such as enrolment. Institutions that neglect this analysis lack critical information, as they do not holistically consider the full suite of services that may contribute to an individual's sense of satisfaction. Collecting and analysing prospective students' feedback on the enrolment process to understand its impact may help TAFEs improve their conversion rates.
All audited TAFEs, except for SuniTAFE, use various mechanisms to collect feedback from prospective students about their enrolment processes.
Box Hill
In 2017, Box Hill commissioned consultants to design and implement a survey tool to better understand why students study at the TAFE. The optional, one‑off survey contained seven free-text fields and 41 questions, seven of which related to enrolment.
Box Hill's enrolment-related questions reflect those that ASQA uses during its five‑yearly audits of training providers. To inform the scope of its audits, ASQA surveys students to identify potential areas of concern. ASQA's enrolment‑related questions focus on compliance with the Standards for Registered Training Organisations 2015.
As a result, Box Hill's questions primarily assess whether staff conveyed critical enrolment-related information in a clear and accurate manner. While this provides insight regarding its staff's communication skills, its questions do not assess other elements of enrolment, such as timeliness or convenience. By incorporating these elements, Box Hill could better understand any procedural barriers to prospective students' enrolment.
Box Hill adapted this tool in 2019 to create a new course evaluation survey. This survey contains enrolment-related questions that broadly reflect the themes of the 2017 version. Staff administer the survey to individuals at the end of their course, which highlights Box Hill's commitment to understanding and improving the student experience.
Melbourne Polytechnic
In late 2016, Melbourne Polytechnic developed a survey tool that sought to evaluate the prospective student's journey from enquiry to enrolment. In contrast to Box Hill, Melbourne Polytechnic's survey focuses exclusively on the enrolment process. This provides Melbourne Polytechnic with step‑by‑step insight into the strengths and weaknesses of its enrolment procedures, such as marketing and communication, the enquiry and application process, the conduct of the pre-training review, and training plan development. Overall, Melbourne Polytechnic's survey provides detailed information regarding its process, which should enable staff to action various student‑centred improvements.
Melbourne Polytechnic administered the survey twice in 2017. However, it has been under review since 2018.
SuniTAFE
SuniTAFE does not administer enrolment-related surveys or conduct other student‑centred research. This means that it lacks critical information about prospective students' enrolment experience, which affects its ability to identify inefficiencies and undertake corrective action.
Swinburne
Since mid-2015, Swinburne has administered two surveys to individuals who utilise its specialist support services, including:
- Ask George—an email application that responds to prospective students' frequently asked questions by analysing keywords
- the enrolment hub—an on-campus location that provides on‑the‑spot assistance to prospective students on the enrolment process.
Swinburne manages the first survey through a follow-up email. This survey aims to enhance the quality of Swinburne's generic information material. At the enrolment hub, Swinburne has tablets available for prospective students to complete the second survey immediately after their visit. The survey asks prospective students whether staff successfully resolved their issue without onwards referral.
In contrast to Box Hill and Melbourne Polytechnic, Swinburne extends its surveys to individuals who did not finalise their enrolment. By including this additional perspective, Swinburne enhances its ability to identify procedural barriers that may impact its end-to-end conversion rate.
William Angliss
William Angliss emails a brief survey to all prospective students who interact with its customer service team. The survey asks individuals to rate the support they received from staff as either satisfactory or unsatisfactory. This allows William Angliss to assess the efficacy of its ongoing interactions with students, which may lead to service improvements. Like Swinburne, William Angliss's survey includes respondents who may not necessarily finalise their enrolment, thus offering a wider perspective.
In addition, William Angliss ran a focus group in July 2018 with five domestic students to better understand their enrolment experiences.
Free TAFE Student Experience Minimum Service Standards
As steward of the education system, the department plays a significant role in supporting TAFEs to deliver high-quality services. However, in the absence of mandatory reporting requirements, TAFEs have no incentive to embed the department's best practice standards into their everyday operations.
In late 2018, the department developed minimum service standards in consultation with TAFEs to improve the enrolment process for people interested in Free TAFE courses. As shown in Figure 3E, these standards encourage TAFEs to help prospective students through the enquiry and application process in a timely manner by providing a more consistent experience.
Figure 3E
Free TAFE Student Experience Minimum Service Standards
|
Student interest |
|---|
|
|
Application and offer |
|
|
Maintaining interest |
|
|
Completes enrolment |
|
Source: VAGO, based on documentation from the department.
TAFEs have not embedded the service standards into their performance monitoring and reporting frameworks for Free TAFE courses. However, Box Hill advises that it is in the process of doing this for all courses. The department is also yet to apply any system‑wide monitoring requirements using these service standards. In embedding them, the department and/or TAFEs would need to develop corresponding targets for meaningful performance measurement. In addition, some TAFEs may need support from the department to develop their capability to report against these standards.
The department and TAFEs could apply these standards beyond Free TAFE courses to the broader Skills First program. Doing so could lead to system‑wide improvements to the consistency, responsiveness, and timeliness of the enrolment processes.
3.3 Limitations of TAFEs' enrolment data
To effectively scrutinise their enrolment performance, TAFEs require information that is complete, accurate, and consistent. Most TAFEs' information management systems and associated enrolment processes do not enable this type of data collection, impacting the quality of their performance reporting. This hinders TAFEs' ability to identify and resolve performance issues.
To assess the efficiency of TAFEs' enrolment processes, we undertook walkthroughs with each institution. At these walkthroughs, we followed the pathway of a typical domestic applicant seeking to enrol in a government‑subsidised course. Our primary aims were to:
- experience each TAFE's enrolment process from prospective students' viewpoint
- understand how each TAFE's data collection procedures work in practice, including how and when they capture critical information.
|
Process mining is an analytical method that helps the user understand different workflows with the aim of improving their efficiency. It involves extracting and evaluating a workflow's key data points over a designated period to show common and unique pathways. |
We examined prospective students' pathways through the enrolment process at four of the five TAFEs using process mining software. Process mining is an exploratory approach that shows the order in which prospective students complete critical tasks, as well as the time taken to perform each step. Process mining has the potential to illuminate key points of attrition, irregular pathways, bottlenecks, or other inefficiencies.
To perform this analysis, we identified the data points that represent TAFEs' unique, end-to-end enrolment processes. We then requested an extract of each prospective student's pathway through these data points, regardless of whether they finalised their enrolment.
As Melbourne Polytechnic, SuniTAFE and William Angliss use manual processes to collect enrolment‑related information, we could not extract real-time data points for certain tasks. We encountered the same issue when extracting data points from Box Hill's old enrolment system, but their new system provided us with higher-quality, real‑time information. Given this reliance on manual practices, as well as the differences in each TAFE's process, we could not meaningfully compare individual enrolment step timeliness across the five institutions.
Despite these issues, we were able to compare the overall time taken to process an individual's enrolment at three TAFEs—Swinburne, Melbourne Polytechnic and William Angliss—using process mining software. Our results showed, at the 50th percentile, that Swinburne took the least time to process an individual's enrolment (six days), followed by Melbourne Polytechnic (10 days) and William Angliss (61 days). Swinburne enables prospective students to complete the enrolment process online, while Melbourne Polytechnic requires one in-person visit and William Angliss requires two in-person visits.
We tested the median enrolment times and found statistically significant differences between TAFEs at a 95 per cent confidence level. Appendix E shows more details of the statistical methodology used to establish this.
Our process mining offered valuable insights into TAFEs' information management systems and their ability to conduct performance reporting. For example, the prevalence of divergent pathways suggests that TAFEs may lack strong data integrity rules and as a result do not accurately or consistently record interactions with prospective students in their SMS or CRM. This limitation means that some TAFEs do not have complete oversight of each prospective student's journey through the enrolment pipeline, which may affect their ability to identify attrition issues.
Likewise, the prevalence of manual processing and associated lack of data points affects some TAFEs' ability to systematically assess key aspects of their performance, such as timeliness. This means that some TAFEs will struggle to report against the department's Free TAFE minimum service standards, particularly those that focus on turnaround times. The differences in TAFEs' information management systems and enrolment processes also compromise the department's ability to conduct sector-wide analyses.
4 TAFEs' compliance with the VET funding contract
TAFEs are eligible for funding only if they meet the department's contractual requirements, including those relating to enrolment. TAFEs must demonstrate that they have enrolled only eligible students, correctly applied student fees and charges, and assessed course suitability for individual students.
In this Part, we examine how TAFEs' enrolment processes comply with the contract's requirements, focusing on whether:
- enrolment processes are clearly documented and compliant
- the department effectively supports and monitors TAFE compliance
- TAFEs effectively monitor their own compliance.
4.1 Conclusion
TAFEs are committed to meeting the contract's enrolment requirements, however, they are unable to do this consistently.
Despite departmental efforts to clarify requirements, inconsistencies between the contract and the department's monitoring frameworks prevent a common understanding of how to comply. Gaps in TAFEs' documented enrolment processes further limit their ability to consistently comply, and increase the risk of ineligible or unsuitable enrolments.
4.2 Documenting TAFE enrolment processes
Under the contract, TAFEs must have a clear and documented business process for:
- assessing student eligibility for enrolling in a subsidised course or qualification under Skills First
- conducting the pre-training review to determine the most suitable training for an individual.
There are gaps both in the detail and currency of TAFEs' documented processes for assessing eligibility and conducting the pre-training review. This means TAFEs rely on other undocumented measures to help achieve consistency in these two areas. For example:
- Box Hill uses staff training presentations on how to complete the pre‑training review and eligibility assessment to augment their documented business processes.
- TAFE enrolment systems and forms often prevent enrolments from progressing without TAFEs entering specific information or completing checks.
Assessing student eligibility
Prospective students must meet the Skills First eligibility criteria, including the two‑course rule. TAFEs can exempt individuals from eligibility requirements under special initiatives, such as for retrenched workers, and exclude ineligible individuals, such as students enrolled in secondary schools.
To satisfy themselves about student eligibility, TAFEs must document their business processes for the key contractual requirements—assessing eligibility criteria, exemptions and exclusions, retaining evidence of eligibility, and completing the Skills First declaration form.
Figure 4A summarises whether each TAFE's documented business processes provide sufficiently detailed information about the eligibility requirements and whether they reflect the 2018–19 contract for each TAFE.
Figure 4A
TAFEs' documented business processes for assessing student eligibility
|
TAFE |
Detailed information(a) |
Meets current contract(b) |
|---|---|---|
|
Box Hill |
✔ |
✘ |
|
Melbourne Polytechnic |
✔ |
✘ |
|
SuniTAFE |
✘ |
✘ |
|
Swinburne |
✔ |
✔ |
|
William Angliss |
✔ |
✘ |
(a) The process provides detailed information on how to meet eligibility requirements.
(b) The process reflects the 2018–19 contract.
Source: VAGO.
In accordance with the contract, four TAFEs—Box Hill, Melbourne Polytechnic, Swinburne and William Angliss—have documented business processes that provide detailed information about eligibility criteria, exemptions, exclusions and how to apply these requirements. For example, William Angliss's business process includes a summary of common eligibility exemption scenarios and identifies the specific criteria that individuals are exempted from under each special initiative.
SuniTAFE's documented business processes for assessing eligibility do not have enough detail. For example, they identify that staff must assess individuals against Skills First eligibility criteria, but do not provide detailed information about the criteria themselves or how to apply the criteria.
Changes in the 2018–19 contract
The department updated the contract for 2018–19 to reflect government decisions about exemptions for specific cohorts of students from certain aspects of the Skills First eligibility criteria. It introduced specific exemptions to the two‑course rule, eligibility exemptions for new initiatives, increased the proportion of exemptions allowed, and introduced new formats for TAFEs to sight and retain evidence of eligibility. Four of the five TAFEs do not reflect all these changes in their documented business processes for assessing eligibility.
The department also made some key improvements to enrolment requirements in the 2018–19 contract. We discuss these in detail in Section 4.3. The improvements allow TAFEs to use a document verification service to sight and retain evidence of eligibility and allow individuals to use electronic signatures to endorse the Skills First declaration form. Box Hill, Swinburne and SuniTAFE use a document verification service to check evidence of eligibility and have updated their business processes to reflect this change. Swinburne and Melbourne Polytechnic use electronic signatures to complete the eligibility declaration form, but have not updated their business processes to reflect this change.
Pre-training review
The contract requires TAFEs to determine the most suitable course for an individual prior to enrolment. TAFEs do this through the pre-training review, which must have a documented business that considers an individual's:
- aspirations and interests
- educational attainment and capabilities
- literacy and numeracy skills
- prior learning or competencies
- digital capability (when training is delivered online)
- capacity to undertake the course learning strategies and materials.
Each TAFE must document how it assessed course suitability for each individual and retain evidence of conducting the pre-training review.
Figure 4B summarises our assessment of each TAFE's business process for conducting the pre-training review.
Figure 4B
TAFEs' documented business processes for the pre-training review
|
TAFE |
Detailed information(a) |
Meets current contract(b) |
|---|---|---|
|
Box Hill |
✘ |
✔ |
|
Melbourne Polytechnic |
✘ |
✘ |
|
SuniTAFE |
✘ |
✘ |
|
Swinburne |
✘ |
✔ |
|
William Angliss |
✘ |
✔ |
(a) The process provides detailed information on how to assess suitability.
(b) The process reflects the 2018–19 contract.
Source: VAGO.
None of the five TAFEs' documented business processes provide detailed information about the thresholds they use to determine the suitability of an individual's aspirations, capabilities, prior learning, or digital capability, or if course learning strategies are appropriate. For example, a pre-training review should include defined learning supports and reasonable adjustments for individuals with identified learning disabilities, to ensure that staff consistently assess if individuals have the capabilities to undertake the training.
TAFEs' business processes do include thresholds for minimum literacy and numeracy levels, using the ACSF. While the pre-training review is a qualitative assessment, clearly documenting suitability thresholds for each pre‑training review component will reduce the risk of inconsistent assessments.
Changes to the 2017 contract
In the 2017 contract, the department introduced a new pre-training review requirement for TAFEs to identify an individual's digital capability and access to technology when portions of the course are delivered online. Three of the five TAFEs—Box Hill, Swinburne, and William Angliss—have documented business processes that include this requirement, but do not include detail about how to assess it. Melbourne Polytechnic and SuniTAFE have not updated their documented business processes to reflect this change.
4.3 Department monitoring and support
The department must make the contract's compliance requirements as easy to understand as possible. It should also have mechanisms to monitor TAFEs' contractual compliance, and to identify opportunities for improvement.
The department provides wide-ranging advice and support that helps clarify TAFEs' enrolment obligations under the contract. It has also made several key contract improvements that make it easier for TAFEs to comply. However, the department's compliance monitoring of TAFEs is sometimes inconsistent with the contract's enrolment-related clauses.
Communicating the contract's enrolment requirements
The department has effectively communicated the contract's enrolment requirements to TAFEs by:
- running TAFE workshops during 2018 to clarify the contract's enrolment requirements—all 16 TAFEs attended one of these workshops, which were highly rated in participants' evaluations
- supplying various guidelines and tools to clarify enrolment obligations regarding student eligibility, data collection, record keeping, and tuition fees
- issuing notifications when it amends contractual requirements relating to enrolment, and supplying a curated version of the contract in October 2018 that incorporates prior amendments
- responding to 36 enrolment-related TAFE enquiries submitted through the SVTS during 2018, with 32 of these resolved within one month.
However, as noted in Section 2.4, the department needs to more clearly communicate the contract's requirements for considering an individual's literacy and numeracy skills.
Departmental monitoring of contract compliance
The department monitors TAFEs' compliance with the contract through its Skills First Audit and Assurance Program. This aims to:
- confirm that TAFEs spend Skills First funding appropriately
- confirm that TAFEs provide students with quality training services
- gain assurance that TAFEs have capacity to comply with the contract
- identify opportunities for improvement in TAFE business processes and controls.
The department outsources the delivery of its annual audit program to a provider panel consisting of four contractors. The program includes eight audit types that may examine enrolment activities.
The department's audit and assurance program provides a sound, high-level framework for assessing whether TAFEs enrol students in accordance with the contract. The annual audit program:
- is risk-based and includes both planned audits and off-cycle audits that respond to matters that have come to the department's attention
- enables examination of TAFEs' enrolment-related business processes, controls and detailed transactions
- enables targeted assessments of key enrolment requirements in line with the contract, including evidence of eligibility, granting of fee concessions and completion of the pre-training review
- requires that the auditor and TAFE agree on a rectification plan to address audit findings within a set time frame. The TAFE must then report to the department on its progress within six months.
Departmental audits of TAFEs against the 2017 contract
Despite having a range of audit types available, the department has used only one in the TAFE sector since October 2017—the Quality Review. Compared with other audit types that examine contractual compliance from a transactional perspective, the Quality Review has a broader, more qualitative focus. Despite this, Quality Reviews also have some focus on how TAFEs' enrolment processes comply with the contract in relation to the students' pre-training review.
The department advised that it took this narrow approach to TAFE compliance auditing because it had previously focused on auditing TAFEs' business process and transactional compliance with the contract, and it decided to shift to the qualitative aspects of TAFE performance.
We reviewed four of the eight TAFE Quality Reviews scheduled across 2017 and 2018, two of which examined a TAFE included in our audit. The department advised that the remaining four Quality Reviews are still in progress, despite all being scheduled for completion in either 2017 or 2018.
Each of the four completed Quality Reviews found that the audited TAFE had not complied with the contract's requirements for completing the pre‑training review. Figure 4C summarises these non-compliances.
Figure 4C
Pre-training review non-compliances from 2017–18 TAFE Quality Reviews
|
Non-compliance |
TAFE 1 |
TAFE 2 |
TAFE 3 |
TAFE 4 |
|---|---|---|---|---|
|
Not completed prior to a student's enrolment |
☒ |
☒ |
☒ |
|
|
Did not adequately assess student's suitability for the qualification |
☒ |
☒ |
☒ |
☒ |
|
Did not adequately assess student's appropriateness for the qualification |
☒ |
☒ |
||
|
Proposed learning strategies and materials not appropriate for students |
☒ |
☒ |
Note: Non-compliances may be based on single or multiple occurrences across the sampled student files, student data, and relevant business process documentation.
Source: VAGO.
However, we found examples where Quality Reviews reported that a TAFE's pre‑training reviews were non-compliant based on requirements that are not clear in the contract. Two reviews identified non-compliant pre-training reviews on the basis that the literacy and numeracy test did not ascertain the individual's literacy and numeracy levels in line with the ACSF's five core skills of learning, reading, writing, oral communication and numeracy. However, the contract does not require TAFEs to assess a prospective student's literacy and numeracy skills using the ACSF.
The reviews' focus on the ACSF's five core skills reflects the audit worksheets that the department provides to its auditors. These worksheets ask auditors to 'consider the ACSF levels described in the training and assessment strategy for the program(s)' when reviewing TAFE literacy and numeracy assessments.
TAFEs developed action plans to address the identified non-compliances in the four Quality Reviews we examined. Under clause 11.3(b) of the contract, an audited TAFE must write to the department within six months of the audit's finalisation on its progress in implementing the rectification plan and provide supporting evidence. While all four TAFEs did write to the department within this time frame, they provided varying amounts of supporting evidence:
- Two TAFEs submitted revised pre-training review templates and guidance showing how they had addressed each action.
- A third TAFE wrote to the department claiming that it had addressed all enrolment-related actions, but did not submit any further evidence or commentary.
- A fourth TAFE provided detailed commentary showing progress against each action but did not submit any supporting evidence.
The department plans to review TAFE progress against their action plans during its 2019 audit program, commencing in September 2019. These audits will examine enrolments as far back as 2017 and include assessments of TAFEs' business processes and transactional compliance.
Managing external audits
|
The department engages the VET Development Centre to deliver professional learning to VET providers and its auditors. |
The department manages its contract audit providers by delivering induction sessions, providing templates and guidance, holding quarterly meetings to identify emerging issues, and mandating attendance at VET Development Centre professional development workshops.
This helps to clarify the department's audit methods and areas of focus. However, in some cases this approach has driven inconsistent interpretations of enrolment-related contractual requirements between TAFEs and audit providers. The department's audit worksheets for the Quality Review require audit providers to answer specific questions that are tied to relevant contract clauses. However, some audit questions misrepresent their corresponding clauses. Figure 4D shows these inconsistencies.
Figure 4D
Inconsistencies between 2018–19 contract requirements and audit worksheets
|
Contract clause |
Audit question |
VAGO assessment |
|---|---|---|
|
Schedule 1, clause 5.1 (a) |
'Do the student's interests and aspirations (as documented in the pre-training reviews) align with the training package and programs the individual has enrolled in?' |
Contract clause only requires that the pre-training reviews 'ascertain the individual's aspirations and interests with due consideration of the likely job outcomes from the development of new competencies and skills'. |
|
Schedule 1, clause 5.1(b) |
'Do the student's capabilities align with the learner characteristics, course entry requirements and course pre-requisites documented in the training and assessment strategy for the program the student has enrolled in?' |
Contract clause only requires that the pre-training reviews 'consider the individual's educational attainment and capabilities'. |
|
Schedule 1, clause 5.1(c) |
'Was the nature and scope of the literacy and numeracy assessment sufficient to indicate whether the student possesses the minimum literacy & numeracy skills to successfully complete the training they are enrolled in? Consider:
|
Contract clause only requires that the pre-training reviews 'include consideration of literacy and numeracy skills'. |
Source: VAGO.
The department advised that the above audit questions also incorporate clause 5.4 of Schedule 1. This clause requires TAFEs to document how they determine the course or qualification an individual enrolled in was the most suitable. However, this connection is not evident in the department's audit worksheets and remains unclear for audited TAFEs.
Departmental improvements to enrolment requirements
The department reviewed the 2017 contract and TAFE enquiries submitted through the SVTS to identify areas where it could clarify or improve the 2018–19 contract. In late 2018, the department reviewed the 2018–19 contract as part of developing a curated version for TAFEs.
Figure 4E shows that the department has made several key improvements to enrolment requirements in the 2018–19 contract following these reviews.
Figure 4E
Key improvements to enrolment requirements in the 2018–19 contract
|
Change |
Rationale/benefit |
|---|---|
|
Sighting and retaining evidence of eligibility The contract no longer requires TAFEs to sight and retain an original or non-certified copy of evidence of eligibility where it uses an online document verification service. Instead, TAFEs have to retain the prospective student's unique verification number, as well as secure access to the document verification service. The contract now allows TAFEs to rely on previous eligibility checks of citizenship and age for subsequent enrolments, provided that this information remains valid. |
Reduces the administration burden for TAFEs and prospective students. |
|
Timing of the pre-training reviews and provision of statement of fees TAFEs are now required to provide individuals with a statement of fees prior to the commencement of training, rather than prior to enrolment. TAFEs no longer have to undertake a pre-training review prior to enrolment. Instead, it can now occur either as part of enrolment or prior to training commencement. |
Reduces the administration burden for TAFEs. Recognises the significant time needed for TAFEs to complete these activities for prospective students who may not end up enrolling. |
|
Checking evidence of concession The Guidelines about Fees—Skills First Program removed the reference to one week as a reasonable grace period in which TAFEs can accept evidence of concession if it is not provided before beginning training. Where a grace period applies, TAFEs must still ensure the concession that is eventually presented was valid at the time of commencement of training. |
Recognises that it can take a longer time for Centrelink to process applications for concession entitlement. |
|
Training to be provided in Victoria The wording of clause 5.3 was amended to clarify that its intent is not that a prospective student must be a 'resident' of Victoria to undertake training, but that the TAFE must deliver training within Victoria. |
Minimises the risk of TAFEs misinterpreting the contract and unnecessarily excluding prospective students from enrolling. |
|
Electronic signatures The 2018–19 contract clarifies instances where the department will accept an electronic signature. |
Minimises the risk of TAFEs misinterpreting the contract and unnecessarily seeking physical signatures as part of enrolment. |
|
Customising the training plan for individual needs The second version of the 2018–19 contract clarifies the requirement that a student's training plan be customised to reflect the outcomes of the pre-training reviews. It details that where the pre-training review identifies the need for particular support, and the support to be provided is documented separately, this may be referred to, rather than included, in the training plan. |
Reduces the administration burden for TAFEs. |
Source: VAGO.
The department's reviews of the 2017 and 2018–19 contracts sought to address enrolment requirements that are inefficient or unclear based on TAFEs' feedback. While this is positive, there remains a need for clearer requirements for assessing a prospective student's literacy and numeracy skills.
4.4 TAFEs' internal audits of contract compliance
Under contract clause 11.4, each TAFE must conduct an annual internal audit of their compliance with the contract, including enrolment requirements. Where an internal audit reveals non-compliance, the TAFE must:
- promptly notify the department
- develop a rectification plan to address the non-compliance within a reasonable time
- provide the department, or its auditors, with a copy of the rectification plan on request.
All five TAFEs internally audit their compliance with the contract's enrolment requirements and act on any non-compliances. In contrast, separate TAFE compliance assessments that follow the department's internal audit checklist produce conflicting results that show full compliance. The non-prescriptive design of the department's checklist is driving this inconsistency.
The department's internal audit checklist
The department provides TAFEs with an optional internal audit checklist template to help them assess their contractual compliance. The department expects TAFEs to supplement this checklist with other forms of ongoing compliance monitoring.
The checklist is of limited value because it does not specify any compliance criteria or testing methods other than referencing the contract's clauses. It includes some 'key audit considerations' for different groups of clauses, but these are general in nature and focused on eliciting details about TAFEs' processes, rather than their level of compliance. The audit findings produced by using the checklist are therefore unlikely to be reliable or comparable between TAFEs.
The checklist's open-ended design is also at odds with the audit worksheets used by the department's external auditors, which have more prescriptive criteria. This inconsistency further encourages conflicting interpretations of contractual requirements between external auditors and TAFEs.
Internal audit checklist results from 2018
All audited TAFEs except SuniTAFE supplied us with evidence showing their completion of contractual compliance audits during 2018 using the department's checklist. SuniTAFE completed a 2018 internal audit of contractual compliance using its own audit tool, which is more prescriptive than the department's checklist.
The four TAFEs that did use the department's internal audit checklist in 2018 all reported full compliance with the enrolment-related aspects of the contract.
Using its own audit tool, SuniTAFE identified instances of non-compliance with the contract in relation to:
- the pre-training reviews
- eligibility
- fees—concessions, waivers and exemptions.
Findings from other TAFE internal audits
In addition to completing the department's internal audit checklist, Box Hill, Melbourne Polytechnic and William Angliss undertook further internal audits that examine the enrolment process in greater detail than the department's internal audit checklist. Three of these TAFEs' internal audits identified enrolment-related contract non-compliances that conflict with the full compliance reported in their completed checklists:
- Box Hill performed three separate internal audits that examined, among other areas, the enrolment process. These identified multiple instances where the TAFE had left parts of the pre-training reviews incomplete.
- Melbourne Polytechnic undertook an internal audit of its compliance with the contract during 2018. This revealed common instances where students had not signed and/or dated their training plan, and where the TAFE had not adequately documented outcomes of an individual's pre-training reviews in relation to course suitability. The audit also found one instance where there was no record of the TAFE performing the pre-training review.
- William Angliss undertook an internal audit of its compliance with the contract during 2018. It found separate instances where the TAFE did not fully complete the pre-training reviews or the eligibility assessment. It also found cases where the TAFE had not satisfied the evidence requirements for assessing eligibility and applying fee concessions.
As these three TAFEs did not consider the above issues when completing the department's internal audit checklist, the department would not be aware of them unless they were identified through an external audit. However, it is the high-level, process-focused design of the department's internal audit checklist that is at the root cause of the TAFEs' inconsistent internal audit results.
For example, the department's checklist asks the TAFE questions about its processes and controls for completing the pre-training reviews and eligibility assessment, while TAFEs' own internal audit activities focus on whether they have enrolled students in accordance with the contract.
All five TAFEs developed rectification plans that show that they either have addressed, or are addressing, the enrolment issues identified in their supplementary 2018 internal audits. These typically focus on:
- reminding staff of their compliance obligations
- revising templates, guidelines and processes
- committing to follow established processes more consistently
- further investigating non-compliances to determine their root causes.
It is positive that through their internal audit activities, each TAFE is actively working to achieve ongoing compliance with the enrolment requirements under the contract.
Appendix A. Submissions and comments
We have consulted with the department, Box Hill, Melbourne Polytechnic, SuniTAFE, Swinburne and William Angliss, and we considered their views when reaching our audit conclusions. As required by the Audit Act 1994, we gave a draft copy of this report, or relevant extracts, to those agencies and asked for their submissions and comments. William Angliss chose not to submit a response.
Responsibility for the accuracy, fairness and balance of those comments rests solely with the agency head.
Responses were received as follows:
RESPONSE provided by the Secretary, Department of Education and Training
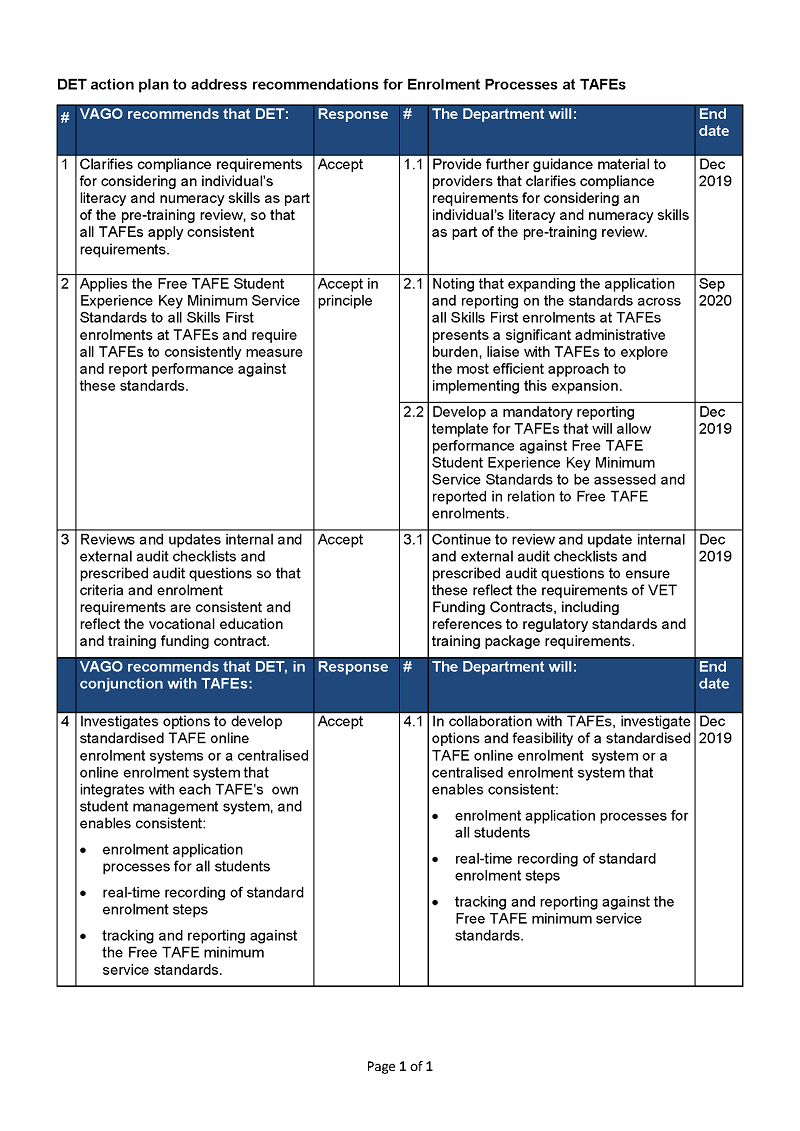
RESPONSE provided by the Managing Director and Chief Executive Officer, Box Hill
RESPONSE provided by the Chief Executive, Melbourne Polytechnic
RESPONSE provided by the Chief Executive Officer, SuniTAFE
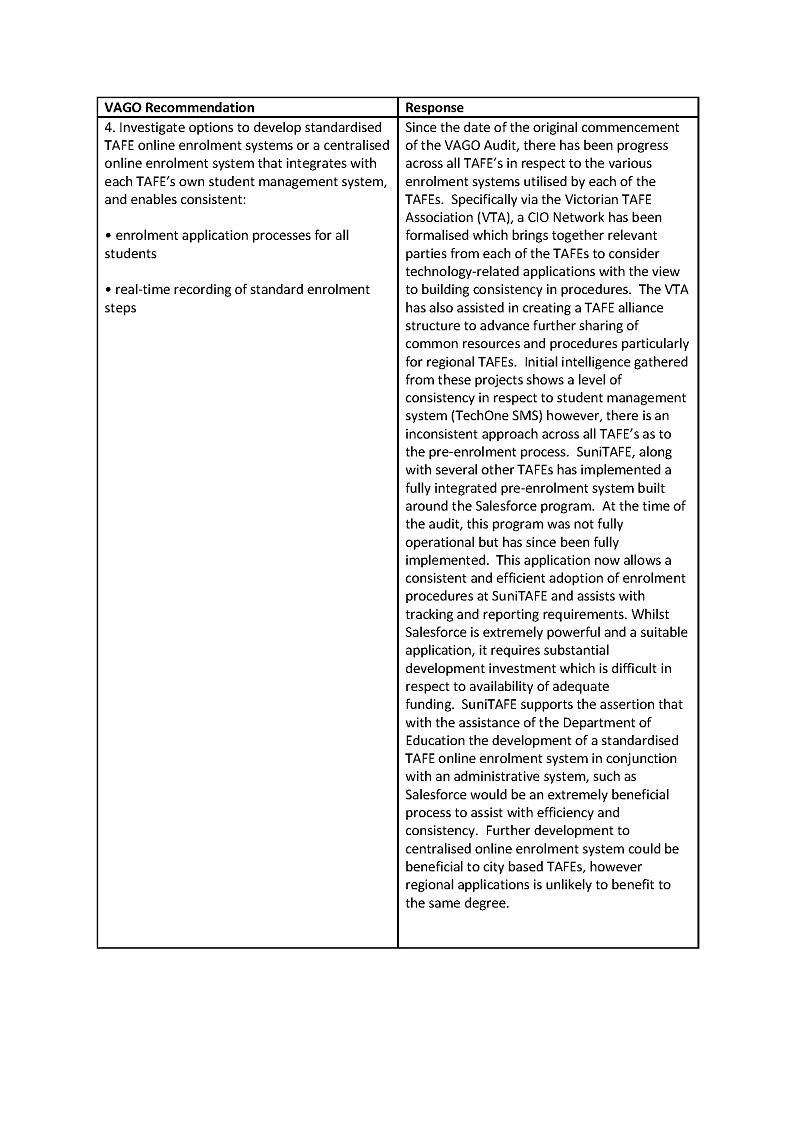
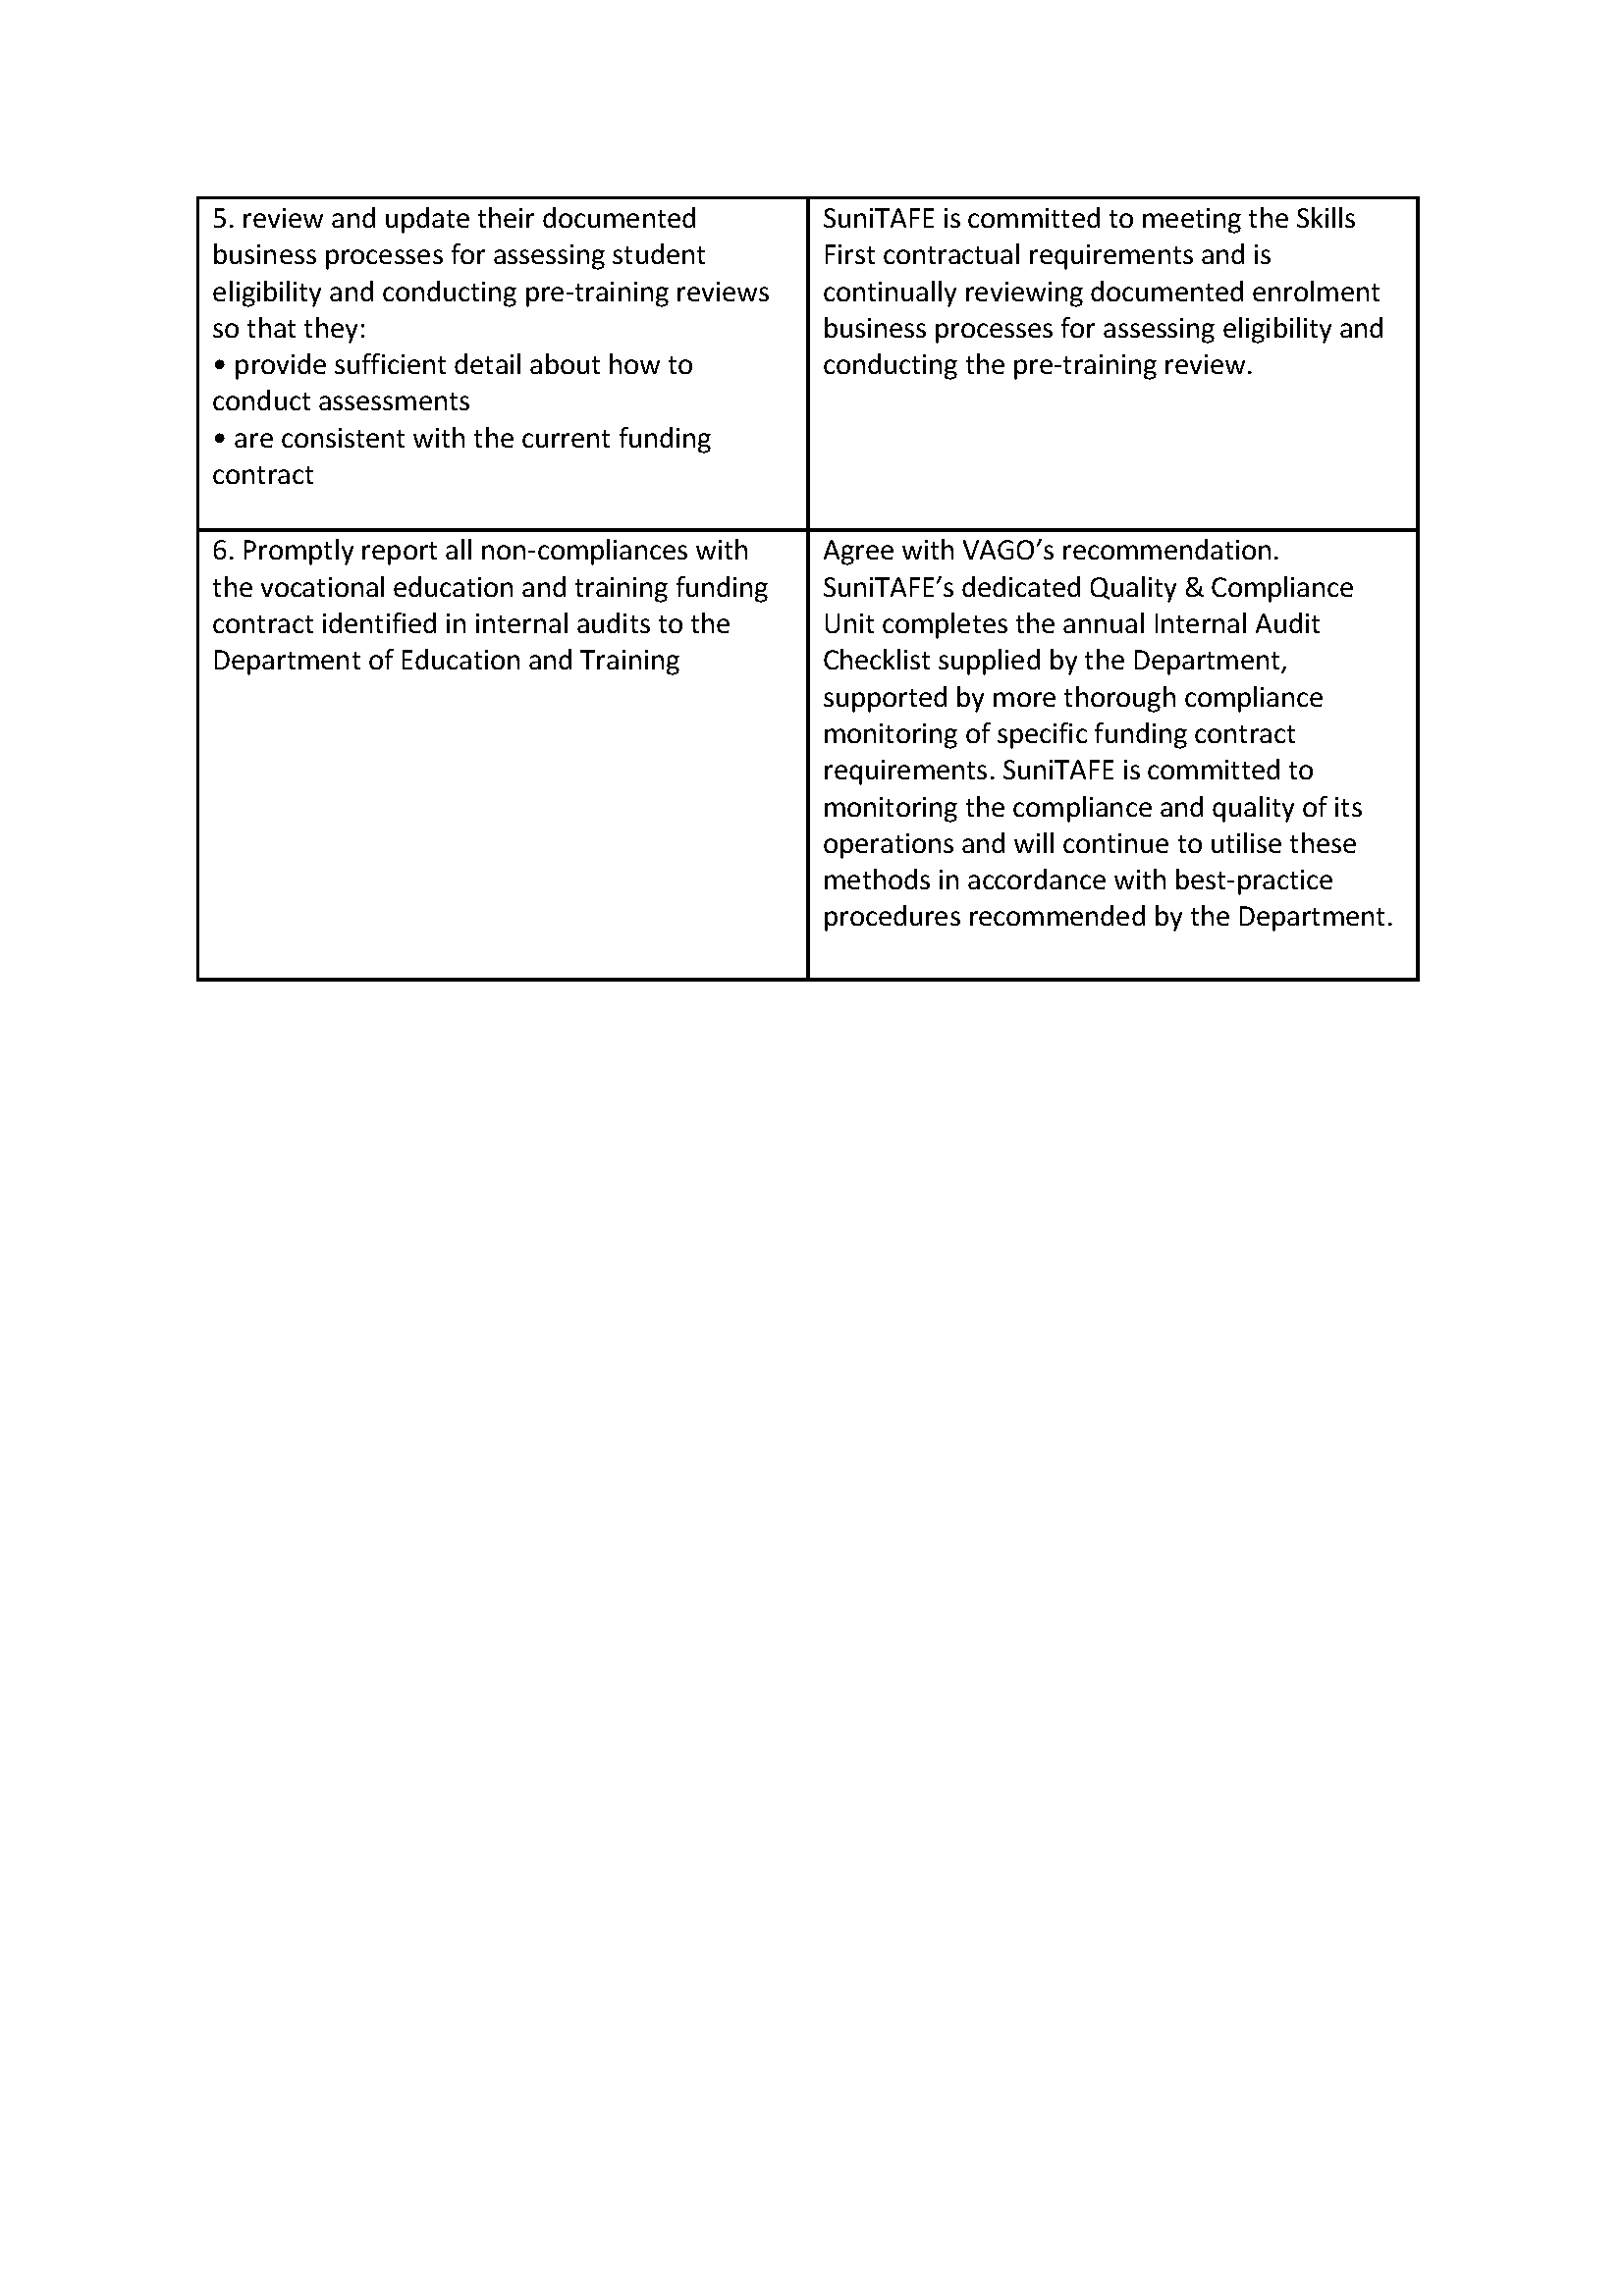
RESPONSE provided by the Deputy Vice-Chancellor, Swinburne
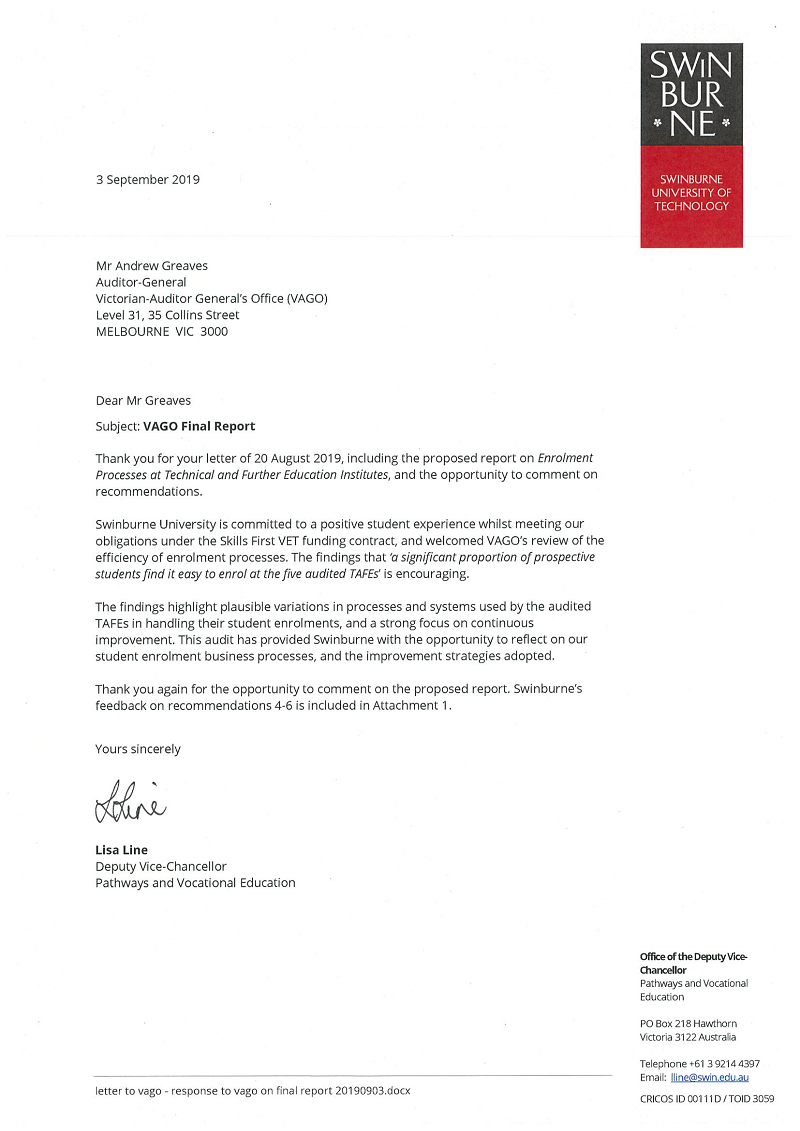
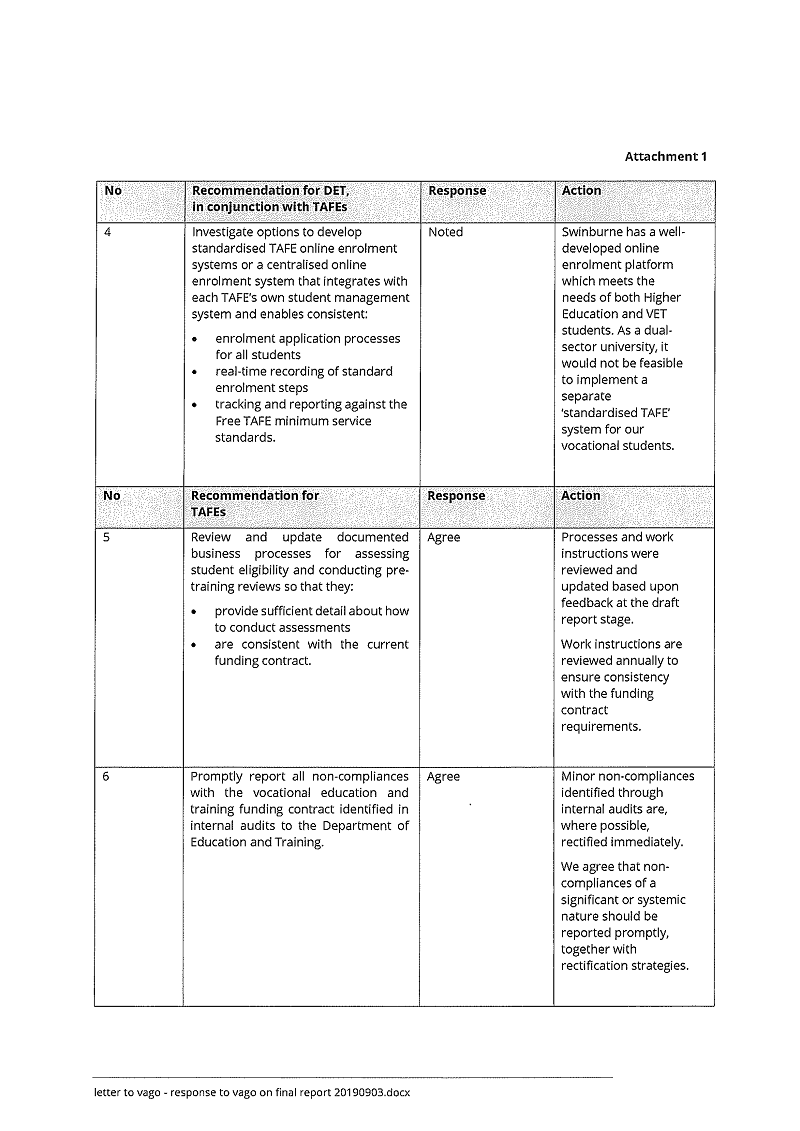
Appendix B. The contract's key enrolment requirements
This appendix summarises the key enrolment requirements under the contract and its supporting guidelines.
Figure B1
The contract's key enrolment requirements
|
Key requirements |
|---|
|
Provide information to individuals about eligibility, courses, fees, and support |
|
TAFEs must provide accurate information about:
TAFEs must publish information about fees on its website. |
|
Assess individual's eligibility in accordance with eligibility requirements |
|
TAFEs must ensure individuals meet eligibility requirements for:
TAFEs must:
|
|
Pre-training reviews |
|
TAFEs must complete a pre-training reviews to determine if the course is suitable for the individual. It must consider their:
|
|
TAFEs must also:
TAFEs cannot subcontract any aspect of the pre-training reviews. The pre-training reviews must occur as part of enrolment or prior to training. |
|
Statistical questions |
|
TAFEs must:
Individuals must sign a privacy notice as part of the standard enrolment questions. |
|
Statement of fees |
|
The TAFE must provide individuals with the following information about the course in hard copy or electronic form:
TAFEs must:
|
|
Training plan |
|
The TAFE must provide individuals with the following information in hard copy or electronic form:
TAFE and individual must sign and endorse the training plan. |
Source: VAGO, based on the contract.
Appendix C. TAFEs' enrolment process maps
This appendix maps the five audited TAFEs' enrolment processes from the viewpoint of prospective students. As discussed in Part 1, we examined the standard pathway of a domestic applicant seeking to enrol in a Skills First course. We did not investigate the enrolment process for:
- international students
- full-fee-paying students
- apprentices or trainees
- individuals that require specialist assistance, such as non‑English‑speaking migrants.
Although our process maps do not reflect these cohorts' experiences, TAFEs must manage their pathways alongside the standard domestic applicant, which may present different issues and complexities. In addition, as our maps are from the viewpoint of prospective students, they do not include back‑of‑house administrative tasks.
Please note:
- coloured shapes designate start and end points for prospective students; clear shapes designate key touchpoints for both parties; and the double‑lined shapes designate decision points for the TAFE
- green shapes represent the enquiry phase; purple shapes represent the application phase; orange shapes represent key assessment periods; and blue shapes represent the enrolment finalisation phase
- computer symbols represent activities that prospective students can complete remotely online, while people symbols represent activities that the prospective student must complete in-person.
- Box Hill Institute (BHI)
- Melbourne Polytechnic (MP)
- William Angliss Institute of TAFE (WAI).
We have made two process maps for Box Hill to represent their older process and their new system.
Figure C1
Box Hill's new enrolment process
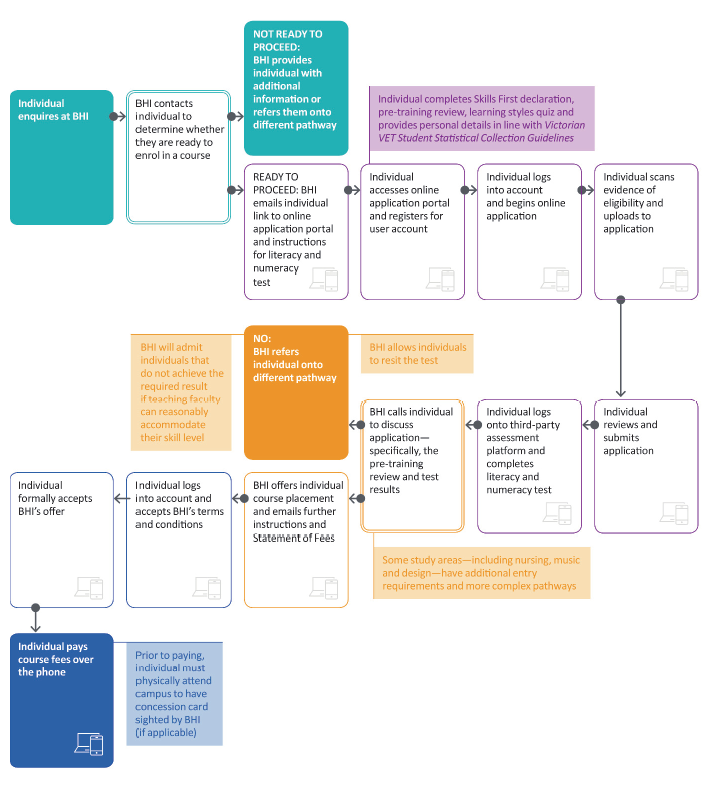
Source: VAGO.
Figure C2
Box Hill's older enrolment process
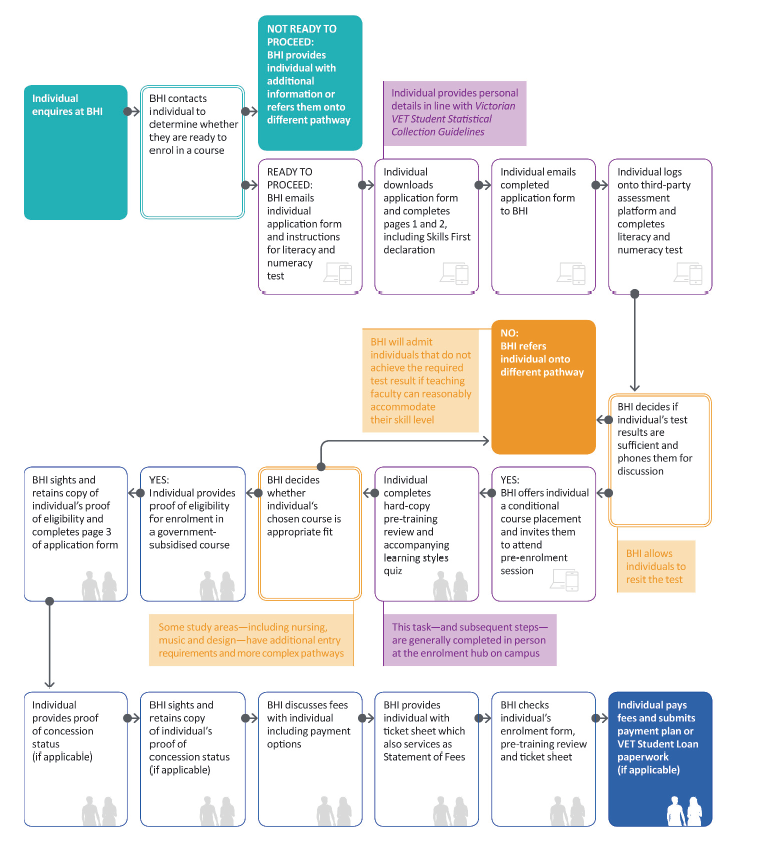
Source: VAGO.
Figure C3
Melbourne Polytechnic's enrolment process
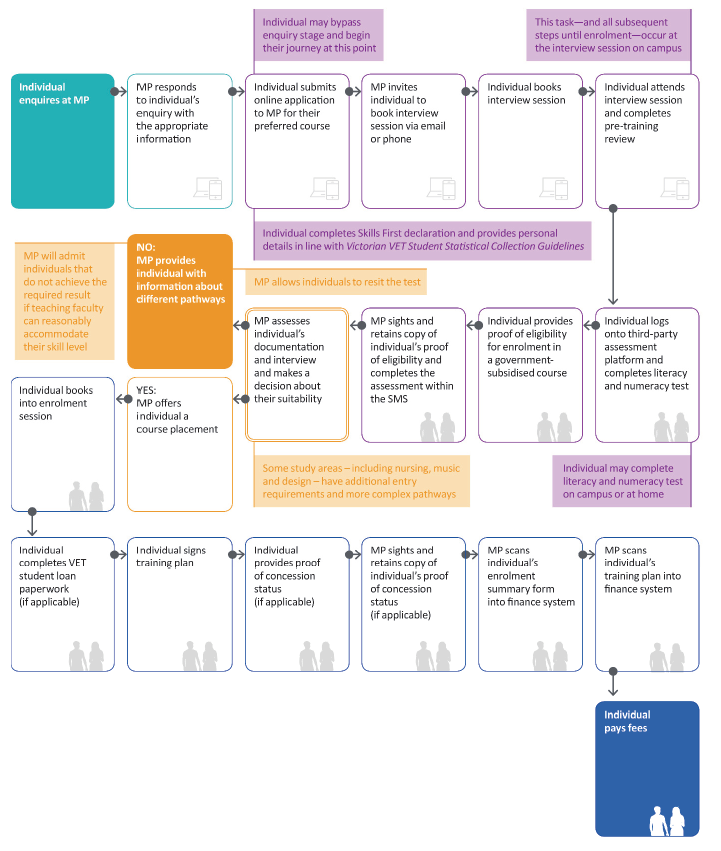
Source: VAGO.
Figure C4
SuniTAFE's enrolment process
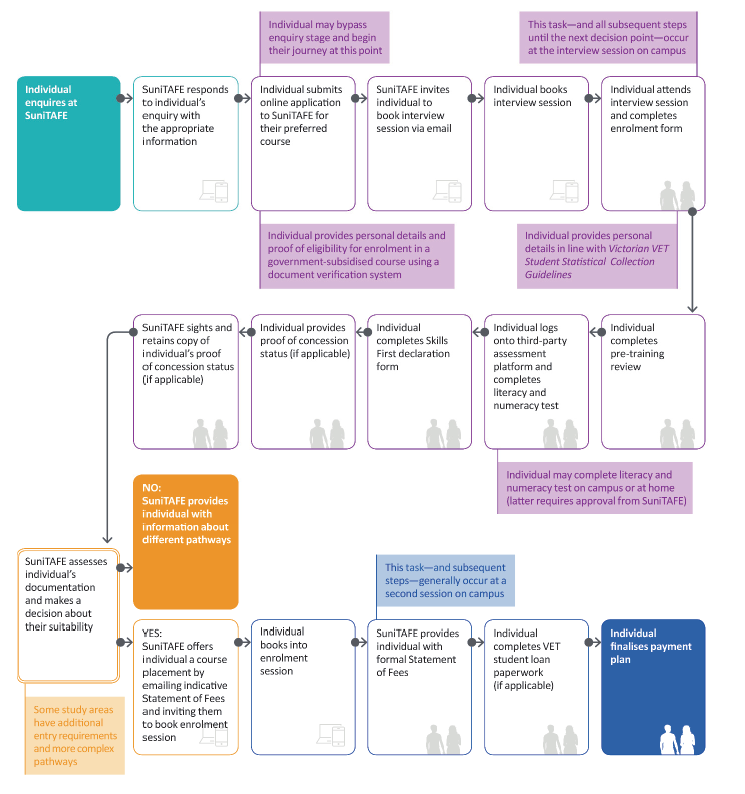
Source: VAGO.
Figure C5
Swinburne's enrolment process
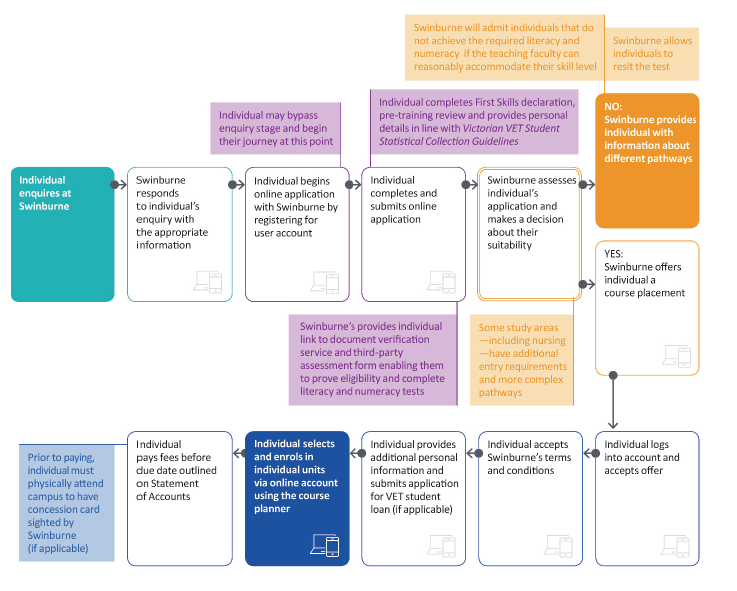
Source: VAGO.
Figure C6
William Angliss' enrolment process
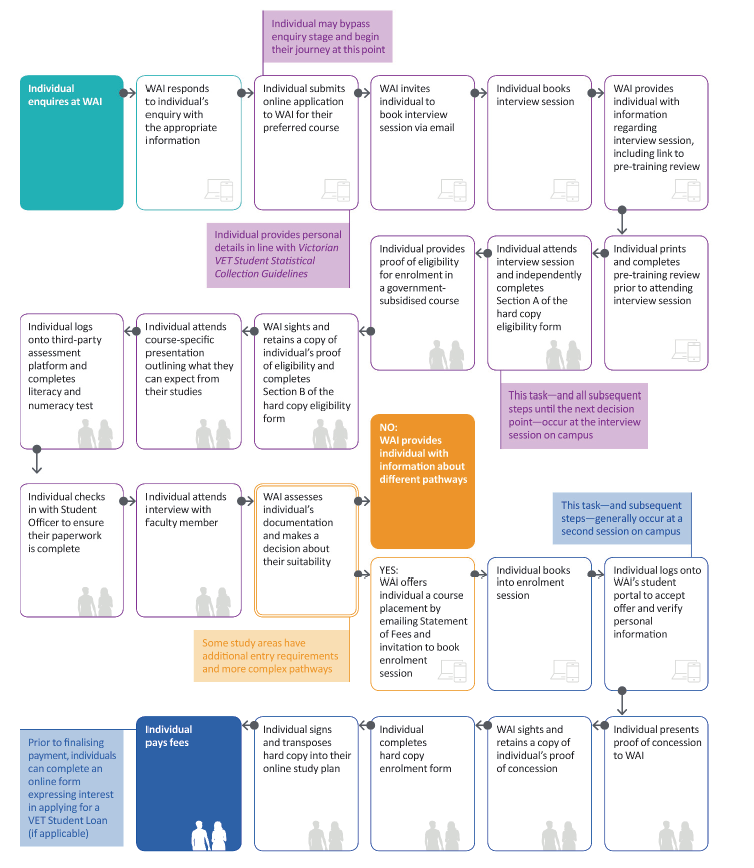
Source: VAGO.
Appendix D. Survey results
This appendix summarises results from our online survey of individuals who enquired about enrolment or enrolled at one of the five audited TAFEs between 1 October 2018 and 28 February 2019. We present the survey results that support findings discussed in the report.
How to interpret survey results
We reported survey estimates using a 90 per cent confidence interval, calculated with a margin of error for each TAFE.
The margin of error measures how accurately a survey estimate represents the larger population of individuals who may have enquired or enrolled at each TAFE. We report the margin of error for each TAFE in Figure D1.
The margin of error for each TAFE must be applied to all estimates to calculate a confidence interval. The confidence interval shows the range of values for which we can be 90 per cent confident that the true value for the population lies within. For example, if 65 per cent of survey respondents at Box Hill enrolled online, we apply a margin of error of ± 4 and can be 90 per cent confident that the true value lies between 61 and 69 per cent.
Differences between survey responses are meaningful when the confidence intervals for an estimate do not overlap. For example, we can be 90 per cent confident that more individuals at Box Hill enrolled online (61 to 69 per cent) than over the phone (34 to 42 per cent), as the confidence intervals do not overlap.
Figure D1
Response rate for VAGO survey of prospective TAFE students
|
TAFE |
Invitations sent |
Responses received |
Response rate (%) |
Margin of error (%) |
|---|---|---|---|---|
|
Box Hill |
8 519 |
504 |
5.92 |
± 4 |
|
Melbourne Polytechnic |
11 048 |
521 |
4.72 |
± 4 |
|
SuniTAFE |
1 106 |
76 |
6.87 |
± 9 |
|
Swinburne |
1 512 |
73 |
4.83 |
± 9 |
|
William Angliss |
1 969 |
79 |
4.01 |
± 9 |
|
Total |
24 154 |
1 253 |
5.19 |
n/a |
Source: VAGO.
Figures D2 to D8 detail the responses to survey questions that we used to support our audit findings.
Figure D2
Question 4: Overall, how easy or difficult was it for you to apply and enrol at your TAFE? (select one response)
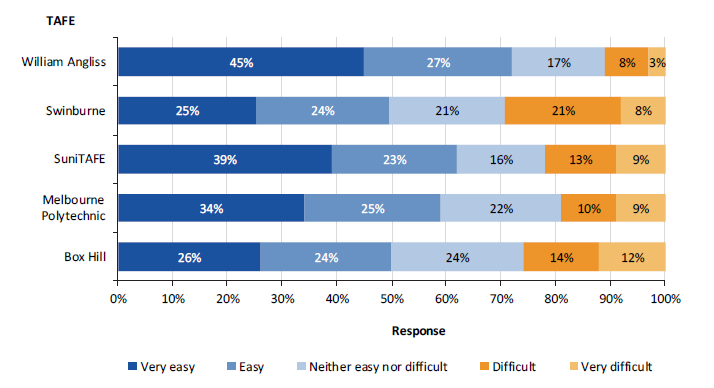
Note: Percentages have been rounded.
Source: VAGO.
Figure D3
Question 7: How did you enquire, apply and enrol into the course? (select all that apply)
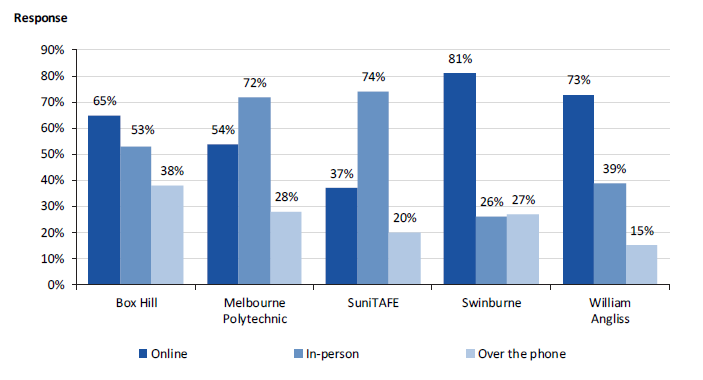
Source: VAGO.
Figure D4
Question 8: How would you like to apply, enquire, and enrol? (select all that apply)
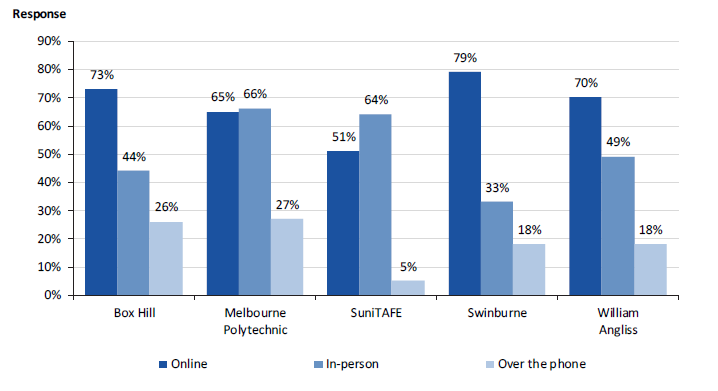
Source: VAGO.
Figure D5
Question 9: How many visits did you make to your TAFE in person as part of the enrolment process? (select one response)
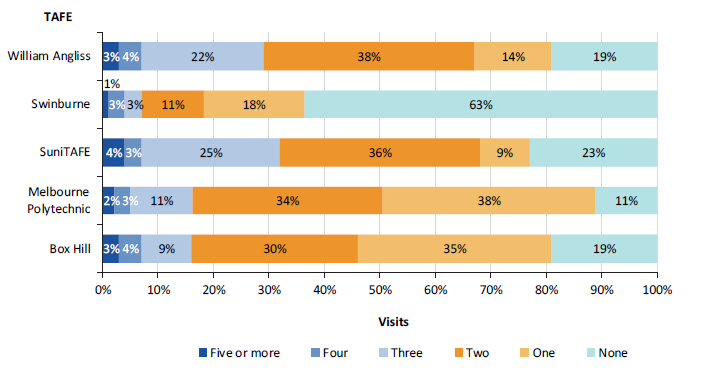
Note: Percentages have been rounded.
Source: VAGO.
Figure D6
Question 13: Thinking about the enrolment steps that you completed, about how much time in total did those steps take to complete? (select one response)
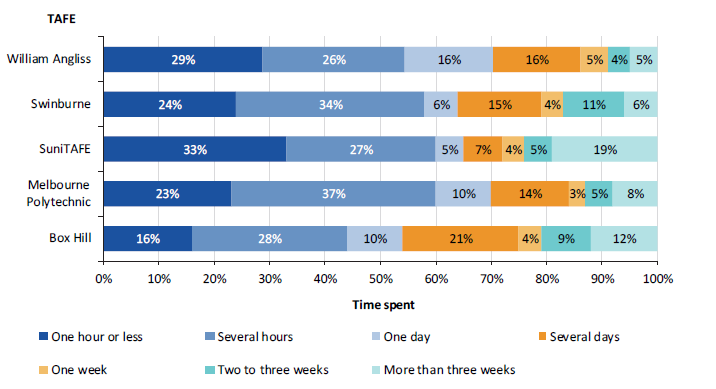
Note: Percentages have been rounded.
Source: VAGO.
Figure D7
Question 14: Did you end up enrolling in the course that you applied to? This means that you enrolled in units and/or received a statement of fees (select one response)
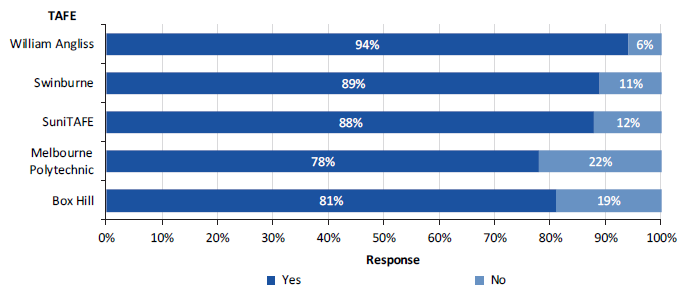
Source: VAGO.
Figure D8
Question 15: (when the answer to Question 14 is 'No') Why did you not enrol in the course? (select one response)
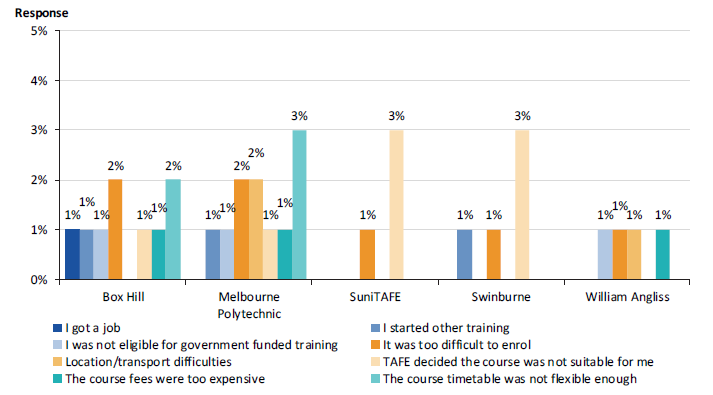
Note: Reported percentages calculated for the total proportion of respondents for each TAFE, to enable comparisons with other survey items.
Source: VAGO.
Appendix E. Calculation of confidence intervals and bootstrapping test results
Figures E1 and E2 detail confidence intervals and bootstrapping test results for the median time taken to process an individual's enrolment at Melbourne Polytechnic, Swinburne, and William Angliss. Bootstrapping is used to calculate confidence intervals for median enrolment time. The bootstrapping technique uses repeated resampling of data (with replacement) to determine variation in an estimate.
Method
Figure E1 details the start and end points for the enrolment processes managed by each TAFE, based on their unique enrolment systems. We assessed the pathways of each individual that finalised their enrolment at the three TAFEs and extracted the times and dates for their unique start and end points.
Figure E1
Enrolment start and end points and time frames used for calculation of median processing time
|
TAFE |
Start point |
End point |
Time frame |
|---|---|---|---|
|
Melbourne Polytechnic |
Student submits online application form |
TAFEs issues student with receipt |
January 2017 to December 2018 |
|
Swinburne |
Student commences online application form |
TAFEs offers student a place in the course |
January 2017 to March 2019 |
|
William Angliss |
Student submits online application |
TAFE supports student to enrol in units |
August 2018 to March 2019 |
Note: Our analysis for Swinburne begins when the prospective student commences their application, as Swinburne's online application form contains critical enrolment steps, such as eligibility testing, the pre-training review, and literacy and numeracy testing.
Note: We have chosen end points that correspond with the stage that the TAFE's involvement in the enrolment process ceases. At this point, the enrolment process may become wholly driven by the student or conclude.
Source: VAGO.
Figure E2 presents the median time taken for TAFEs to process an individual's enrolment, as well as the 95 per cent confidence interval of the estimation of the median. The lower and upper bounds of the confidence interval show the range of values that we are 95 per cent confident the true median enrolment times lies within.
Figure E2
TAFE median enrolment time and confidence intervals
|
TAFE |
Number of individuals |
Median enrolment time (days)— 50th percentile |
Median enrolment time (days)— 2.5th percentile |
Median enrolment time (days)— 97.5th percentile |
|---|---|---|---|---|
|
Melbourne Polytechnic |
11 197 |
10.03 |
9.72 |
10.78 |
|
Swinburne |
8 037 |
6.45 |
6.34 |
6.54 |
|
William Angliss |
518 |
61.02 |
57.52 |
63.40 |
Source: VAGO.
We also used bootstrapping to estimate the time difference between each pair of TAFEs separately, using a 95 per cent confidence interval:
- Swinburne is 3.26 to 4.35 days faster than Melbourne Polytechnic.
- Melbourne Polytechnic is 47.49 to 53.24 days faster than William Angliss.
- Swinburne is 51.09 to 56.97 days faster than William Angliss.